Stock positional Trading strategy

We always hear this quote in trading, “Buy low, Sell high”. “Buy the fear, Sell the Greed”. So I wanted to test the scenario of what if we Buy top loser from the Fno Stock list and sell it next month . There are 150+ stocks in FnO list, among this list, we will find which stock has lost the most in a month, and buy that in cash segment. We will hold that stock for one month and exit it after a month, and again find which stock lost the most, repeat the process month after month.

So I took data from 2008 to 2020, and also considered FnO list of stocks that belongs to those specific years, if we take current FnO list and test the scenario, it would end up in survivor bias, and wouldn’t give us the correct result, so it is essential to test the rules with correct list of stocks.

Rules:

  1. Find the top loser from the FnO stock list at the end of every month.
  2. Buy that ONE stock and exit it after a month.
  3. Repeat the process.

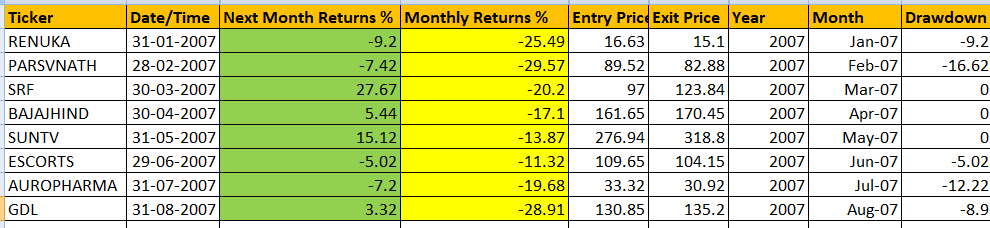
In the below table, returns has been calculated month after month from 2007 Jan onward, Yellow column denotes the % returns for the month, as per the rules, we take the top loser, so as per the historical data Renuka Sugars which was part of FnO stock list 2007 was the top loser for Jan month with -25%, so we bought that at 16.6 Rs. and we exit it next month at 15.1.

It ended up in loss, but out of 12 months, we would be able to capture some big winning stocks, like SRF in March 2007, Sun Tv in May 2007, all these returned much higher returns.

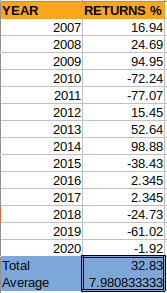
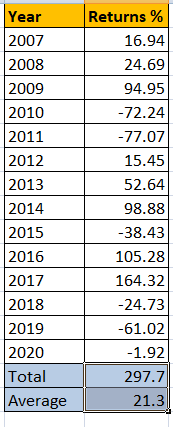
The strategy has returned 260% returns over all from 2007 to 2020 with yearly average returns of 21% .However, if you note years like 2010/2011 it has given huge loss.

Conclusion:

Buying the loser and selling it next month has shown positive returns over all when tested with 13 years of data, we can conclude there is some trading edge here, however we need to add more filters/rules to bring down the draw down, so that risk is lesser. In above analysis, we did not use any stop loss, we just buy and exit next month, if we use a fixed stop loss, it can reduce your risk to a greater percentage. You can try adding your own set of rules to this logic and make it more robust. If you liked this article, please do share share it (Whatsapp, Twitter) with other Traders/Investors.

source: https://bit.ly/322r5Zj

Well, i feel that this strategy has a lot of factors that haven’t been considered and is far from truth. To start with, when you say ‘Buy Low, Sell High’ you are essentially value investing and when you are value investing in stocks you are basically looking for stocks that are trading below their intrinsic value. Moreover, these strategies might resemble but “Buy Low, Sell high” isn’t necessarily the same as “Buy Fear, Sell Greed”.

Almost all of the times, the intrinsic value of a company is determined by the fundamentals. But in your case, the stocks were chosen at random with the criteria that they have been the top losers for a month. But, for that strategy to work I think it is very important to understand the reason why that particular stock was a loser for the month. Because, if the stock was a loser due to the changing fundamentals(basically bad earnings, profitability) then the intrinsic value has essentially decreased and hence, you shouldn’t be buying that stock at all as that wouldn’t be considered as value investing ( or buying low and selling high).

Now, coming to the part of “Buy Fear, Sell Greed”. It means, temporary changes in market conditions that affect the market value of the stocks that haven’t been justified and doesn’t reflect the true value of a company. For example, “Unjustified Pessimism”, “Bubbles” which interprets to “Buy Fear” and “Sell Greed” respectively.

So coming back to your strategy, ‘Buy Low, Sell High’ was never meant to be used the way you intended, so treating it as a different strategy, I still wouldn’t like to consider that as profitable strategy.
Let me explain why, your data has a lot of high bias due to the above mentioned reasons. Secondly, your data has a really high variance and is completely deviated. If you look at the year 2016 & 2017 they do not really make sense of the overall data as they are outliers. So in order solve that, what I did was, I removed those 2 data points and instead replaced them with the average of the overall data in order to keep the variance low and decrease the deviation. I didn’t replace 2010 and 2011 because they may seem like an outlier but they don’t necessarily impact the data by high amount. Here is the result that pertains to the truth:

Screenshot from 2020-08-18 12-22-36

It isn’t necessarily a profitable strategy and this is the quantitative analysis because if you look at it qualitatively your strategy relies heavily on the historical data of the overall market. It isn’t a nice way to rely on the historical returns of market as they are very unpredictable and the forces are out of control. That is why you don’t see anyone predicting the future condition of the market especially over the long term, the ones who tried have essentially screwed themselves over. So it doesn’t necessarily mean the returns you are getting currently will continue to be the same. And, when it comes to long-term investing I am not really fan of all these fancy strategies. To conclude, in my experience I would say value investing is the only long term strategy that is well-tested, time-tested and truly profitable and due to its simplicity is what makes it one of the most powerful investment strategies.

Anyway, your strategy was a nice try though and truly appreciate that you are taking time to share your knowledge with others.

1 Like

Hi, thanks for the work and insight!
Can you tell from where to get such old historical data from 2007? Zerodha Historical data is from 2015 only