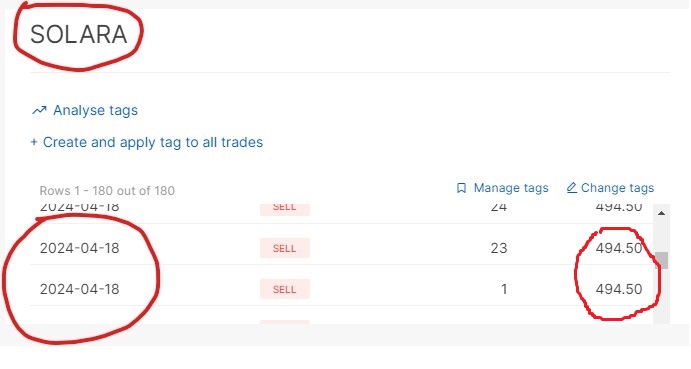
I was analysing a trade I did on April 18th for the stock SOLARA Active pharma(NSE: SOLARA).
The sale value on April 18th for this stock is shown as 494.50 whereas the highest the stock reached on April 18th was 456.
I have cross checked with both trading view and Chart IQ. Has anyone else faced the same issue? I have observed this on another occassion with another stock. I checked if this issue is faced by others but didnt get any link so posting as a question here. Appreciate any inputs on this.
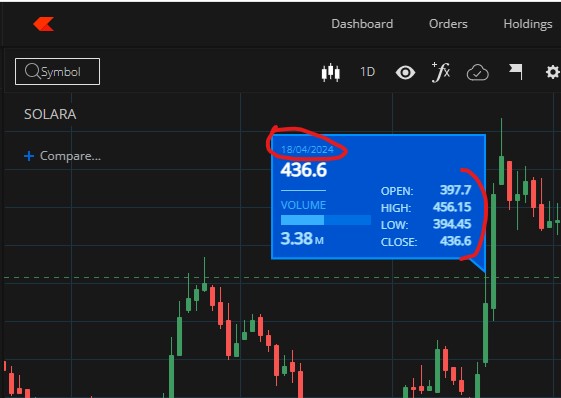
The charts have been adjusted for rights issue company did recently. Hence, you’re not able to see this price on charts.
SOLARA had announced rights issue in the ratio of 1:3, the charts have been adjusted as per this. On Kite, we adjust charts for corporate actions like extraordinary dividends, bonus, split, rights issues, etc.
1 Like
Thanks a lot!! This was driving me nuts. The other chart I observed the same issue was India Bulls Housing finance and they too had their rights issue out in Feb this year. Chart adjustment indeed must be the cause.
1 Like