Trading on shorter time frame is extremely irritating due to higher fluctuations, with tons of news, company related information pouring in, there is always too much of noise on daily basis. Every Trend followers nightmare is whipsaws. How to avoid it?
Before you capture that one big trend, we end up losing often due to whipsaws. If you are searching for some secrets to avoid whipsaws in trading, better stop that search, because there is no way we can avoid whipsaw, its just a part of trading. However, there are ways to reduce whipsaws. If one has to follow a trend following approach on positional trading or swing trading basis, its wise to move from shorter time frame to larger time frame, this will largely reduce false breakouts to greater extent.
Let’s see Daily vs Monthly time frame pros and cons.
200 Day moving average:
It is one of the most widely used indicator, a close below 200 day moving average usually indicates a bearish sign, and if a stock trade above 200 day moving average, then it is considered as bullish.
Pros:
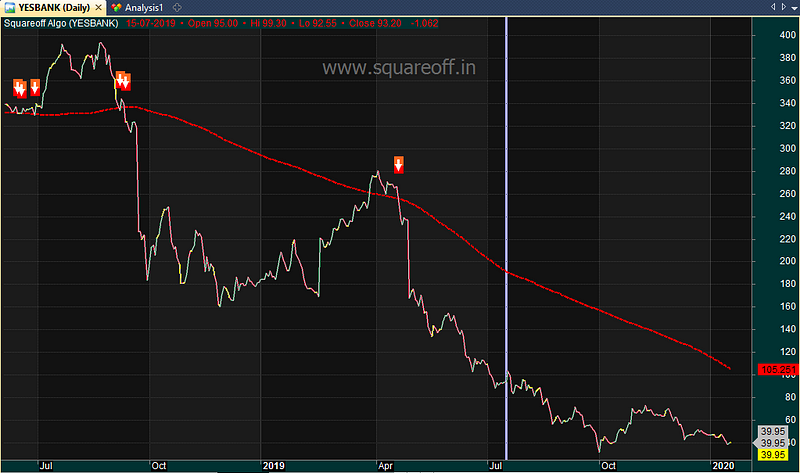
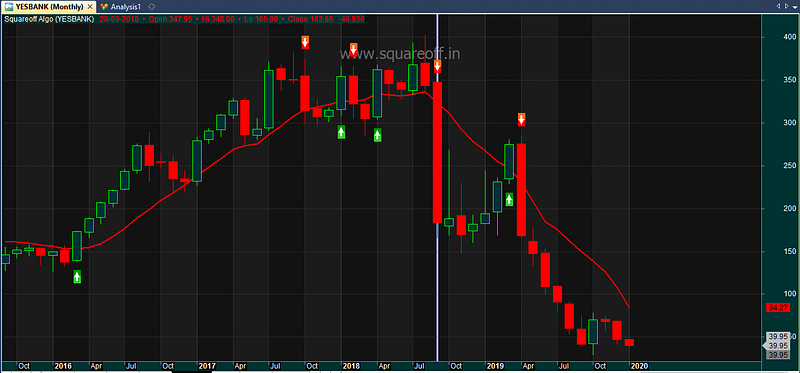
As you can see in the above chart, Yes Bank gave exit signal around 320, and after huge fall, stock moved up to 280 and closed above 200 day moving average, however in next couple of days, again it closed below 200 DMA at 260. Since then the stock has never moved up, it kept going down steadily.
If you were holding Yes Bank and if you had exited when it closed below 200 DMA, you could have limited your loss to a greater extent.
Cons:
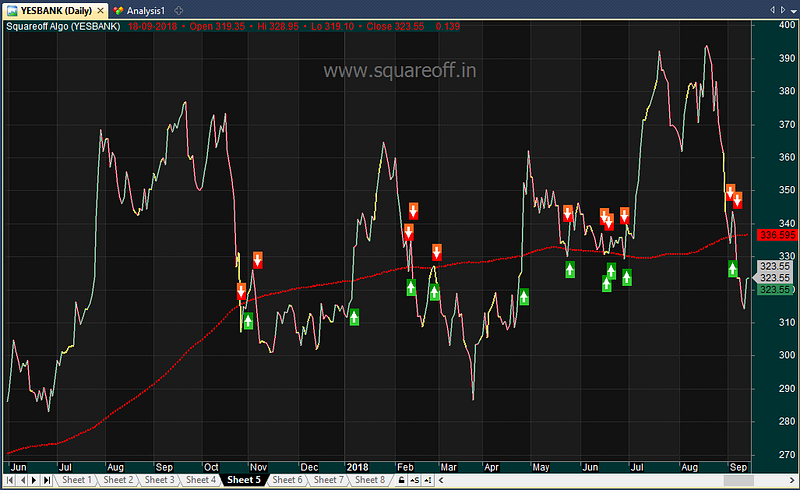
What is the draw back of using 200 DMA as exit signal? Noise . Since we apply this moving average on daily charts, at times we face frequent whipsaws, when stock trades in sideways movement, we might get multiple false breakouts/breakdowns. As you can see in the below chart, when Yes Bank was stuck in range bound period, the stock often closed above 200 DMA and within next few days, it closed below 200 DMA. It would be really difficult for an investor to take such entry/exits often.
Monthly:
If we apply the same rules on monthly time frame, 200 days is approximately equal to 10 months, so we apply 10 month moving average on monthly chart. What’s the difference between using a 200 Day moving average on daily chart and 10 MA on monthly chart? Moving to monthly chart reduces the noise greatly.
Pros :
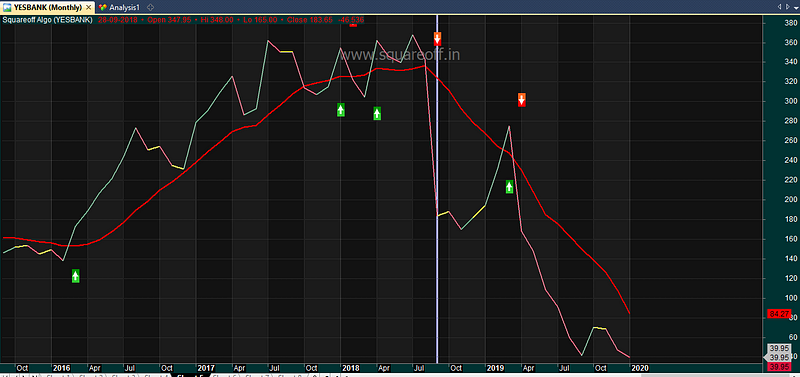
Higher the time frame, lower the false breakouts. As you can see in the below chart, even when a stock is in range bound, it doesn’t keep changing from buy to sell often.
Cons :
The only draw back is when we trade with monthly time frame, we need to wait for one whole month to complete to take buy/sell decision, so at times if stock tanks, we do not have any other than wait for the month to complete. In the month like sep 2018, Yes Bank closed down -40%, so we would have exited Rs.200 levels. Still better, as we know where the stock is currently now.
But with this rule, we will have many stocks trading above 10 month moving average and tons of stocks trading below 10 month moving average. How can one pick which stocks to trade from this list? So we further redefined the rules.
- Lets find out which stock is in extremely bearish zone and extremely bullish zone.
- Mean reversion traders can focus on extremely bearish stocks and buy it and exit after a month to make quick profits.
- Trend followers can by extremely bullish stocks that comes in top rank
To do this ranking we need to check where the current price is with respect to 10 month moving average . In the below example, we took ITC.
Upper chart represents ITC monthly share price along with 10 Month moving average. Lower chart represents the Bearish-Bullish indicator, if it goes below zero represents bearish phase and line chart goes in red color, if it goes above zero represents bullish phase and line chart goes in green color
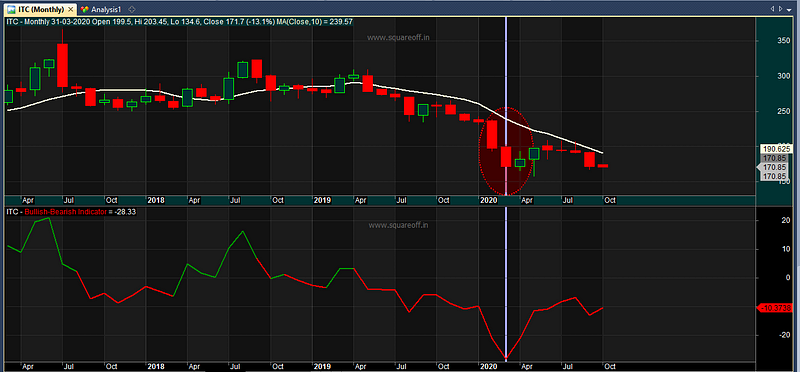
Close price as on March 2020 is 171 , 10 month moving average price is 239.
Lets do the math, (Close price minus 10 month moving avg price ) divided by 10 month MA price , ((171–239)/239)= -28% this shows that the current price 28% away from 10 MA price . Like wise, we do this calculation of all stocks and run the scanner, it gives results in seconds.
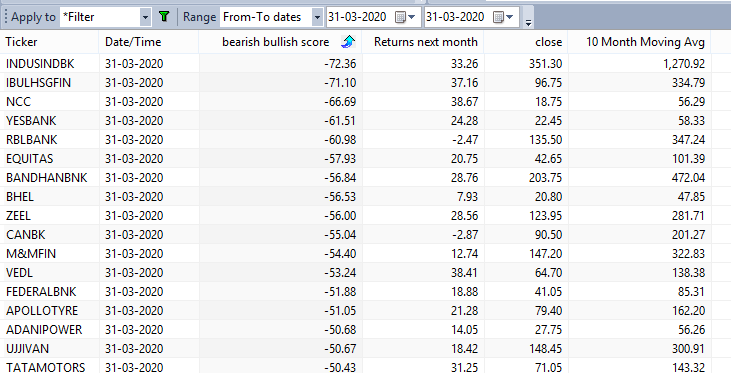
Consider below example. These are the stocks that are in extreme bearish zone sorted in order as on March 2020, with Indus Ind bank having score of -72%, which means this stock is 72% down from its 10 month moving average price, which indicates its in extremely over sold zone. Check what happened next month, it generated 33% returns.
Listed below are stocks in bullish zone sorted based on score, for example Nestle India score was 14.8, which means its trading 14.8% above its 10 month moving average.
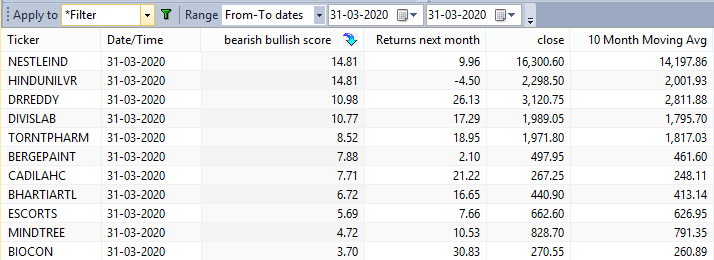
Users can pick top 1 stock, or top 5 stocks after ranking it and use those stocks for short term trading.
We even tried back testing the following rule to check the returns from 2007 to 2020 with respect to stocks that are part of FNO during those periods to avoid hindsight bias
- Check the score month end, Buy the stock that has least score and sell it next month end. (MEAN REVERSION)
- Check the score month end, Buy the stock that has highest score and exit it next month end. (TREND FOLLOWING)
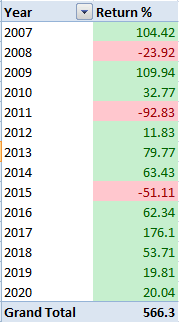
This is the over all returns for last 12 years looks like, when we Buy the stock that has least score and sell it next month end. This is plain vanilla logic, without any stop loss, traders can add in their own stop loss rules, risk management rules to refine the results further.
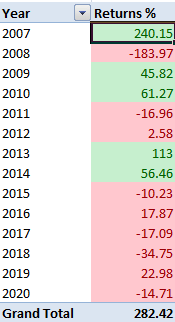
Listed below is the over all returns for last 12 years looks like, when we Buy the stock that has highest score and exit it next month end.
Conclusion :
The above result confirms that buying stocks that are in bullish zone didn’t really help on short term returns, as most of the time it ended up in loss, because stocks tend to retract or goes in pull back mode, so buying them for 1 month holding period didn’t help really.
But on the other end, our mean reversion technique helped, as these bearish stocks tend to jump in next one month. This is purely driven by investor psychology, because investors usually flock on the stock that has gone down the most, as they believe its available at attractive price now, so most investors buy these beaten down stocks, which results in short term up move. And that’s what we capitalize by buying stocks that are far away from its 10 month moving average price, which denotes bearish zone.
In our old article we even did two research on;
- How applying similar rules on your Mutual funds NAV can avoid getting trapped during crash times. This article explains , how a simple rule can reduce your mutual fund risk to greater extent.
- How applying 10 month moving average as rule based mechanism and create a long term investing strategy. This article explains the details.
Traders who wanted to make use of our bearish bullish indicator/scanner, can try this free AFL we created. Download from this link
source: https://bit.ly/3jARx40