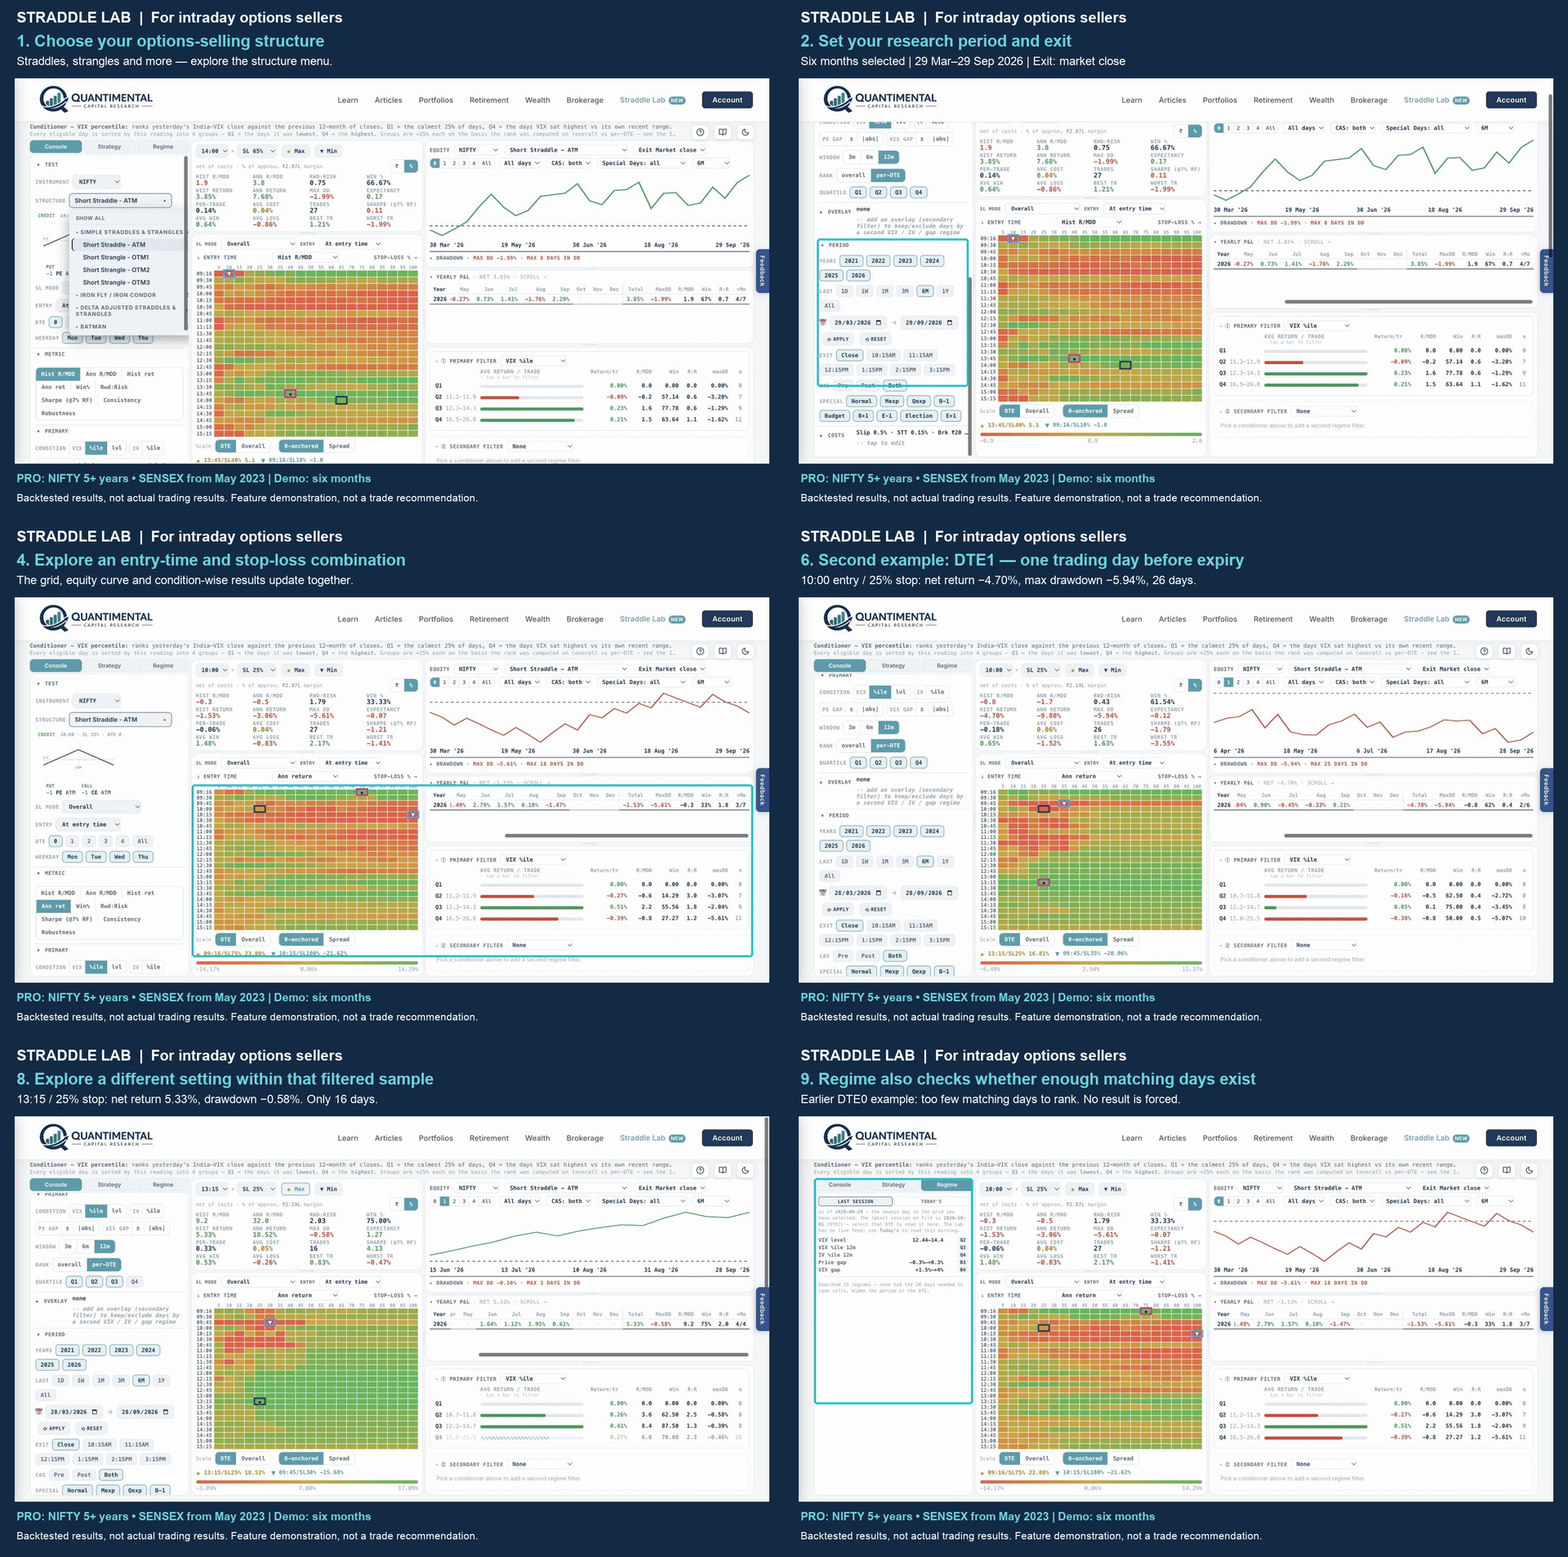
A strategy looks great at 9:30 with a 25% stop-loss. But what happens at 9:45—or with a slightly different stop? Is the result part of a wider pattern, or one isolated sweet spot?
I’m Rohan, founder of Quantimental Capital Research. We built Straddle Lab to make these comparisons visual, without running each backtest separately. Straddle Lab is currently designed for intraday options sellers.
Think of it as sonar for your backtests. Instead of inspecting one setup at a time, scan hundreds of entry-time and stop-loss combinations in one view. Change the conditions and explore the historical results in seconds—spotting promising clusters and weak patches together. It complements a traditional one-setup-at-a-time backtest workflow: a faster way to decide what deserves a closer look.
Three steps to explore a setup:
Choose the structure and exit time. Start with a straddle, strangle, Batman or an available delta-adjusted variant. Set your exit time; the default is market close.
Choose the metric you want to optimise. Compare return relative to drawdown, annualised return, Sharpe ratio, or our Consistency and Robustness metrics. The grid highlights the best historical entry-time and stop-loss combinations for your chosen metric—so you can also check whether neighbouring settings hold up.
Get the exact rules. Open the Strategy tab to review the selected setup and copy its Markdown specification for your research notes.
What about today’s market conditions? The Pro Regime tab lets you enter the opening index level and VIX, or use the available previous-day VIX reading. Select the matching structure and days to expiry (DTE), then explore how different entry-time and stop-loss combinations performed historically under comparable conditions. It’s a way to narrow your research.
Try your first month free, with access to the last three months of data.
Pro unlocks over five years of NIFTY history and SENSEX options data from May 2023.
A cluster, definitely. But my concern comes a step before that.
On the free 3-month data, the best entry time and stop-loss change depending on the window I look at. One week points to one setup, one month to another, and three months to a third. That tells me the result depends heavily on the regime, and the next three months could look completely different.
So the question I can’t answer from the heatmap is: how do I know when the regime has shifted and the old cluster no longer applies? A walk-forward view would help a lot here, i.e. take the best cluster from one period and show how it performed in the following period. Is something like that available or planned?
Thanks for your feedback and you are spot on. Ideally with a pro subscription you can get longer duration data ( upto 5 years for NIFTY and BankNIFTY and 3 years for Sensex) and with that you can set specific windows and manually do walk forward analysis. Having said that what we have noticed is that if you use robustness and consistency metrics to optimize then you get a more stable zone which holds up in walk forward analysis. I would love to get more feedback from you and if you want full data access, please email me at [email protected] and I will share a code with you.
I am looking for power users to use the product and share feedback. If anyone is interested in getting 1 month pro access for free, please drop an email at [email protected] and I will share a pro-code. Thank you.