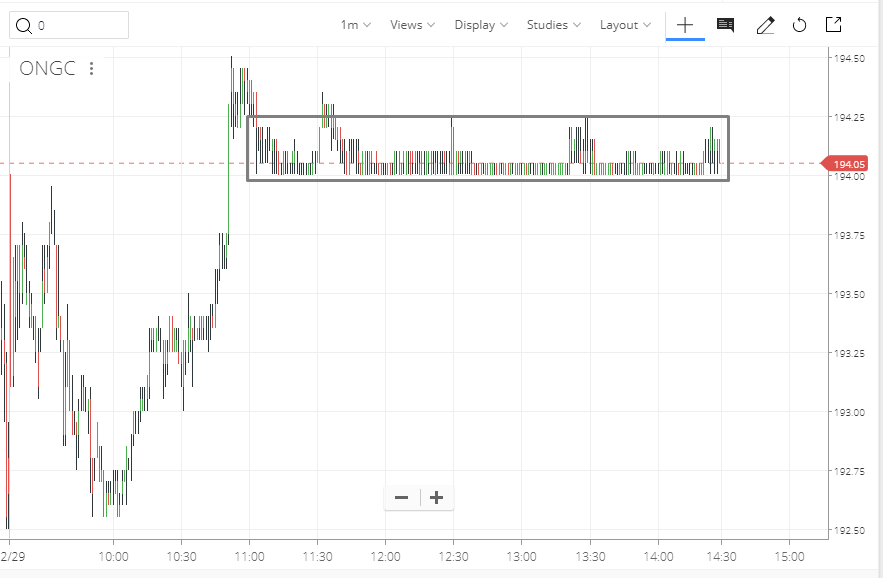
In 15 min charts why ONGC is not able to move below 194. Although it ispossible but looks strnage as none of the tick crossed it singel time. Is there reason here?

Even if you see the minute charts, it’s the same. Been oscillating between 194 and 194.25 for over 3 hours. Possible.
Just Random Thing.
Or
Maybe Someone don’t want it to fall below these levels.
Or
The moment I’ll enter I am sure it will fall in Just few seconds.
3 Likes
![]()
![]()
![]()
![]()
![]()
When you see such patterns, also pay attention to market depth. It may be possible there is HUGE buy order at that price.
1 Like

Let’s_Invest- I know the feeling ![]()
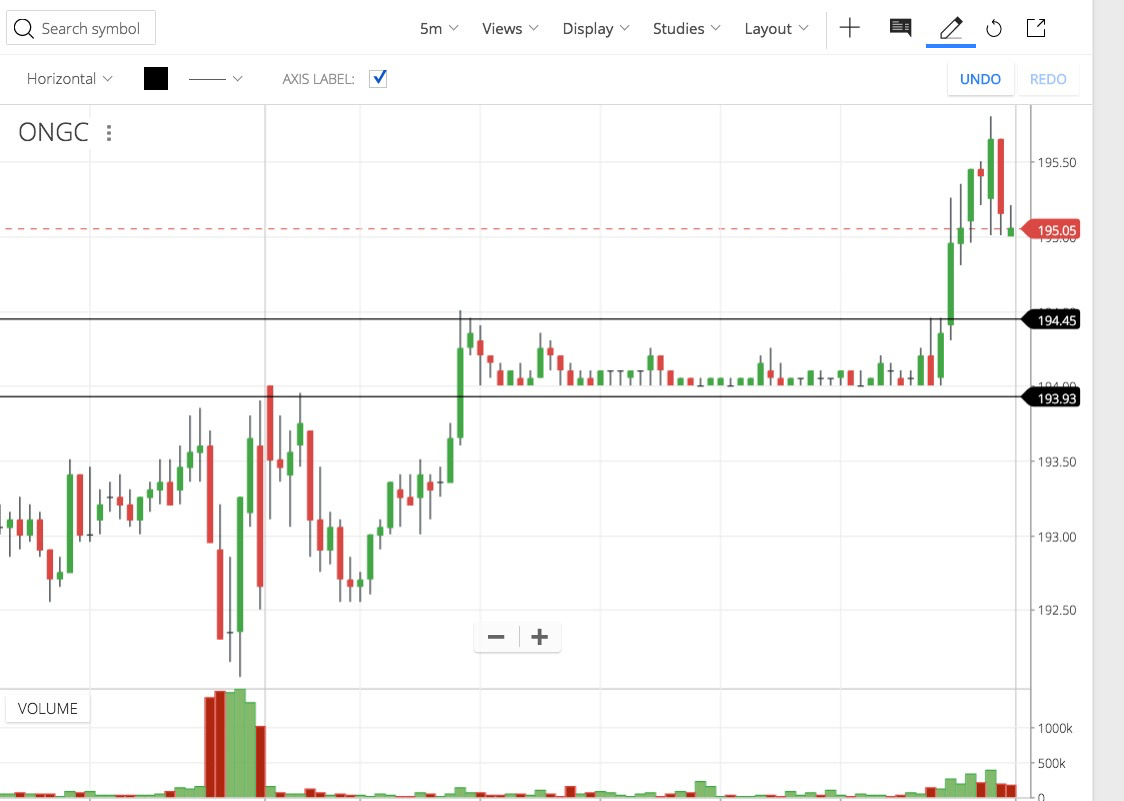
in my experience, such tight ranges often break out in one of the two directions and give good trading opportunity. One way I trade these setups is to put both a Stop Loss buy order above the range and Stop Loss sell order (for shorting) below the range. That way, whenever the range is broken, I get to ride the move. Probably would have worked out on ONGC today.
Cheers!
Neha (VRDNation.com)
5 Likes

Madam neha, nicely explained by u. But there’s a shortcoming of this method too.
At times, the stocks may give false breakouts in either direction. I mean the price reverses immediately after giving breakouts!!
Secondly, the SL buy/sell order would usually get executed at the market price only.
If there’s a large volume buy/sell order, it may result in giving a breakout but your order will only be executed at market price which maybe on the extreme sides.
1 Like
True …That strategy (or any strategy) should be deployed only in certain specific circumstance and stocks. That’s why traders personal experience with the stock (& sector) and understanding of its nature can be a great asset. For example, I would never trade a stock like Infibeam with this strategy because of its high volatility; but going long on perennial bulls like Tata Global or Tata Steel or Bajaj Finance wouldn’t be such a bad idea.
At the end of the day, it’s the trader who makes the money, not the strategy.
3 Likes