I am new to trading and just completed Zerodha Varsity Module of Technical Analysis. I have tried to do some sort of technical analysis on those…Kindly suggest me regarding it
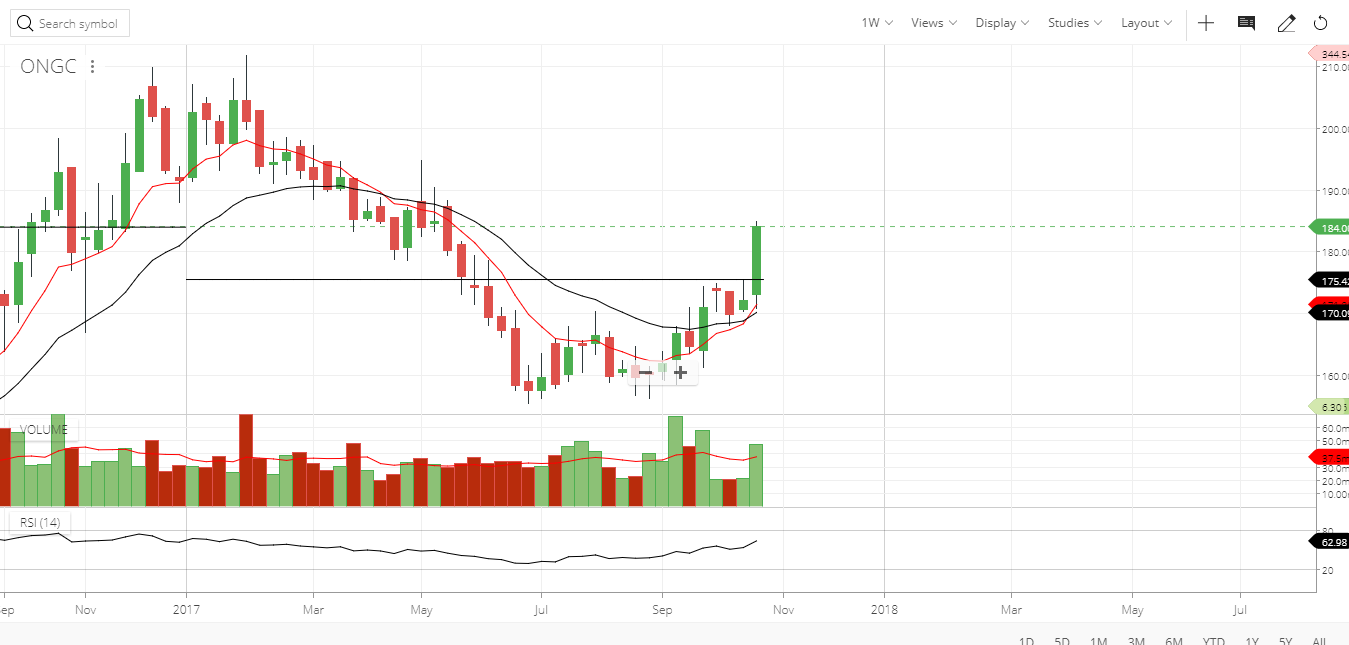
Its weekly chart of ONGC. I think Bullish Marubozu is formed(slight variation is there). Crossover of 9X21…(9 is RED).
Volume is Ok. Where should i place my Stoploss in it… Resistance is at 225… Its level is more than 20% from CMP of 184.
Should I Go long? All Suggestions are welcome
ONGC is now exactly at its resistance of 184, supports are 177 & 175
But "keep in mind " the ONGC is highly overbought on daily chart , this is not a recommendation but a chart study
Thank you very much… When i do chart study and find some recognizable candlestick pattern and other things in my favor I found resistance level around the CMP. It frustrates me…What should i Do?
Rule of TA is , not to get frustrated, If momentum indicators & price action are favorable, you need to take a risk , no trade without a risk, in ONGC SL: is not too below from its present level & also resistance level becomes support level & vice versa, , and look at the different time frames also .if you are skeptical about resistance level , you exit that stock on next trading day. I would like to suggest not to give too much importance to the candlestick pattern, along with it you need to give equal consideration , what other technical indicators are indicating about the price pattern , there is a " double bottom" formation on monthly chart of ONGC, weekly chart also good , In a trending stock , normally some indicators like RSI gives highly overbought condition
some times before certain events, stock prices reaches or nears its resistance level, & its not a good idea to take a trade just a day prior to the event ,and its really depends on your money management,in case of ONGC today was the result day