Spacebar shortcut to open the next instrument’s chart – This would make navigation smoother, as the up/down arrow keys are used for scrolling through the watchlist.
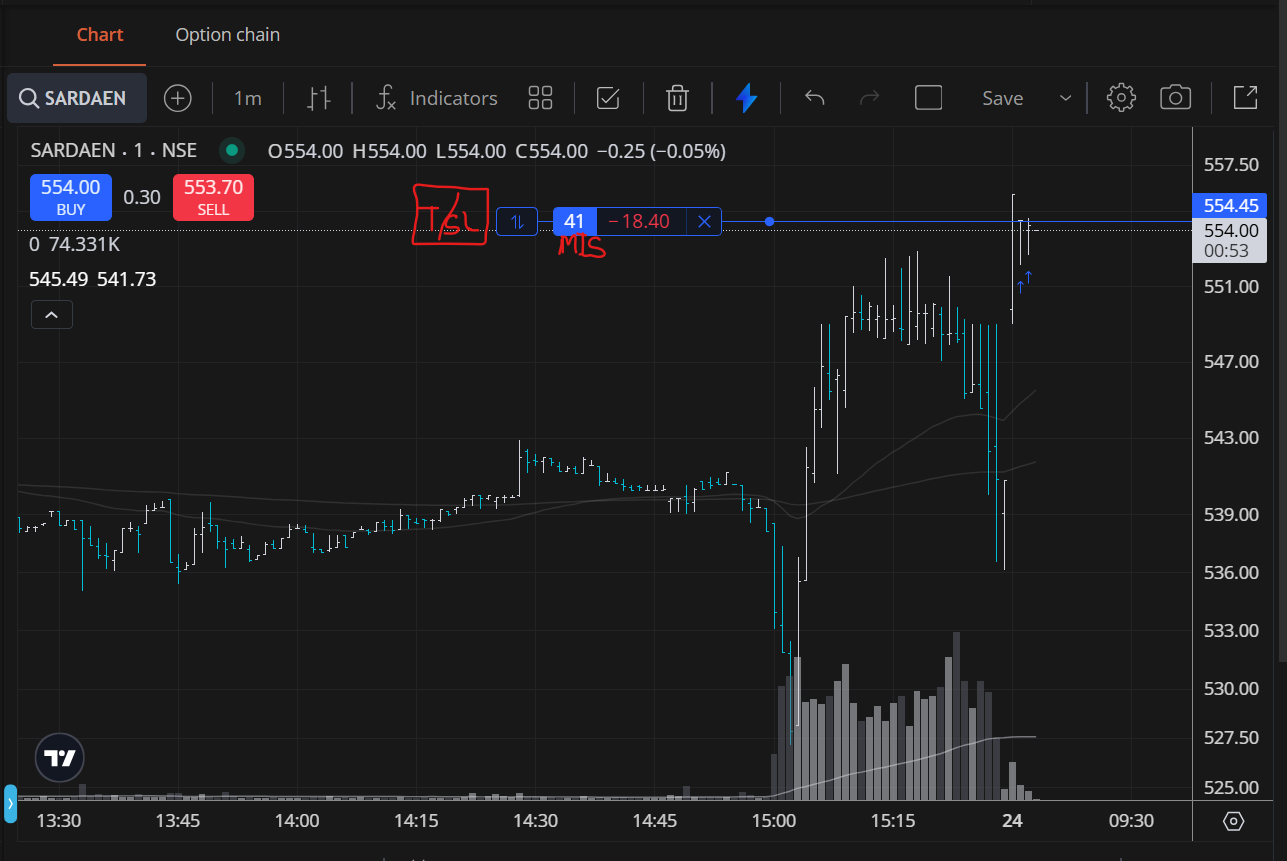
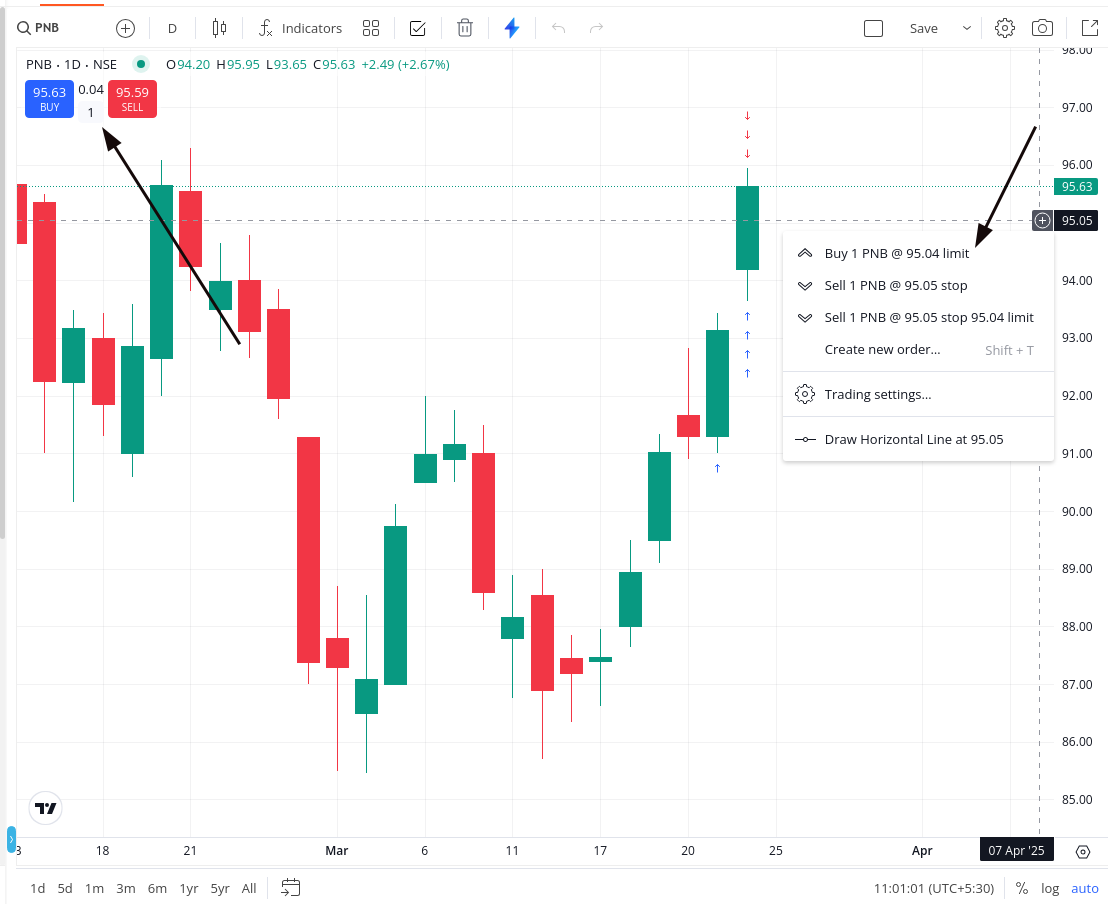
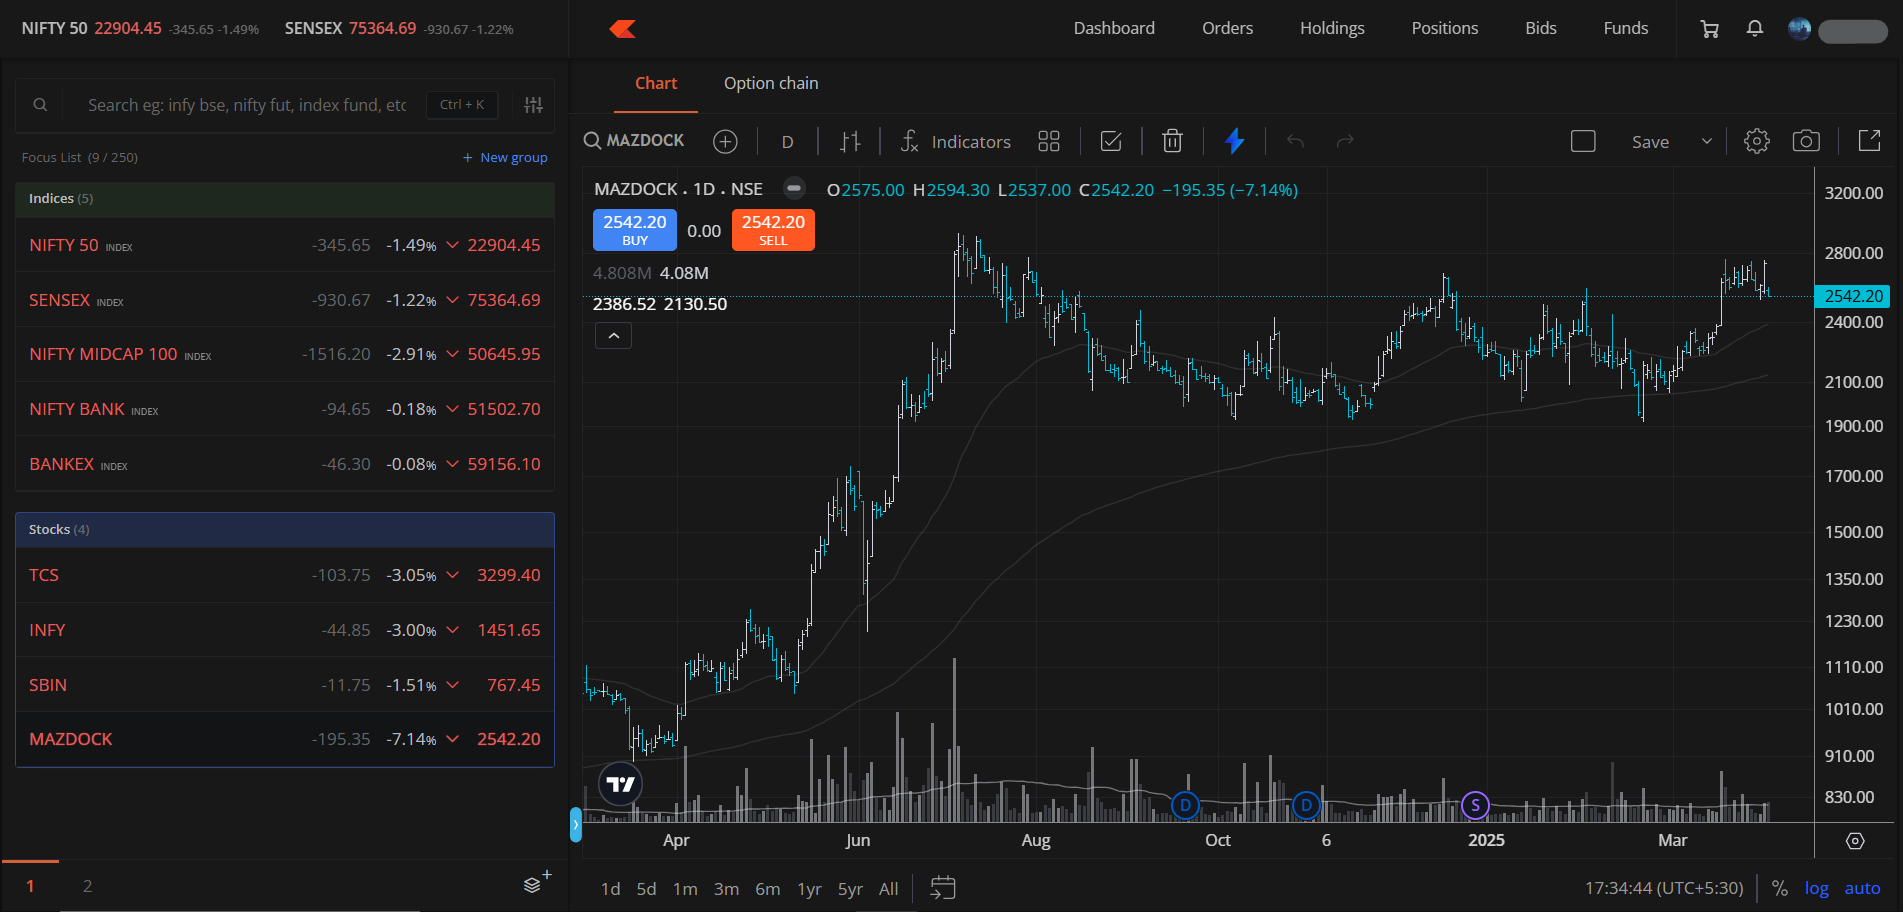
Modify order placement behavior – After enabling instant order placement, limit orders placed using the “+” button near the price scale execute directly, preventing quantity or price adjustments. It would be more useful if the “+” button prompted for confirmation, while the Buy/Sell box near the scrip name placed orders instantly.
Include GTTs on the chart in the future, which would be a great addition for long-term traders.
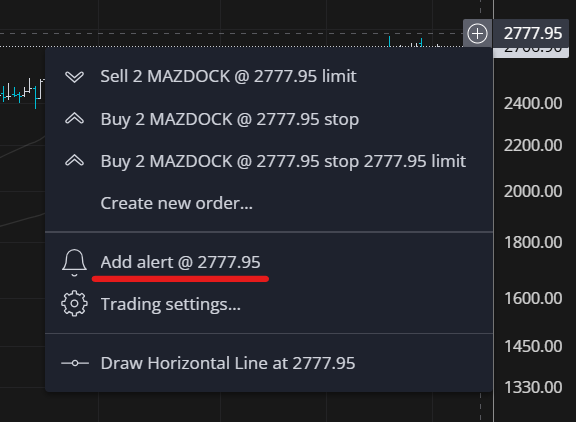
Alerts on the chart – Having the ability to set and view price alerts directly on the chart would be incredibly helpful for tracking key levels.
Loving the new TFC feature! Looking forward to seeing these refinements in the upcoming updates
Would love to hear from other traders as well, Feel free to share your feedback and suggestions.
5- Clicking the + symbol would not place an order; when the user selects limit or SL, the order is placed. Qty can be filled at the left side section I pointed out in the screenshot. where you keep the + button to invoke the order window, and the price is picked accordingly. Product type MIS/NRML was picked based on the recent order.
As of now, I don’t need past P&L values. I only need past executions to analyze my trades in post-trade analysis—whether I bought at the right place, sold correctly, etc.
@Arockiya_Raja Voting for execution arrows for the past trade. It will be great for the trader to analyse the past trades and improve on themselves with their buying and selling and eventully do better with their money. Kindly consider it.
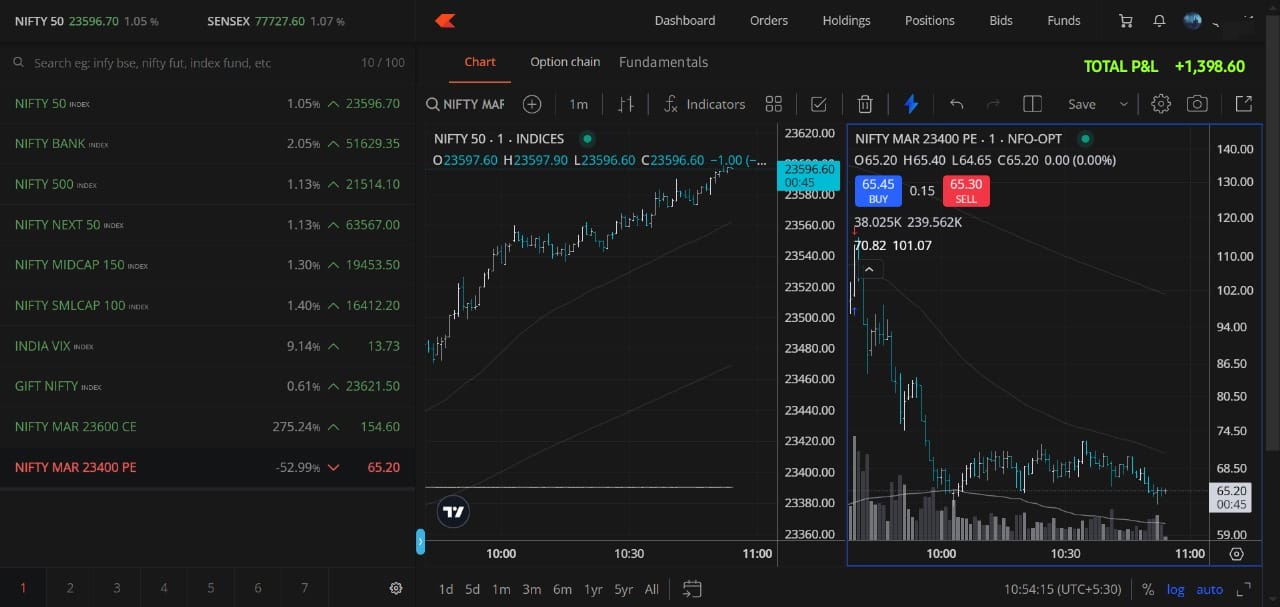
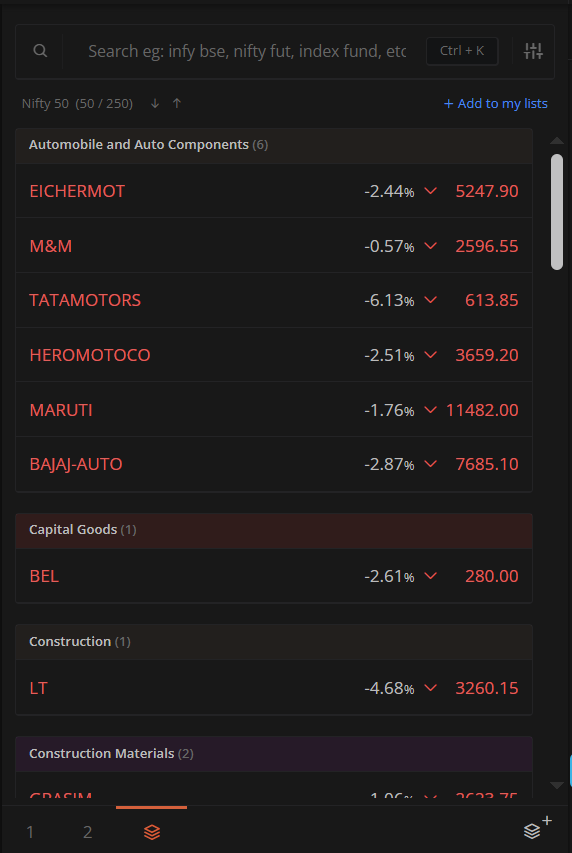
The new Marketwatch update is amazing
Unlimited watchlists with group features, sorting within groups, color tagging, and preset watchlists categorized by sectors & other improvements.
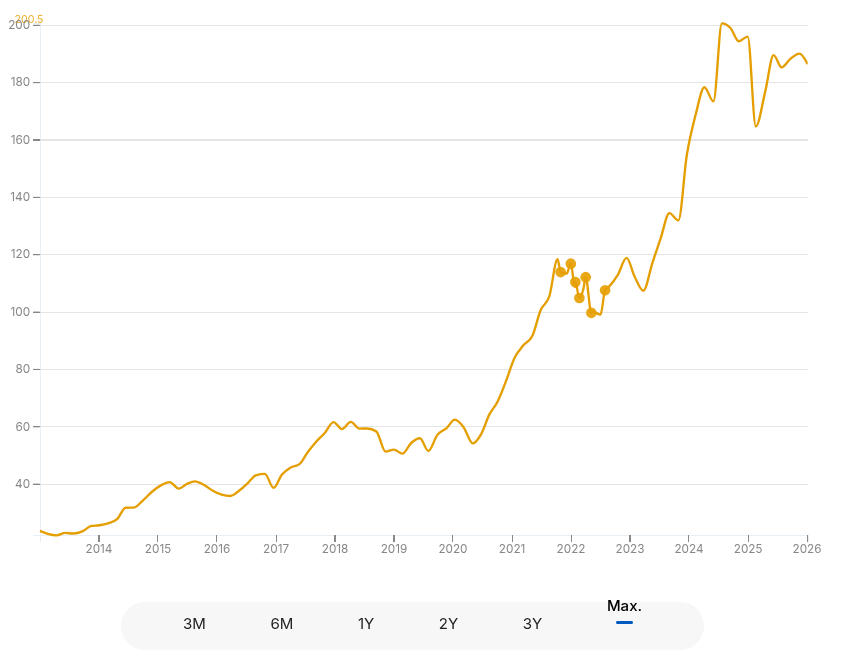
Displaying this on the main chart is not feasible. You can already view MF purchases on the NAV chart — we’re exploring a similar approach for stock holding too, and it’s on our wishlist.
If we are not analyzing it for holding stocks or mutual funds, then it involves mapping the trades on the price chart. However, understanding which buy corresponds to which sell on the chart presents a different challenge entirely. It’s not as straightforward as merely plotting markers. We have taken note of your feedback and will explore a clearer approach in the future.