Welcome to The Long and the Short — a show where you can expect an honest take on trading, something you won’t hear elsewhere.
Have you ever wondered what happens to a stock’s price after it’s included in the Nifty 50?

Researchers have been studying this question on the S&P 500 for 40 years — and what they found for US markets should make us think before we assume the same for the Nifty 50.
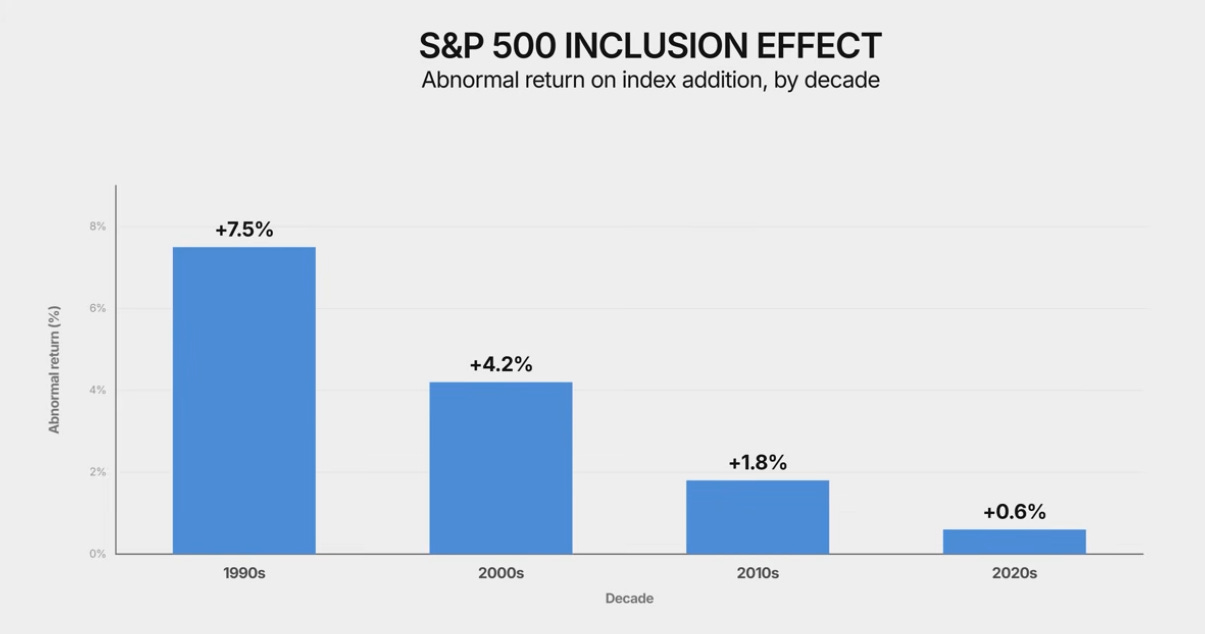
The abnormal return from an S&P 500 addition went from over 7% in the 1990s to under 1% in the last decade. The edge got discovered, it got traded, and eventually it got arbed away. Quite expected for a market like the S&P 500.
So where does that leave Nifty 50?
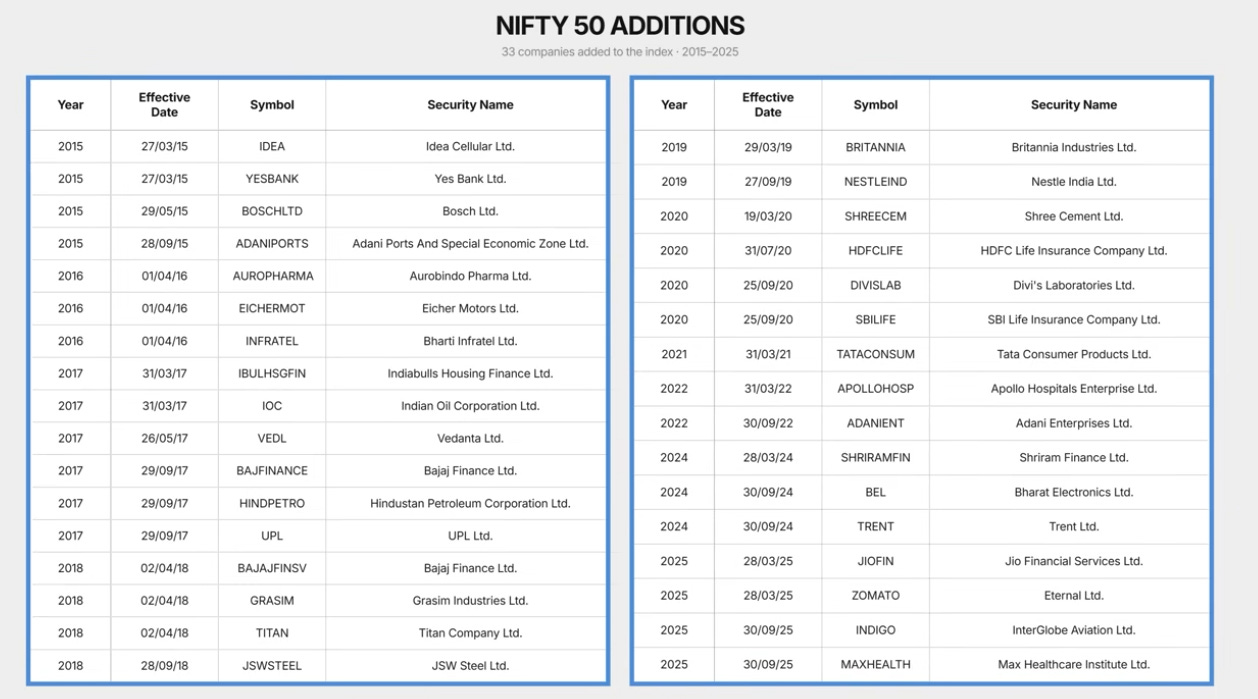
To find out, every Nifty 50 inclusion from 2015 to 2025 — 33 events — was tracked, measuring what happened to those stocks before and after they were added. What emerged is a mixed bag of results, and the more interesting story might actually be what happens before the announcement.
This is Edition 1 — inclusions. Exclusions will be covered separately.
Disclaimer: The examples and ideas shared here are strictly for educational and illustrative purposes only. Nothing discussed should be construed as a recommendation, investment advice, or a solicitation to trade. Trading in stocks or derivatives involves significant risk and can result in the complete loss of capital. The analysis excludes all merger and de-merger stocks that got included in Nifty 50 — only companies included through the periodic index reconstitution review are covered.
How Does the Nifty 50 Decide Who Gets In?
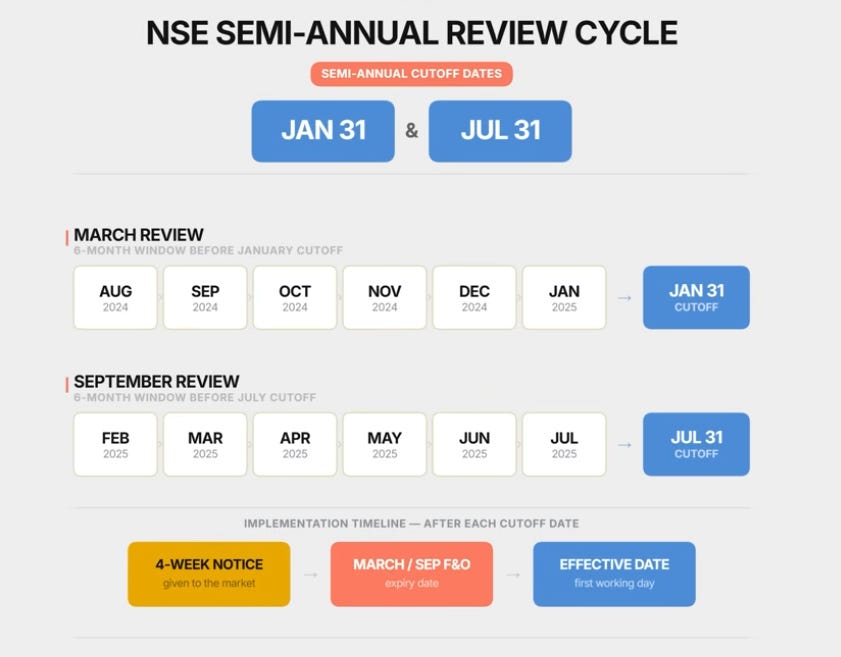
NSE reviews its constituents twice a year, in March and September. Data is assessed for the six months ending January 31 and July 31, and any changes are implemented from the first working day after the March and September F&O expiry, with four weeks’ notice given to the market.
To be eligible for inclusion, a stock needs to clear a few filters. It needs to have been listed for at least one month — though in practice, any stock that reaches Nifty 50 consideration would usually have years of listing history. It needs to be available in the futures and options segment.
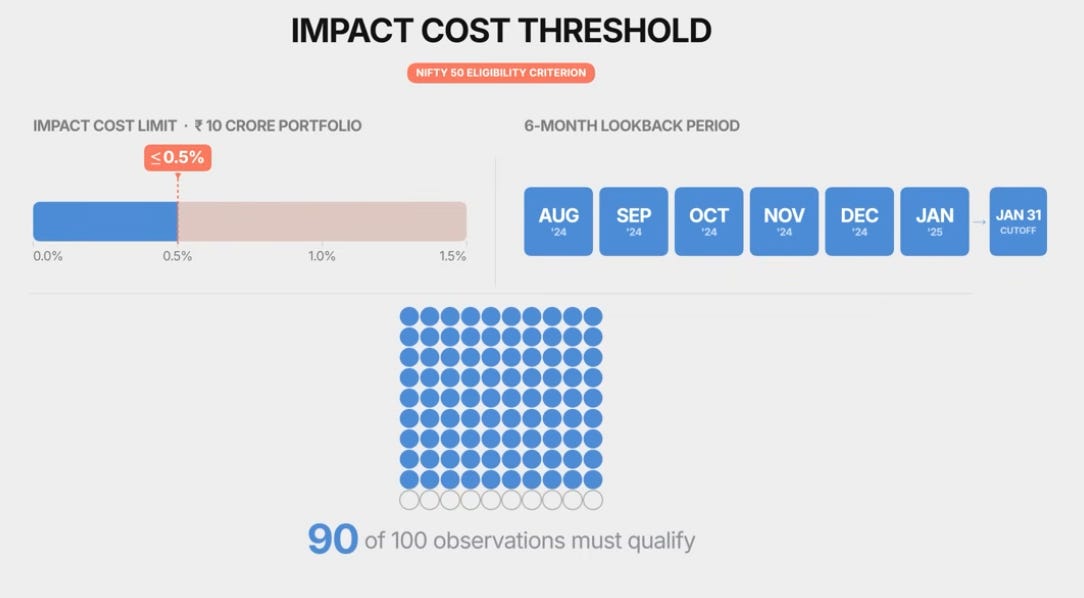
And it needs to pass a liquidity test called impact cost, a measure of how much a large trade in the stock would move its price. For Nifty 50, that threshold is 0.5% or less, measured on a portfolio of ₹10 crore, over the past 6 months for 90% of observations.
Beyond that, it’s about size. The index is weighted by free-float market capitalisation — only the shares actually available for public trading, not the ones locked up with promoters. The fifty largest eligible companies by this measure make it in.
Note also that this process is not purely algorithmic. The final call rests with a committee at NSE, which means there’s an element of human discretion involved.
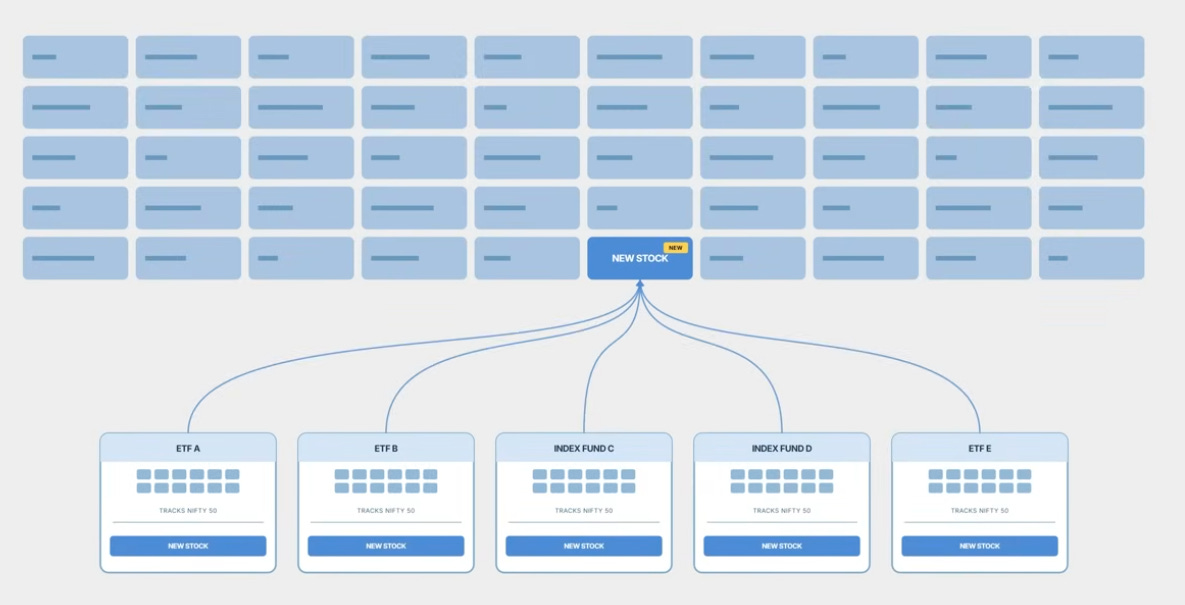
When a stock gets announced for inclusion, every passive fund or ETF tracking the Nifty 50 has to buy that stock — because they need to hold all fifty constituents in proportion to their index weights, and they have to do it by a specific date. That’s a predictable burst of buying.
Which immediately raises a question: if you know buying is coming, can you get ahead of it and profit?
That’s the hypothesis we tested.
The Setup
Two dates matter here. The announcement date — when NSE tells the market which stocks are coming in or going out, roughly four weeks before the change takes effect. And the effective date — the day the stock officially enters the index.
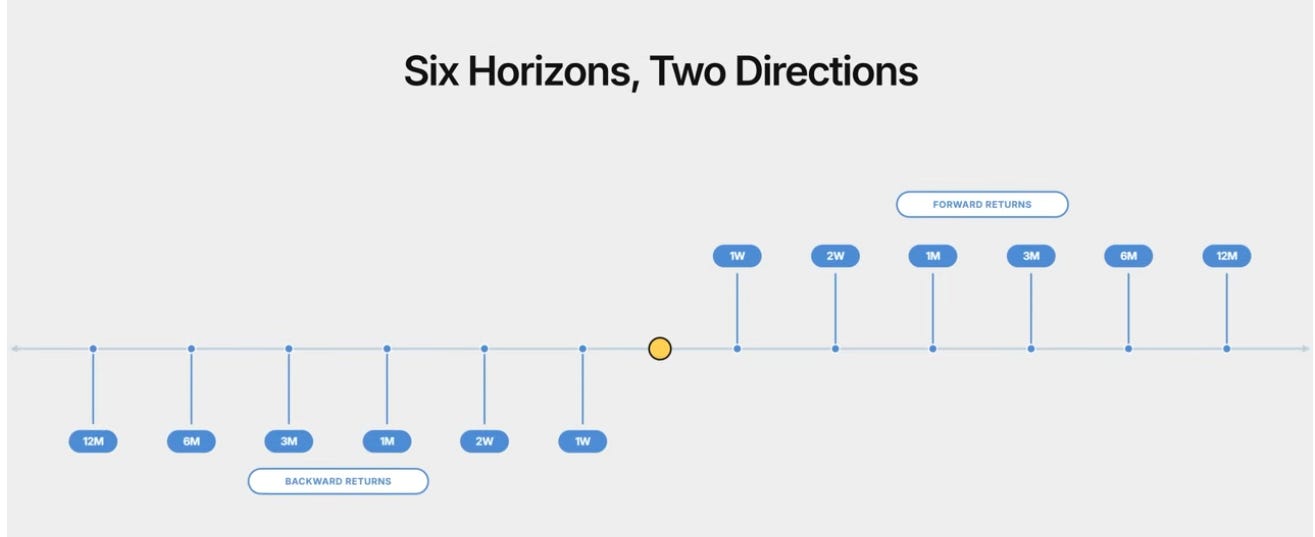
We anchored the study to the effective date, so t=0 is the day the stock enters the index. Forward returns measure what happened after that point, at six horizons: one week, two weeks, one month, three months, six months, and twelve months. Backward returns measure what the stock delivered in those same periods before the effective date.
Forward returns tell us whether there’s an edge in buying after inclusion. Backward returns tell us how the stock performed prior to its inclusion. Returns are price returns — dividends are not included. In total, 33 inclusion events between 2015 and 2025.
What Happens After Inclusion?
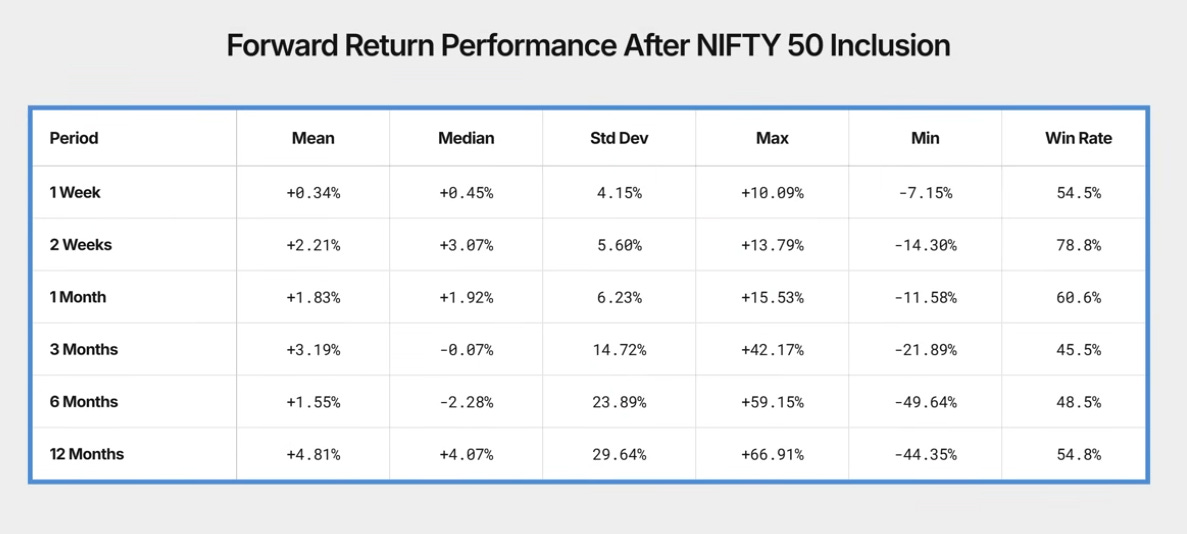
The first thing that jumps out is the two-week window . A win rate of 78.8% — nearly four out of five inclusion stocks were positive two weeks after entering the index. The mean return is +2.21%, and the median is +3.07%. When the mean and median are both positive and close to each other, the result isn’t being distorted by a few big outliers. That’s a statistically clean signal.
One week is weaker — 54.5% win rate, barely above a coin flip. Two weeks is clearly the sweet spot.
Why two weeks? When a stock enters the index, every passive fund and ETF has to buy it. That buying doesn’t happen in one day — it gets absorbed over roughly two weeks. Once that demand is fulfilled, index dynamics take over, and the stock is just another constituent held in proportion to its weight. The buying pressure is gone.
Now look at what happens after two weeks. At three months, the mean is still positive at +3.19% — but the median has flipped to -0.07% . The typical stock was flat to slightly negative. A few big winners are pulling the average up. At six months, the median is -2.28%. The average included stock was actually losing money at that point.
The standard deviation tells the rest of the story. At two weeks, it’s 5.6%. By three months, it’s nearly 15%. By twelve months, it’s almost 30%. Outcomes become increasingly dispersed — some stocks do very well, many don’t.
The inclusion effect is real — but it’s short-lived. The two-week window is where it shows up most cleanly. Beyond that, you’re just holding an index constituent.
The Equity Curve — Two-Week Strategy
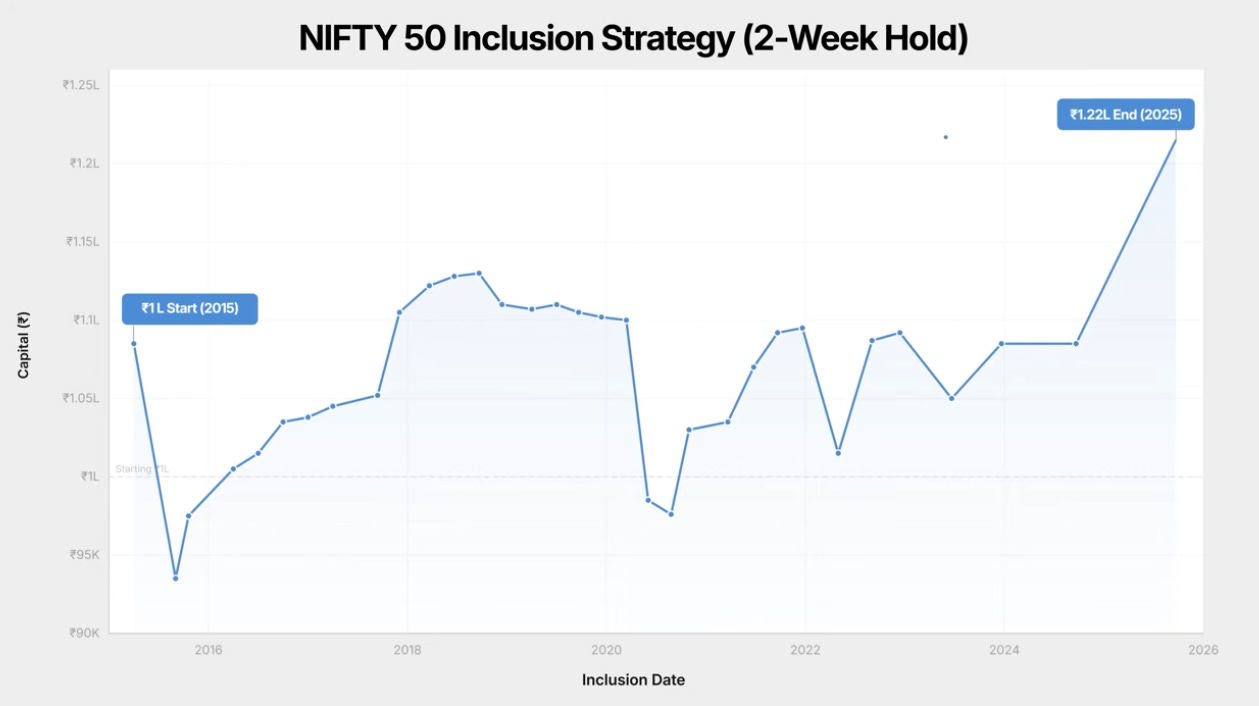
What does this look like if you traded every inclusion event over ten years? Starting with ₹1 lakh in 2015, the strategy ends at ₹1.22 lakh by 2025. A total return of 22.25% with a maximum drawdown of 14.30%, giving a return-to-max-drawdown of 1.56.
(Capital is compounded — if ₹1 lakh becomes ₹1.1 lakh after the first trade, and there are two inclusions in the next cycle, ₹1.1 lakh is split equally and invested in both stocks, and so on.)
Before reacting to the 22.25% number — this is not a buy-and-hold strategy. You are invested for two weeks at a time, roughly twice a year. Your capital sits idle for most of the year. Comparing this to any annual return benchmark isn’t logically appropriate.
What you’re really doing is: every time a stock enters the Nifty 50, you buy it for two weeks and ask whether the returns generated are worth the risk. On average, the answer is yes — but with caveats.
The curve is not smooth. The worst drawdown of 14.30% hit on the very second trade in May 2015. The strategy spent a long time recovering before making new highs, and gains are not evenly distributed — certain inclusion cycles contributed far more than others.
A return-to-max-drawdown of 1.56 is a reasonable number for a simple event-driven strategy. Not spectacular, but not weak either. The edge is real but quite modest.
What Happened Before Inclusion?
The numbers here are striking and tell a very different story.
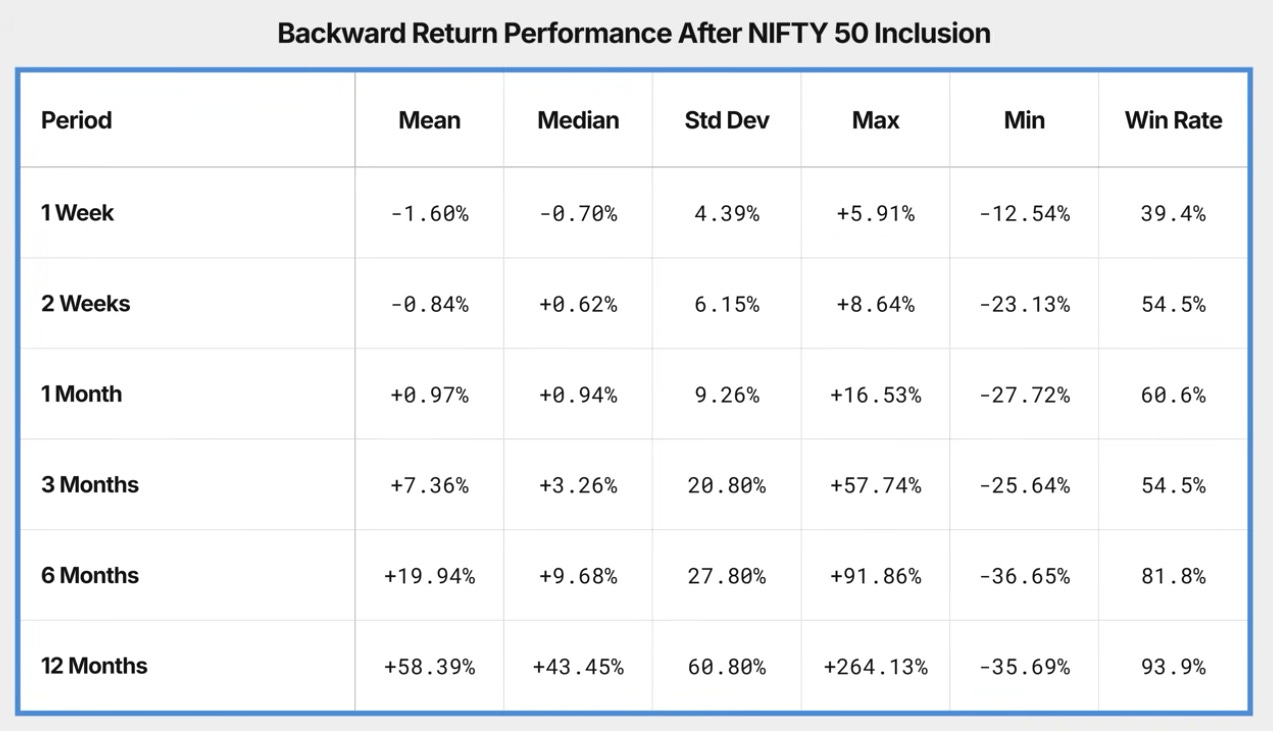
Go back twelve months before inclusion, and the mean return is +58%. The median is +43%. The win rate is 93.9% — nearly every single stock that entered the Nifty 50 had already been positive in the year before it was added.
Six months back — mean of +19.94%, median of +9.68%, win rate of 81.8%. Three months — mean of +7.36%, median of +3.26%. The pattern is clear: the further back you go, the stronger the performance. By the time the committee announced inclusion, the heavy lifting was already done.
One detail worth noting: in the very short term — one week before inclusion — the mean return is slightly negative at -1.60%. The stock dips a little right before it officially enters. Possibly some profit-taking, or just noise in a small sample.
The Problem With Predicting Inclusion
Before getting too excited about those pre-inclusion numbers, something important needs to be acknowledged. Those backward returns aren’t surprising. They’re almost guaranteed by the construction of the test.
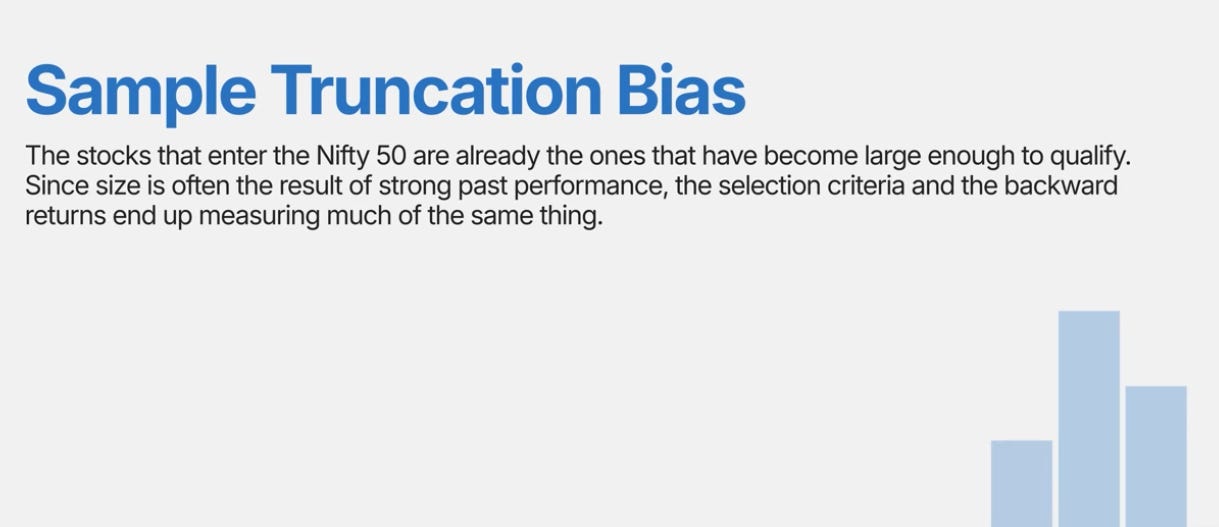
The eligibility criterion for Nifty 50 is free-float market capitalisation. A stock gets added because it has grown large enough, which means it has already been going up. The backward return and the selection criterion are essentially measuring the same thing. This is called sample truncation bias — we only observe stocks that cleared the inclusion threshold, so we can’t see the counterfactual of what didn’t get in.
So the strong backward returns aren’t a discovery about what happens before inclusion. They’re a feature of the stocks that end up in the dataset to begin with.
The real question is: can you identify which stocks are going to be included before the announcement, and is there still an edge left after accounting for that?
That’s a harder problem — but not an impossible one.
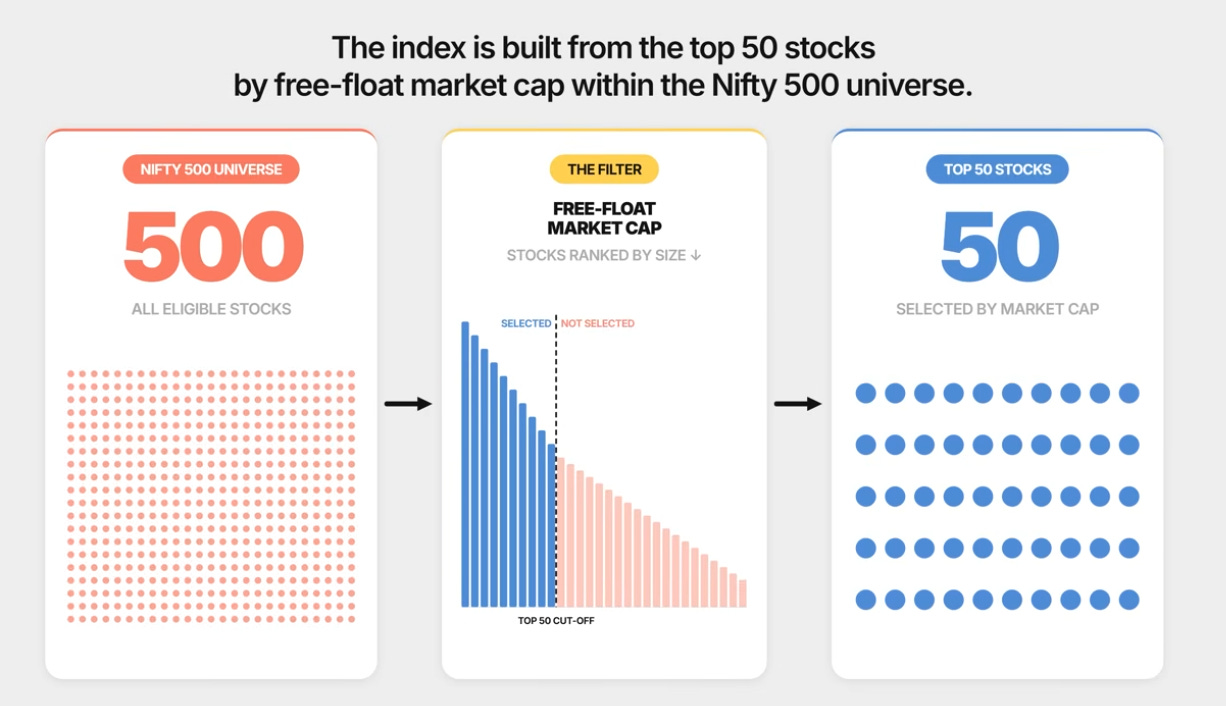
For the Nifty 50, the methodology is public and rule-based. The index is built from the top 50 stocks by free-float market cap within the Nifty 500 universe. Which means the Nifty Next 50 is essentially the waiting room. Stocks sitting just outside the top 50 are your natural candidates for the next inclusion cycle.
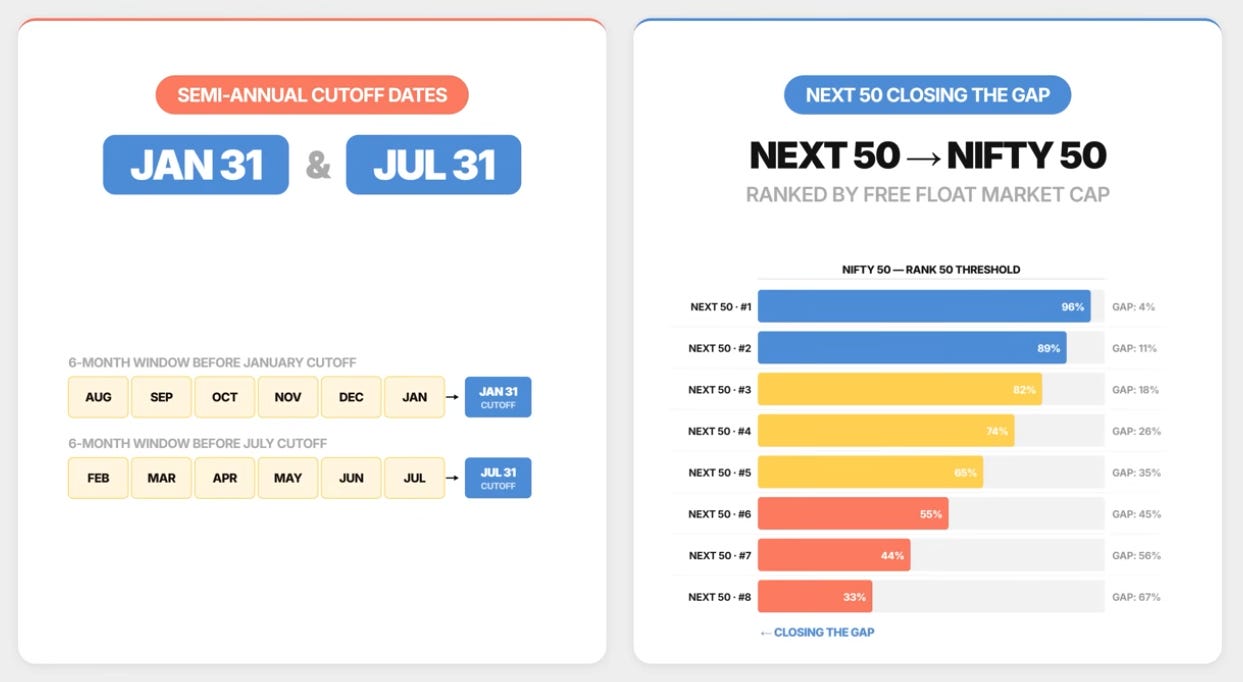
The data cutoff is January 31 and July 31 — so six months before each cutoff, you can start tracking which Next 50 stocks are closing the gap on the bottom of the Nifty 50 from a free-float market cap standpoint.
But there are real challenges. You can only identify the pool of candidates, not always the exact stock or the exact cycle — a stock can hover on the boundary for multiple review periods before finally crossing over. The committee also retains discretion; the methodology is a strong guide, but not a guarantee. And most importantly: if this is knowable from public data, other participants are also watching the same rankings. The more efficiently this information gets priced in ahead of the announcement, the smaller the edge that remains by the time you act.
These are real challenges — but for the curious and the patient, the potential edge is still large enough to justify the effort.
(One AMC has launched a large-cap fund and mentioned something similar in their factsheet to try and beat the index. Can you guess which fund house? Let me know in the comments.)
Before vs. After — The Full Picture
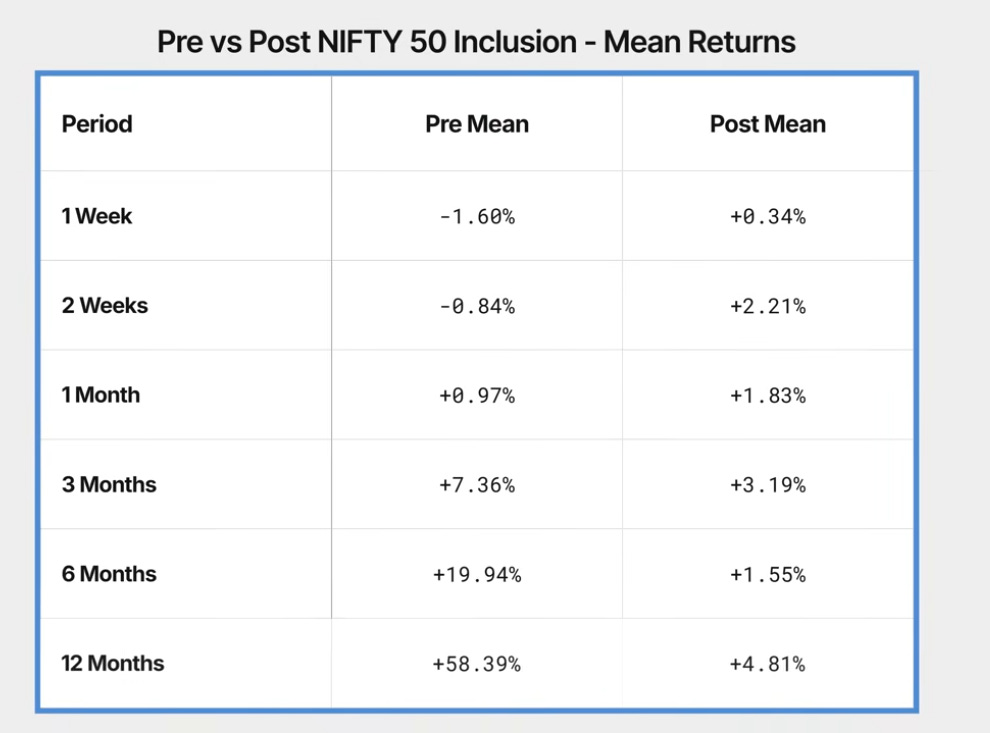
The contrast is stark. Twelve months before inclusion, the mean return is +58%. Twelve months after — +4.81%. Six months before: +19.94%. Six months after: +1.55%. At every horizon beyond two weeks, the pre-inclusion return beats the post-inclusion return.
The medians make it even clearer:
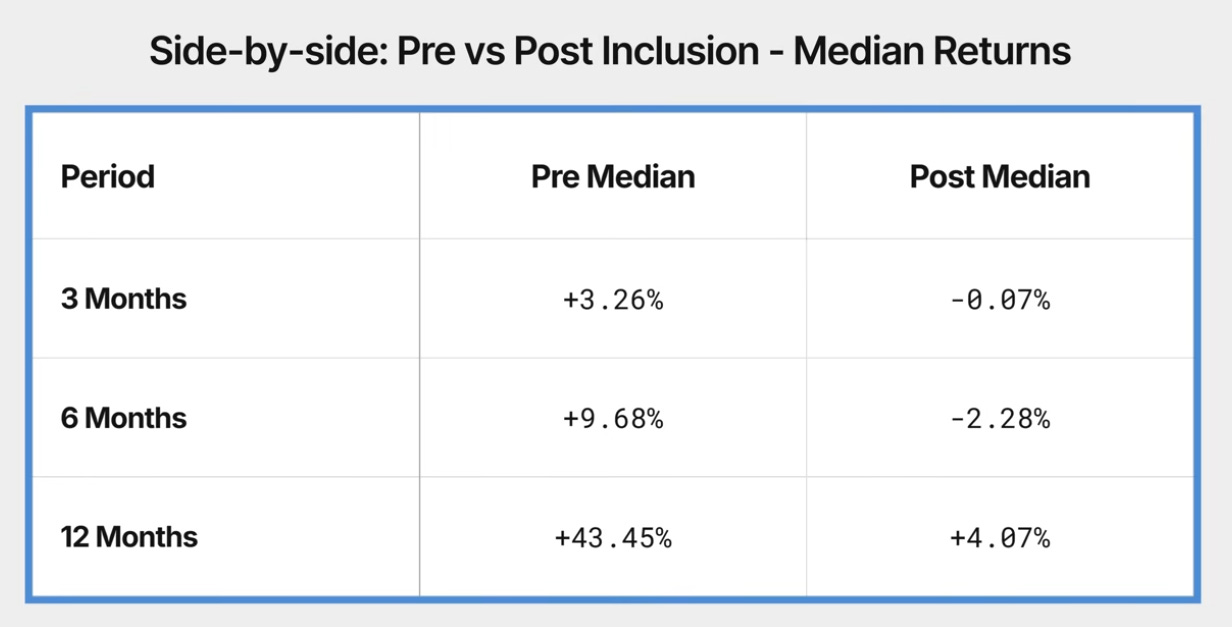
The median strips out the outliers and tells you how the typical included stock actually did. And the typical included stock, after entering the index, delivered very little over the medium to long term.
The Central Conclusions
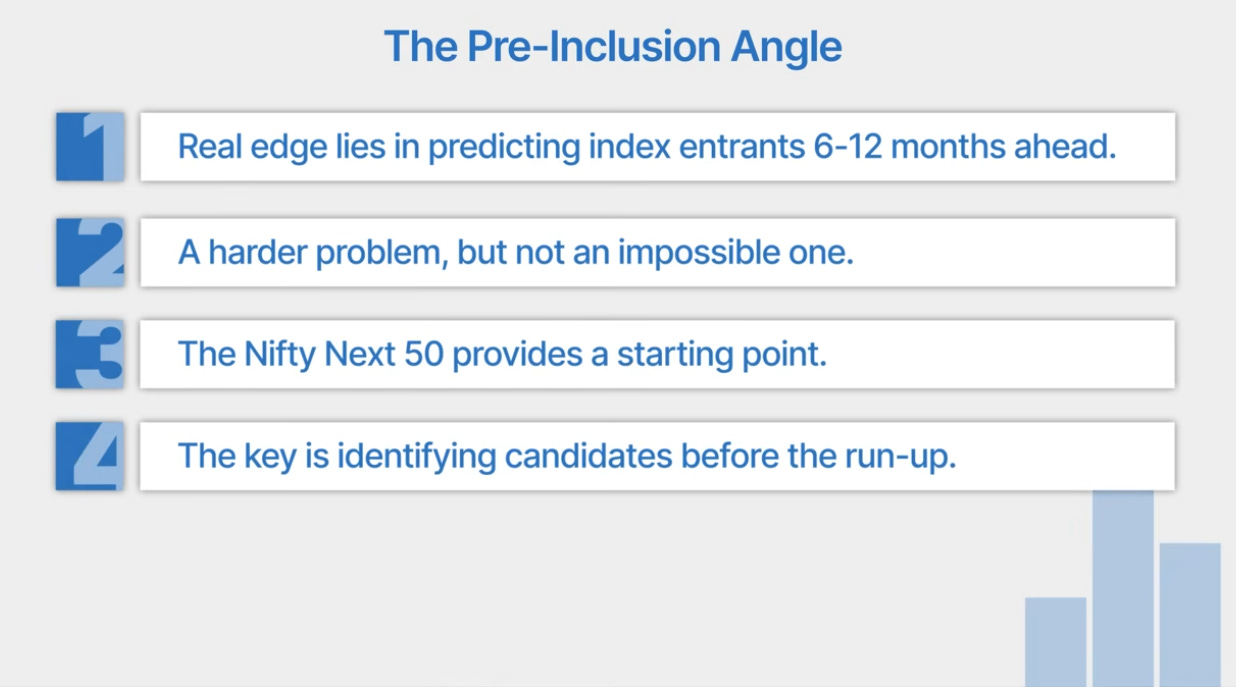
If you’re approaching this from the pre-inclusion angle: the data suggests the real edge lies in predicting which stocks are likely to enter the index six to twelve months ahead. That’s a harder problem, but not an impossible one. The Nifty Next 50 gives you a structured starting point. The work is in identifying the right candidates early enough that the run-up hasn’t already happened by the time you act.

If you’re approaching this from the post-inclusion angle: the edge exists, but it’s narrow. Two weeks from the effective date is where it shows up most consistently — a win rate of 78.8%, a positive mean and median, and relatively contained dispersion. Beyond two weeks, you’re no longer trading an index event. You’re just holding a stock.
One important limitation to note: the returns in this study are raw price returns, not benchmark-adjusted. We haven’t compared them against what the Nifty 50 itself returned over the same periods. To properly isolate the inclusion effect — to see whether these stocks actually outperformed the index, not just whether they went up — you would want to compute excess returns over the benchmark. That’s the natural next step for anyone looking to build something more rigorous around this.
Exclusions will be covered in a separate edition.
If you have any questions, feel free to drop them in the comments — we’ll be happy to respond.
Till then — take care and trade safe.