What i should know to trade based on daily charts. What are must among these
INDICATORS, CANDLES, CHART PATTERN, PRICE ACTIONS, VOLUME, etc
1 Like
you are asking for trading.
before giving any advise, i would like to know, you are interested in doing intraday or swing trading. because the trading has two types, intraday and swing, based on this i would like to answer your question, let me know.
Look for pivot points, support and resistance levels… These r most influential… In day trading set time frame to 5 mins, for swing trade use 1 hr time frame… All d best… 
Attached r d screenshots for better understanding
Nifty Jun future… 1 hr tf for swing trade
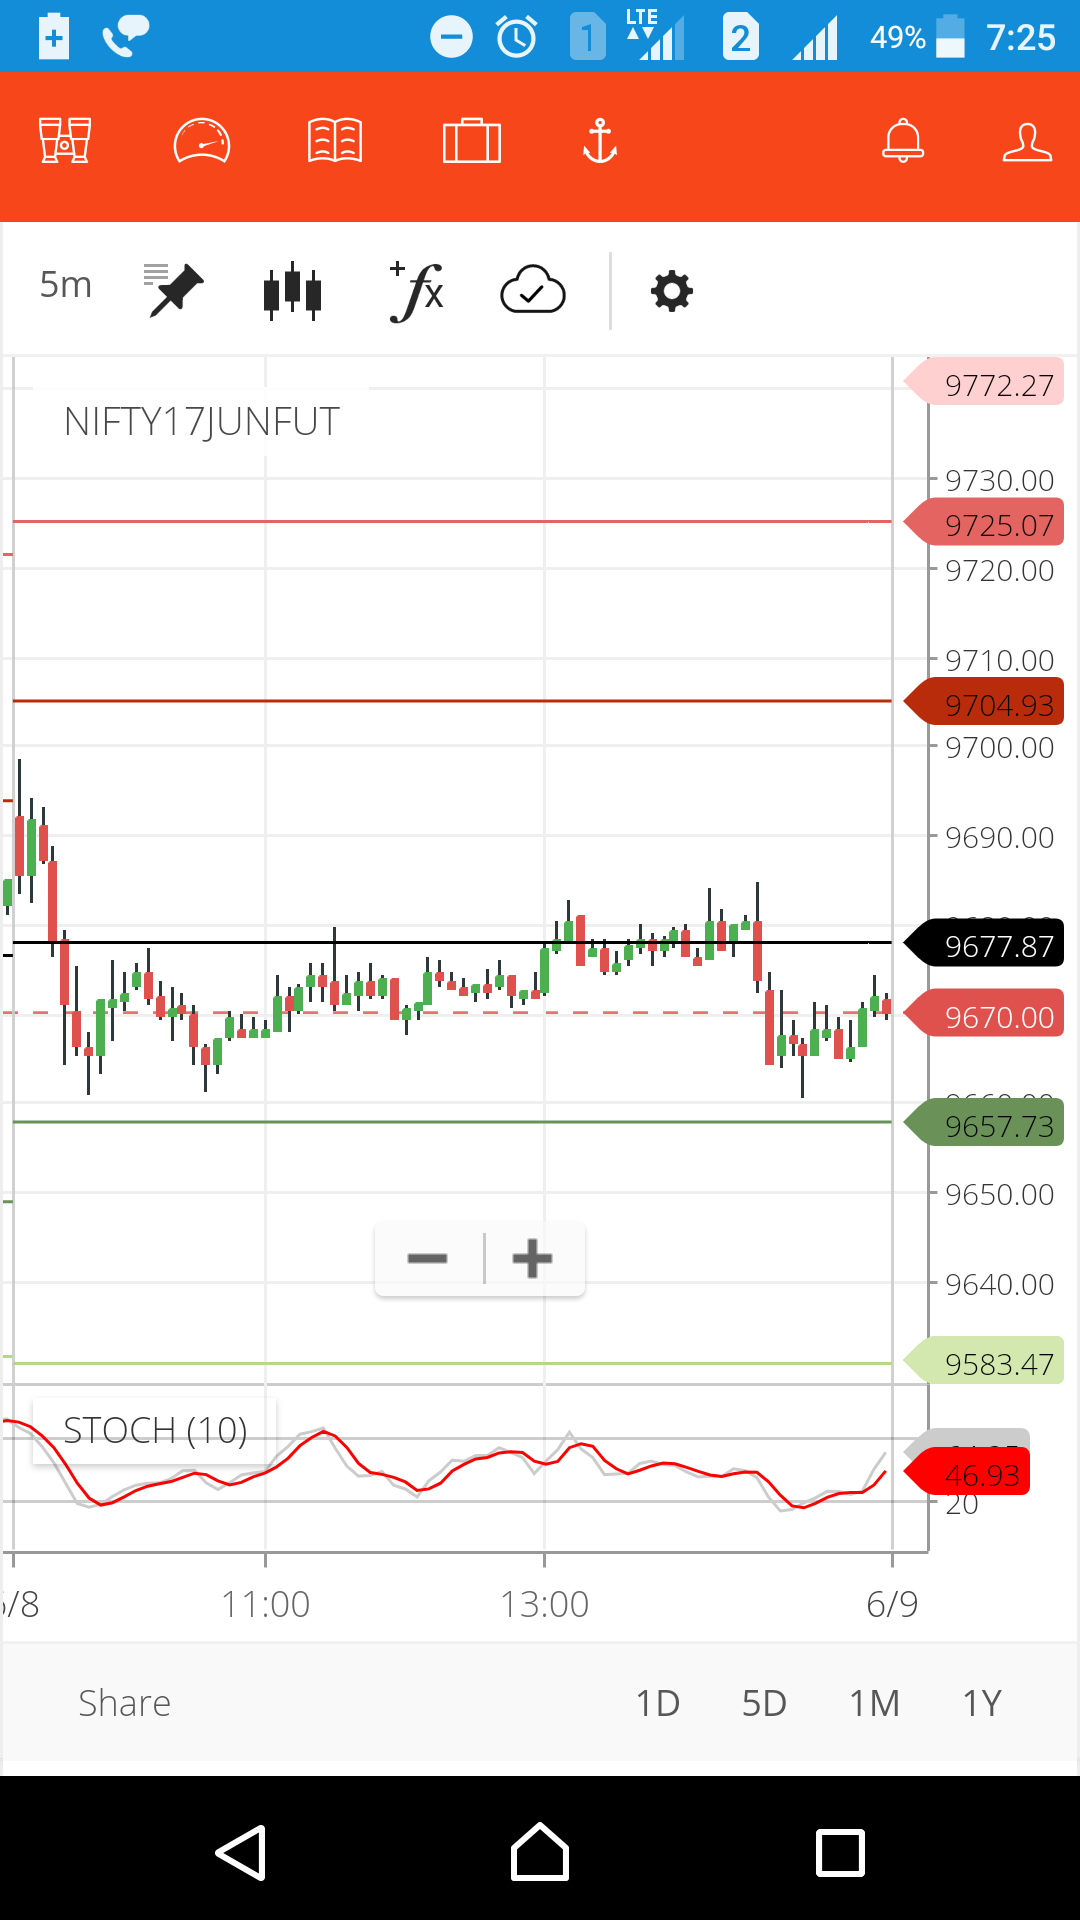
Nifty Jun future… 5 min tf for intraday
2 Likes
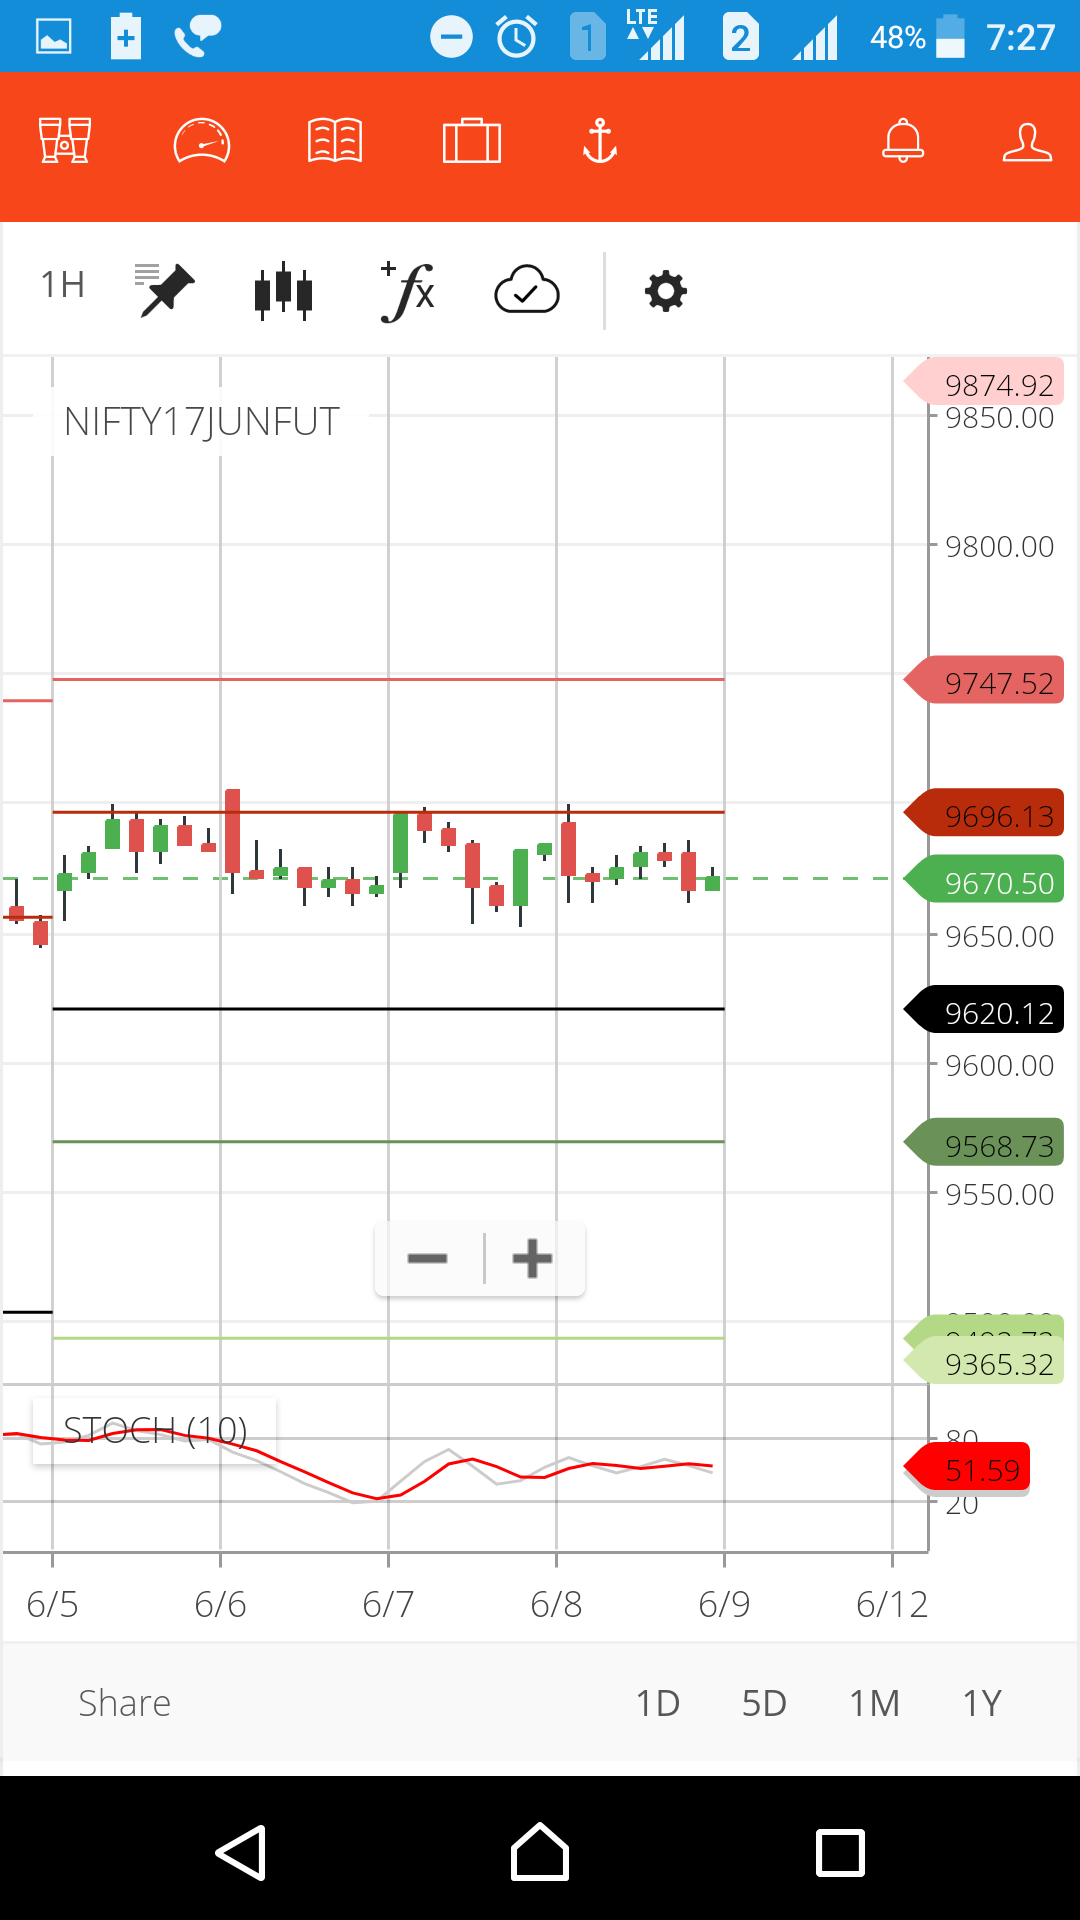
Here look how 9696 level which act as resistance 1 or R1 is restricting upside.
9620 is d pivot point.
In case price closes abv 9696 it shall become support and nifty may aim next resistance of 9747… This is applicable for this week only
Close below 9620 may lead to breakdown upto 9568 levels
3 Likes
3 Likes
For intraday… See 2nd screenshot… I wud put buy order near support levels + buffer (ur risk taking capacity) say rs. 8 so put buy order at say 9654 +8 I.e at 9662 sl support
Tgt 1.5 to 2 times… In this case 9677 is tgt 1 which can give 15 points I.e 1.25 times the risk
I consider 9654 for support level bcoz it may b possible that price can go below nearest support
Alternatively u can wait till price reaches support and respects it… Then starts turning up say 5-8 points which wud serve as ur sl level.
Some traders take trade at 1 level say buy at pivot sl is support 1 and tgt is resistance 1 if rr is 1.5 or 2 +
Same applies to swing trade… Risk reward shud b min 1.5, preferably 2…
2 Likes
@VIPULK nicely explained. Till now I was not looking at resistance and support in my trading decision. What about fibbonachi? It’s role as support and resistance.
Bro no harm in following fibo as it’s one of d most respected and influential decision making level provider especially how magically price reacts near godly no. of 61.8% retracement… But as I had myself queried abt following too many indicators and getting confused, I wud suggest u to follow only one decision making tool… Wud study fibo levels and post some screenshots in next post maybe… ![]()
for intraday: indicators are not that much necessary as that of support and resistance, reason being indicators are lagging with respect to price but you must use them for knowing whether the price will fall or rise in next minute. the indicators to use for intraday trading is sma 5 days and ema 10 days, these are the indicators which i use for intraday. the major point in intraday is breaking of support and resisitance level. in intraday,
indicators=useful
candles= yes, useful
chart pattern: to know about support and resistance
price actions: useful
volume, not that much useful
swing:
indicators, no need as the trade is swing and not the time based such as intraday, as intraday is time based so you need some indicators which can guide our path (for intraday trading, indicators act like, just like the fuel indicator in motor bikes when time is urgent and head light is needed to guide our path at night).
candles= yes, very very useful as candles are the foremost important thing which decide our trades future which will be in profit or not. see, for trading, the first indicator which we see is price in the form of candles and the medium in charts, so candles are useful.
chart pattern: very important as the chart patterns are the clear indicator of price direction.
price actions: price action is same as chart pattern
volume: volume is useful in swing trading as to know where is the money flow going.
ok, got it,
have a good time trading.
What will be your changes in pivot points strategy for Trending days .
As well as for Bank Nifty ?
Bro, cant change strategy based on trending or non-trending days…
I use ADX indicator to see if there is strength in trend be it up or down…
If indicator shows value above 25, it shows great strength. Chances are that next hurdle or support could be broken hence slight points above or below the levels shud be buffer.
As far as Bank Nifty is concerned, I have stopped trading the same due to its extra volatility
1 Like
Intraday 10 min is best and for swing daily chart is best… no comments