Hi
Can u please mention tje different studies usd in tje chart witj names and values
Hi
Can u please mention tje different studies usd in tje chart witj names and values
Hello, @chandan_das_gupta what you do is Just create these settings on your chart and BackTest them on Diffrent Stocks.
CHART SETTINGS = 15 MIN
RSI PERIOD SET TO 2.
SET TO Overbought 90 AND oversold 10.
If RSI is above 90, we will take SELL POSITION.
If RSI is below 10, we will only take BUY POSITION.
Thanks in advace@Lets_Invest
My understanding is
15mts bar close with RSi above 90 is for sell
15 mts bar close with RSI below 10 is buy.
kindly let us know, where to place stop loss?
Actually it is not getting uploaded dud to some system glitch. I m talking about the first chart u have given(idfc)… All the indicators used with value i want to know
@chandan_das_gupta both the charts have same settings.
CHART SETTINGS = 15 MIN
RSI PERIOD SET TO 2.
SET TO Overbought 90 AND oversold 10.
If RSI is above 90, we will take SELL POSITION.
If RSI is below 10, we will only take BUY POSITION.
@chethanrai you can put your Stop-loss & Target as per your Risk and Reward Ratio.
Example:- If I am taking a trade for a profit of 2:1
Where 2 is my profit and 1 is Loss.
But If a stock is volatile I give Room to my Stop-loss so, that it Not get Triggered.
i think you are uploading charts from mobile…?
tried on tata steel 15 mts chart:… not working…
Yes, This setup is not working on TATASTEEL.
TATASTEEL is in Uptrend It’s look like it will continue the rally. Delivery % is also increasing from 06-Oct-2017. And from Last one month change is 4.04%
For, Those Stocks which are not following This setup I’ll use Moving averages & ADX and Price action Strategies.
yes it will failed in every stock which have a strong uptrend
or downtrend…
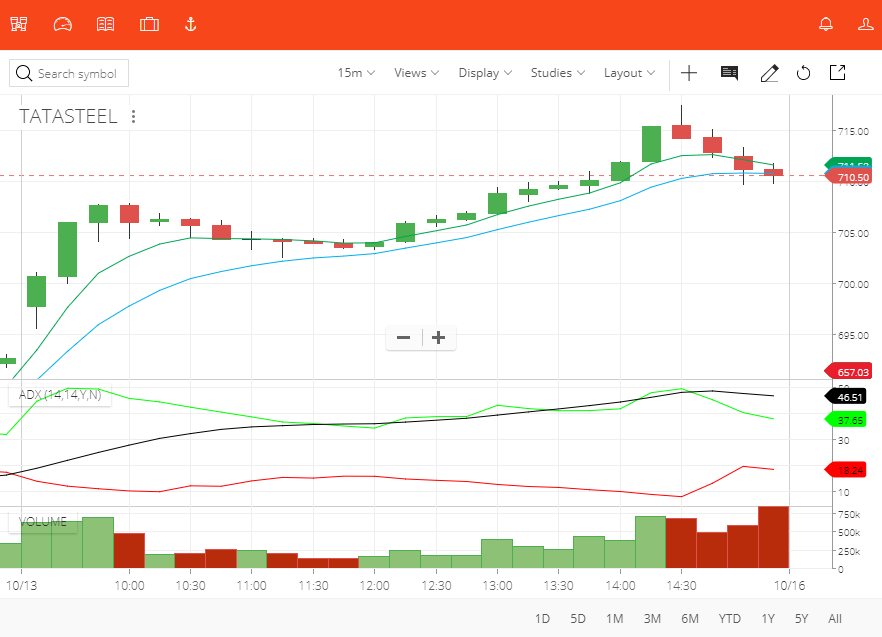
BACKTEST THESE SETTINGS FOR TATASTEEL.
These settings will Only work When the stock is in STRONG UPTREND OR DOWN TREND.
Chart Setting = 15 min
FOR BUY POSITION:-
When The stock price is Above 5 EMA and as well as the ADX is Incresing Its A BUY signal and When the Price Will come Below 10 EMA Exit from your Buy Position and Book Profit You will also see ADX Will start coming down.
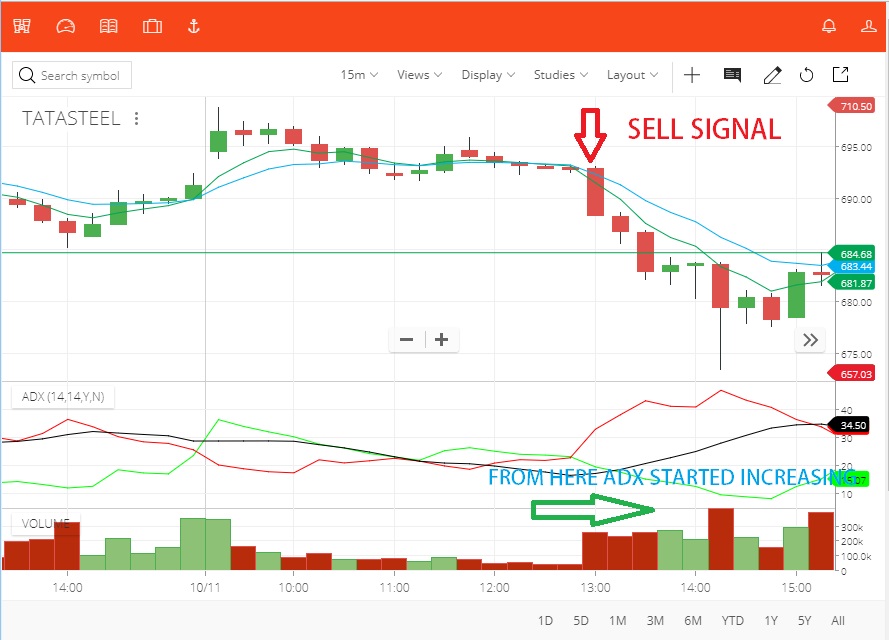
FOR SELL POSITION:-
When The stock price is Below 10 EMA and 5 EMA and ADX is Inceasing Its A SELL signal.
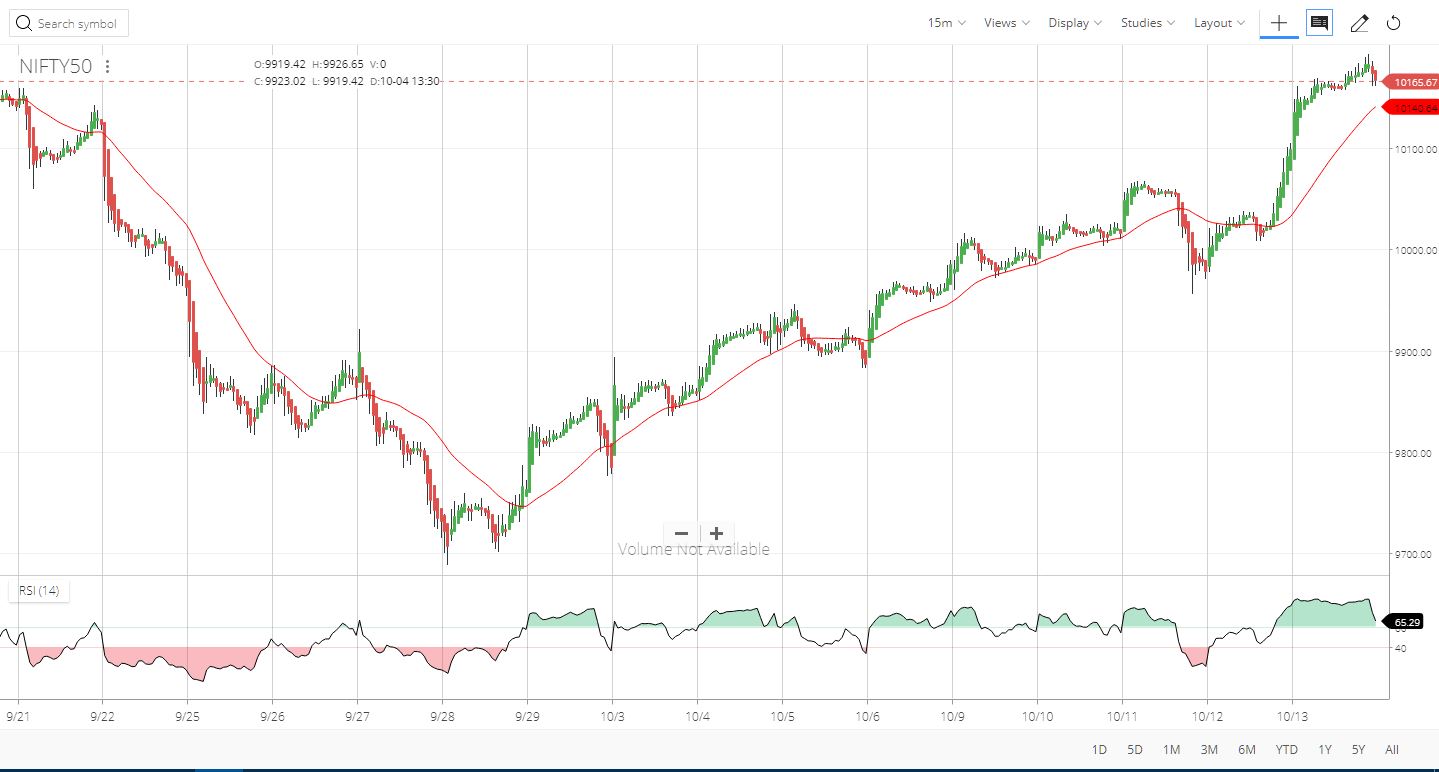
This RSI strategy was originally proposed by Andrew Cardwell.
Please note that RSI is set to default 14 thru-out this discussion
Buying RSI above 60 and And Selling RSI below 40 is coined due to the technical nature of the Indicator. Detailed mathematical explanation for this may be out of the scope for this forum but I would like to highlight few points to explain why this strategy was devised.
I wish you all best.
I tried the same strategy for ICICI Prud and is doesn’t worked for me. I set the RSI with Period 2 with SELLING above RSI = 90 and BUYING below RSI = 10.
Yes, I Just saw it’s not working.
We all know not all the setup will work.
Find out those stocks which follow the Technical analysis. Not all the Stocks follows technical analysis.