The same settings will work for short and medium term trading. Try putting the indicators on your daily chart and see how the indicators work.
1 Like
I Am Also Having The Strategy For Intraday And Positional Trades.
Setup Is Like That
CandelStick Pattern = hikenashi
Indicators - 1) Stocastic ocllator
2) Stocastic Momentum Indicator
3) RSI (5 Days)
And Super Trend With 14/1.5 Levels.
I Am Founding It Very Good For Trade ( With 3-5 Min Chart ).
2 Likes
Niraj sir, can you pls post some charts for our learning
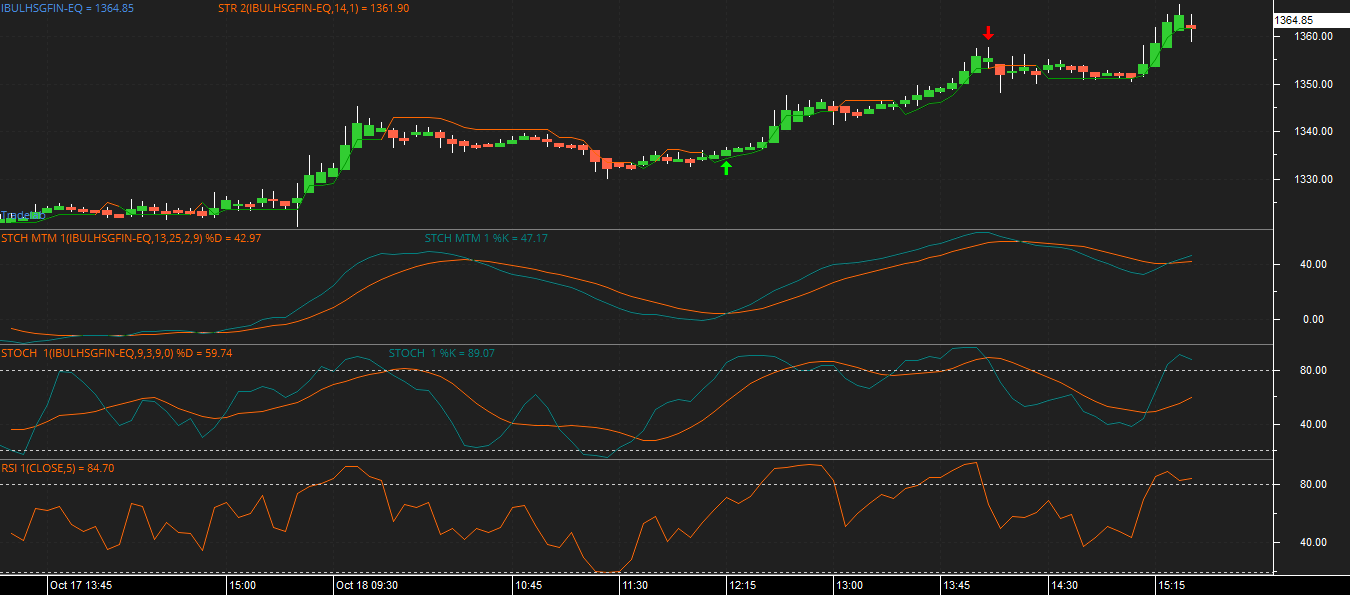
As You Can See From Charts That First The RSI And Stocastic Gets To Buy Mode And The Comformation Is Received As The Stocastic Momentum Indiacator Gets Positive.
(The Buy And Sell Signal IS Given In The Charts The CandelStick Pattern Is Hikenashi )
1 Like
Thanks sir for the chart
Sometimes RSI stays in overbought rang for long period of time from months to years .
and if the stocks RSI is above or in 70-100 for longer period then you may go for long position because it takes some time for the price to come down from overbought(70-100) to oversold(0-30 range) position .
If you see RSI move from oversold range and towards overbought you can look for going long and vica versa .
so a period of 2 for rsi is not reliable at all.
1 Like
point
well taken
its an excellent set up , i tried it , works wonderfully , i tried it on a 5 min chart , did not use ma
excellent , wonder if rsi set to 2 , and 90 10 oband os will work equally well
regards
its a beautiful strategy , however rsi above 80 ot rsi below 10 , till what limit it could go up coz i have seen
eg finserv i traded , i sold yesterday when it went above 80 rsi , however it kept going up , it reached rsi 100 almost , luckily
since i was only backtesting it with one share i did not put a stop loss
it ultimately did come down , but my question is , is there limit to it going up endlessly or going down below 10 endlessly
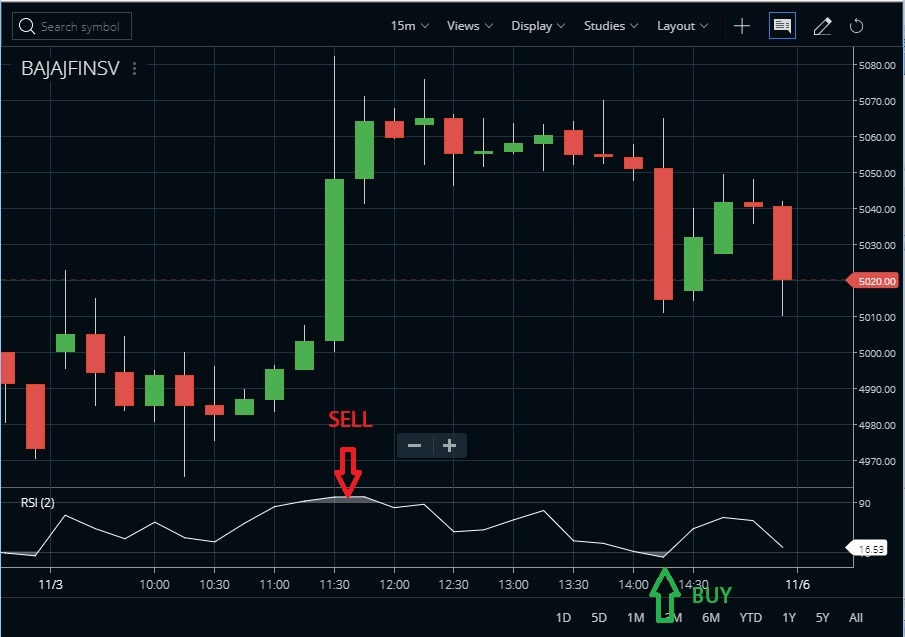
Setup Have Give a SELL signal. Price Movement of Rs.20/- Can be Achived easily, Rs.20/- Movement in Intraday I must say Its a Huge Movement. Its all upto the Trader Risk and Reward Ratio.
Sir, There is No Limit. It can go Up continuously and Even it can stay Above 80 RSI For Hours, weeks, Months, Years No one Knows.
Whatever Goes Up will come Down for sure. No one Buys at Higer Levels. Once the Fresh Buying Stops Price start coming Down.
Sir, There is No Limit. It can go Down continuously and Even it can stay Below 10 RSI For Hours, weeks, Months, Years No one Knows.
Whatever Goes Down Will Come Up For Sure. No One Sell at Lower Levels. Once the Fresh Selling Stops Price start Coming Up.
That’s why I said You have to be Quick for using This Setup. One you get the signals Take your Decision and When You Achive movement of Rs.3 to Rs.5 Movement Exit from the Position And Book your Profit Don’t wait for Whole day.
3 Likes
Thanks for the reply .
Maybe combining this strategy , with 8 ema and 8 sma should be better rather than taking signals only from one RSI indicator . Sell above RSI 90 and buy below RSI 10 .
Regards
Anil
I want to ask one thing, though RSI may not work for some stocks & sideways movement but it does gives some insight to the traders.
But still, many times RSI remains in overbought range & stock price keeps moving further up & up.
Vice versa also true.
Then RSI can be doubtful in above cases.
1 Like
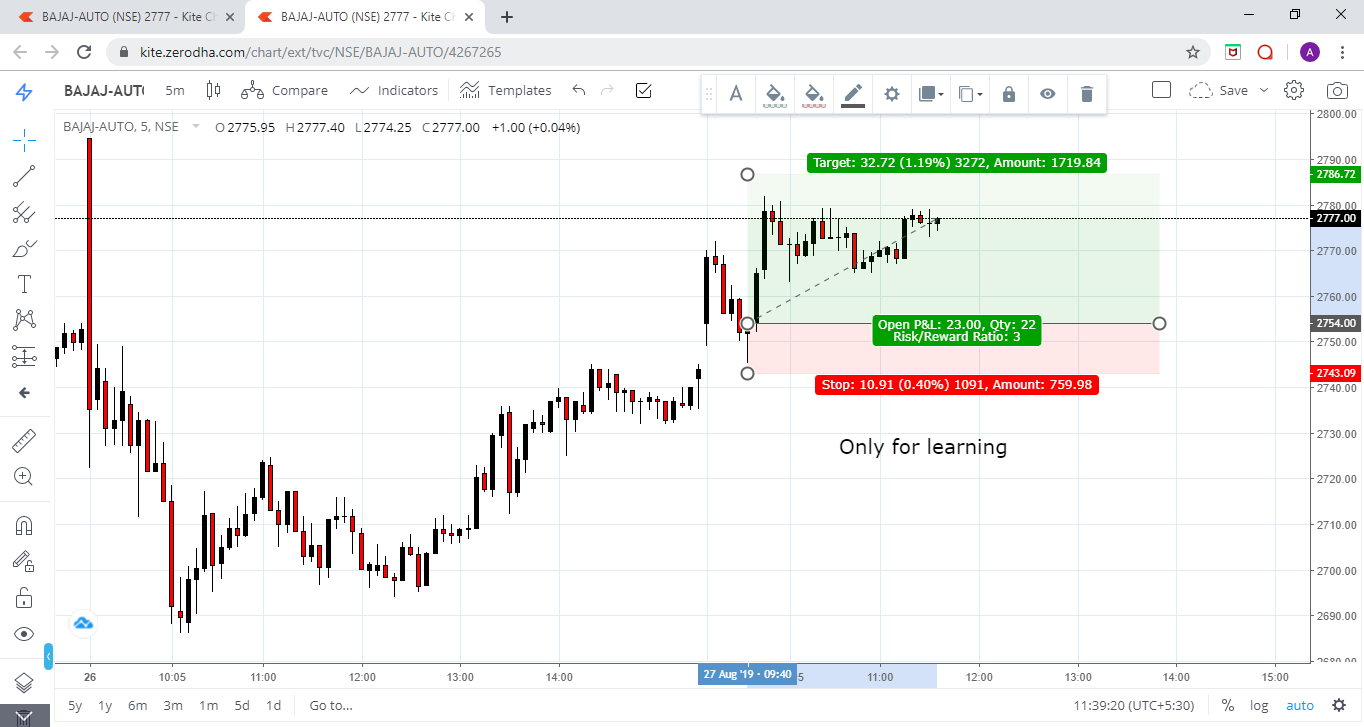
This not a reliable strategy at all . here is example why . I f I had sold at rsi above 90 i would have made loss here .
This is good strategy but it should for 80 n 20 levels.However, if their is trend upwards n downards or in both directions.thiw strategy doesn’t work well. I have used this.
Nice strategy that you have discussed with us.
Making mistakes is part of the learning process when it comes to trading or investing. Investors are typically involved in longer-term holdings and will trade in stocks, exchange-traded funds, and other securities. Experienced traders get into a trade with a well-defined plan. Taking a quick planning strategy will help some factoring company to get a good profit to grow.
Bank Nifty Option trading which time frame to be used for safe trading? I have been using one minute time frame and faced huge losses.
Somebody please reply on this
It depends on what kind of strategy you are using. For example if you are using some Delta Neutral and Theta decay strategy then Daily time frame might be logical to use. On the other hand if you are using a directional strategy then lower time frames can also be useful.