With the current market volatility due to global Corona virus impact, we could see Nifty & Bank Nifty indices along with other stocks often gap down and at times gap up as well. So we analysed the historical data for last 20+ years to check what happens to market on such gap days, what is the Intraday movement during such gap days. The movement from Day Open to Close.
We analysed the following scenarios.
- List of gap down days which are more than -1% on Nifty and Bank Nifty
- List of Gap up days, which are more than +1% on Nifty and Bank Nifty
- What is the % movement during gap down days, i.e from Open to close on such days.
- What is the % movement during gap up days, i.e from Open to close on such days.
Nifty Gap down:
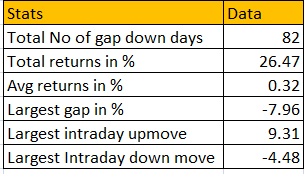
There are in total 82 times Nifty opened gap down more than -1% and this is how the Intraday movement were during such days. X axis represents percentage of gap down and Y axis represents percentage of intraday movement.

The total intraday returns generated during such gap down days is +26.47% which means, going long in gap down days has resulted in +ve returns with a average returns of 0.32%
The largest gap down historically is -7.96% happened during 1999 dot com bubble burst period, largest percentage gain made in intraday by going long at open is 9.31% which happened recently 13th March 2020. And largest fall even after such gap down is, -4.48%
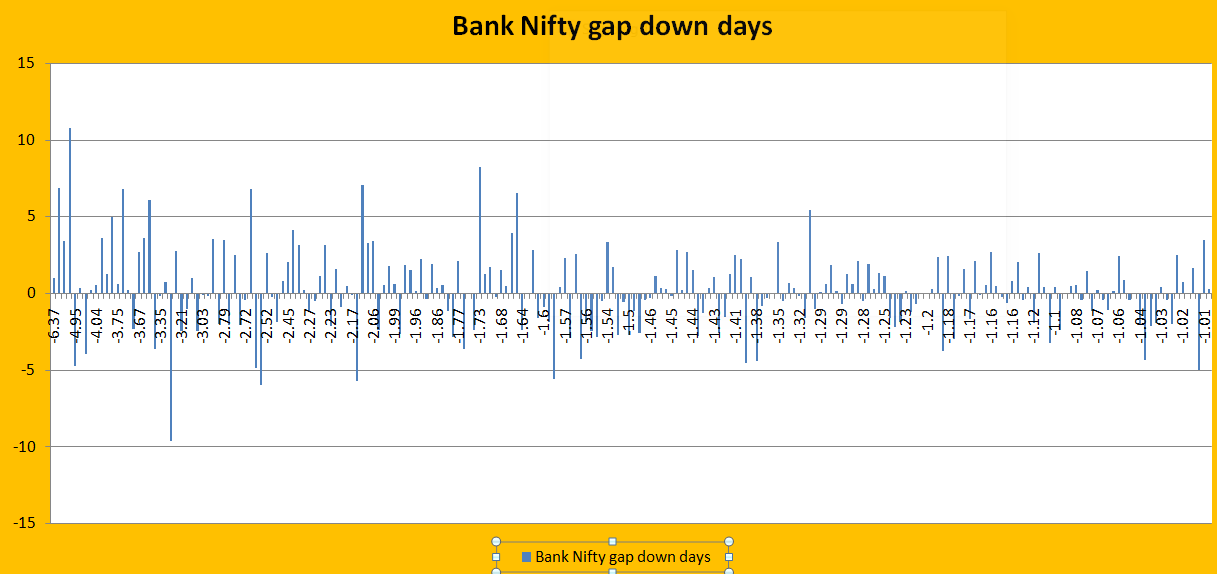
Bank Nifty gap down:
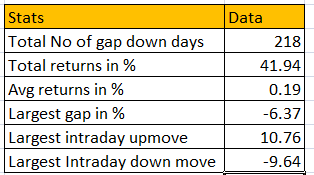
Here’s the similar analysis for Bank Nifty. There are in total 218 times Bank Nifty opened gap down more than -1% and this is how the Intraday movement were during such days. X axis represents percentage of gap down and Y axis represents percentage of intraday movement.
The total intraday returns generated during such gap down days is +42% which means, even with Bank Nifty as well going long in gap down days has resulted in +ve returns with a average returns of 0.19%
The largest gap down historically is -6.37% happened during 2008 global financial crisis period, largest percentage gain made in intraday by going long at open is 10.76% which happened recently 13th March 2020. And largest fall even after such gap down is, -9.64% happened during Lehman crisis in Oct 2008 period.
Nifty Gap up:
Usually the psychology varies so much among investors/traders during gap up and gap down, during gap down days, fear and panic kicks in where many investors end up making irrational decision which make market fall down rapidly, that’s where large fund houses and large investors come in start purchasing which eventually push up the market by the end of the days, that’s why we have seen positive intraday returns by the end of day when gap down happens.
Let’s see how market reacted during gap up days. There are in total 131 times Nifty opened gap up more than +1% and this is how the Intraday movement were during such days. X axis represents percentage of gap up and Y axis represents percentage of intraday movement.

The total intraday returns generated during such gap up days is only -5.31% which means, going short in gap up days has resulted in +ve returns but with a average returns of only -0.04% only. So mostly after such gaps up days, market neither moves up or falls down, it stays stagnant. It is mainly because, unlike gap down days, during gap up days, there is no fear or panic kicks in.
The largest gap up historically is 10.39% happened during 1997 bull market just before dot com bubble burst period, largest percentage gain made in intraday by going long at open is 4.53% which happened in 1996. And largest intraday down move is, -6.82%

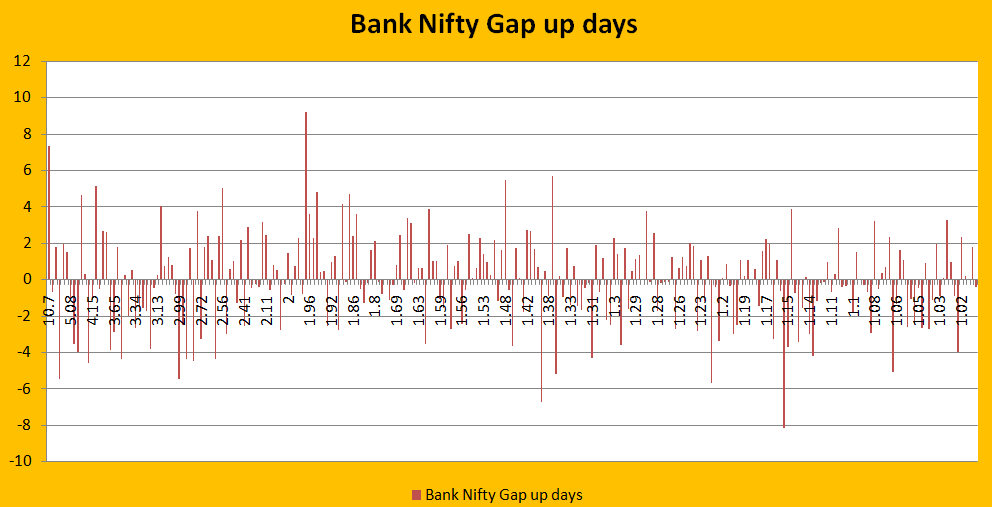
Bank Nifty Gap up:
Compared to Nifty, Bank Nifty is 1.8 times more volatile, hence usually gaps are more common in Bank Nifty than Nifty index. Let’s see how market reacted during gap up days. There are in total 257 times Bank Nifty opened gap up more than +1% and this is how the Intraday movement were during such days. X axis represents percentage of gap up and Y axis represents percentage of intraday movement.
The total intraday returns generated during such gap up days is only -1.34% which means, going short in gap down days has resulted in +ve returns but with a average returns of only -0.01% only, so it doesn’t make sense for anyone to go long or go short on gap up days, since movement after such gap up is very minimal. So mostly after such gaps up days, market neither moves up or falls down, it stays stagnant. Same as Nifty.
The largest gap up historically is 10.7% happened during 2009 May, largest percentage gain made in intraday by going long at open is 9.18% which happened in 2008 global financial crisis time. And largest intraday down move is, -8.17 which happened on 18th March 2020, just this week.

With such huge historical data analysis, it is clearly evident how Nifty and Bank Nifty reacts on gap up and gap down days. Option sellers who wanted to create a strategy based on the above analysis, can do directional trading, can go short in Put options on gap down days with pre-defined stop loss, so that if continues to slide you can come out with minimal loss and when market reverses and moves up, your put option premium tends to lose value thus resulting profits. On Gap up days, Option sellers can consider short strangle or short straddle, since after gap ups markets aren’t moving much.
Users who wanted to explore the data further, can download the historical report here which contains, whats the gap % and whats the intraday % movement.