Hi All,
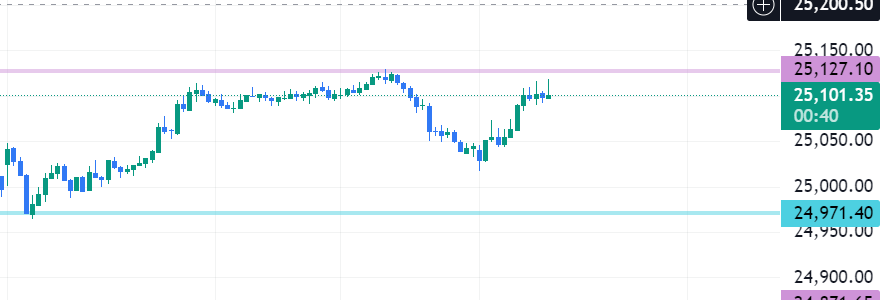
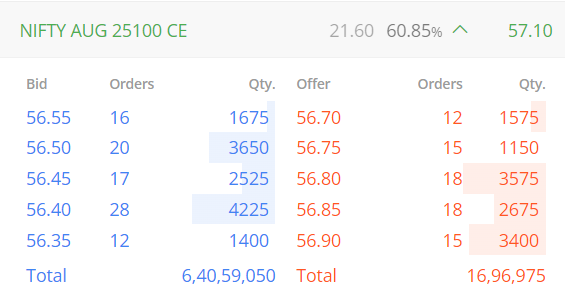
Please help me with understanding, per my view the current levels of nifty and seeing the strike data of 25100 where there is massive buying indicated the market will go up,
The only reason for it to come down and market closing below 25100 will be when the data become the opposite i.e the sellers become more than buyers.
With that said it can also be a case that this strike has been bought as a hedge, if yes how to identify if this a hedge or a actual position that has been created.
10:15 AM
if you make decisions like this you’ll lose money, a lot of money.
2 Likes
The following answer from “CHATGPT” for your query coz I also curious to understand from misunderstanding to understanding. Lots to read on DOM and OI. Maybe check on “SENSIBULL”.
Understanding options data and its implications can be nuanced, but let’s break down the scenario with the Nifty index and the strike price of 25100:
- Understanding Strike Data and Market Direction
- Massive Buying at 25100 Strike: When you see significant buying activity at a particular strike price, it often indicates that traders expect the market to move towards that level or higher. In this case, if there’s substantial buying at the 25100 strike, it could suggest bullish sentiment, implying that traders believe the Nifty will move above 25100.
- Hedging vs. Speculative Positions
To determine whether the buying at the 25100 strike is for hedging or speculative purposes, consider the following:
A. Identifying Speculative Positions
- Open Interest Changes: Look at the changes in open interest (OI) for the 25100 strike. If open interest is rising along with increased volume, it might indicate that traders are taking new speculative positions rather than just hedging.
- Price Movements: Observe the price movements of the options contract. If the option price is increasing significantly and is far out of the money or at a strike where traders are not just covering positions, it might be speculative.
- Market Sentiment: Check the broader market sentiment and news. Bullish news or economic data might align with speculative buying, reinforcing the idea that the positions are created with a view that the market will go up.
B. Identifying Hedging
- Volume vs. Open Interest: If the volume of trading at 25100 is high but the open interest remains relatively stable or changes slightly, it might indicate that the contracts are being bought as hedges against other positions, rather than new speculative bets.
- Volume Patterns: Large trades executed in blocks might suggest institutional hedging activities. These transactions could be part of a larger strategy where institutions are adjusting their portfolios and using these options to hedge against potential market movements.
- Implied Volatility (IV): Monitor changes in implied volatility. Significant increases in IV along with the buying at this strike could indicate hedging activity. Hedgers might be willing to pay a premium for options to protect against adverse moves.
- Additional Considerations
- Compare with Other Strikes: Check the activity at other strike prices to see if there is a pattern. For example, if there’s also significant buying at strikes above 25100, it strengthens the bullish outlook.
- Look at the Open Interest for Other Strikes: See if there’s a build-up of positions at higher strikes, which might indicate a bull call spread strategy or similar, suggesting a bullish outlook.
- Check for News or Events: Sometimes, buying at certain strikes is influenced by upcoming events or news that might impact market direction. If there’s an announcement or economic report expected, it could explain sudden large trades.
By analyzing these aspects, you can better gauge whether the buying activity at the 25100 strike is more likely a hedge or a speculative position.
Please go thru with your own way of analyzing and understanding the concepts.
so what should be the approach could you guide, because market also expired above 25100,
Please share examples so as i can go back test and learn, thank you
Thank you soo much for sharing this .
Instead of that data it’s better to use Open Interest Analysis to assume market movements.
Read this -
Or watch some videos on YT on the topic.
I personally don’t use OI analysis.
1 Like
check abid hassan @Sensibull on youtube. something on the lines of what he does.
also read this What is the disclosed quantity feature and how to use it?
1 Like
Watching the level 2 for particular strike price to make the decision on entering a posiotion will not help you in becoming profitable.
Level 2 can also be a spoof as well.
You should watch the level 2 and level 1 (time and sales) at your key level whether to see if there will be a breakout or not, so that you can make a informed decision based on the activities happening at your level.
Before you Strat to backtest, you need to break down your strategy/setups/playbooks.
- what are the entry conditions
- what are the exit conditions
- what type of market conditions these rules works
Once you have answer to this questions then you can go and backtest your playbook and see how it works. if it is not working, then you have to comeback and refine your playbooks.
Once your Playbook is defined even with 50% win rate, then you have to work on you risk management along with your psychology.
1 Like