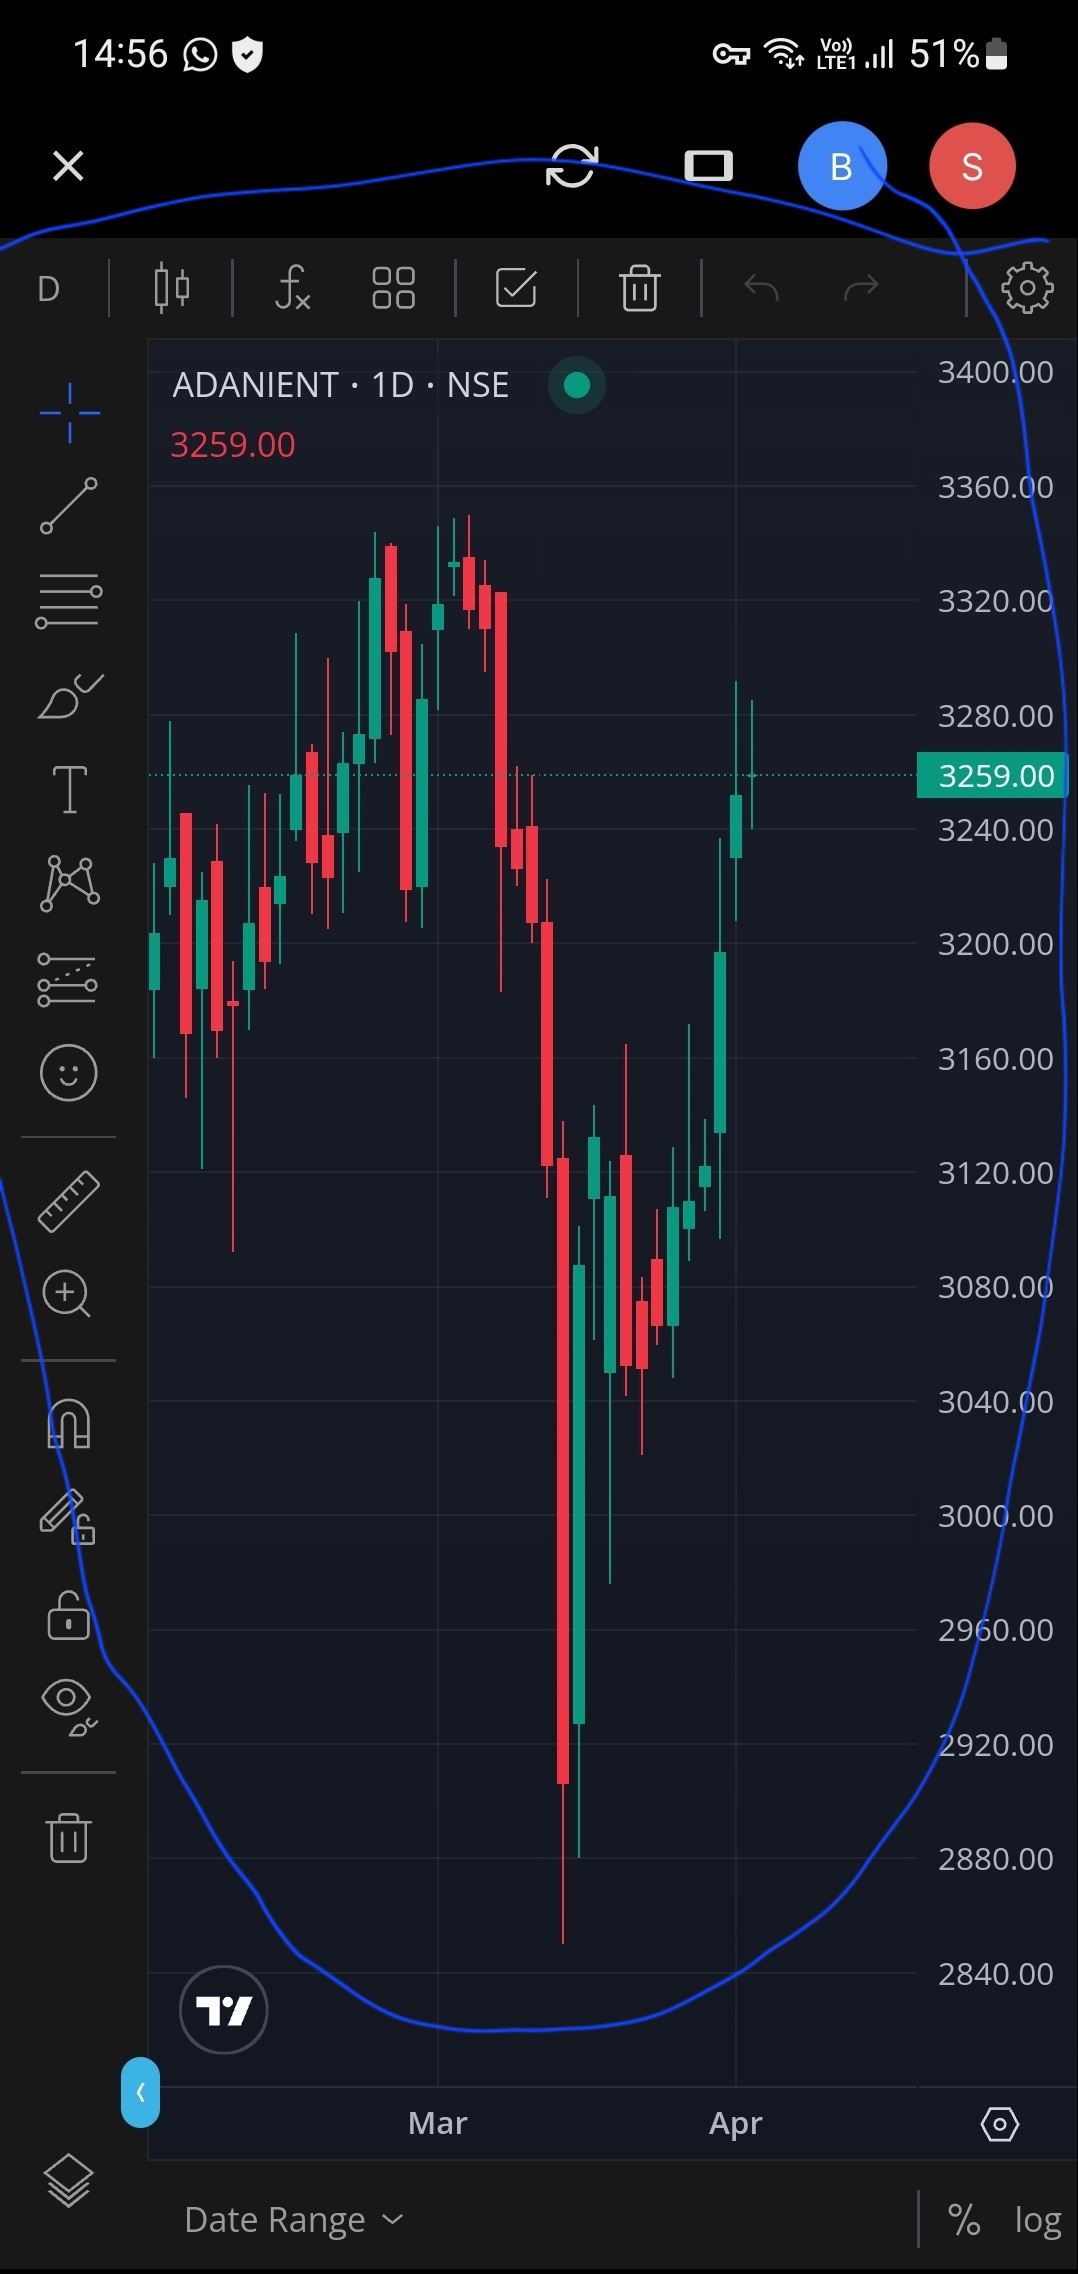
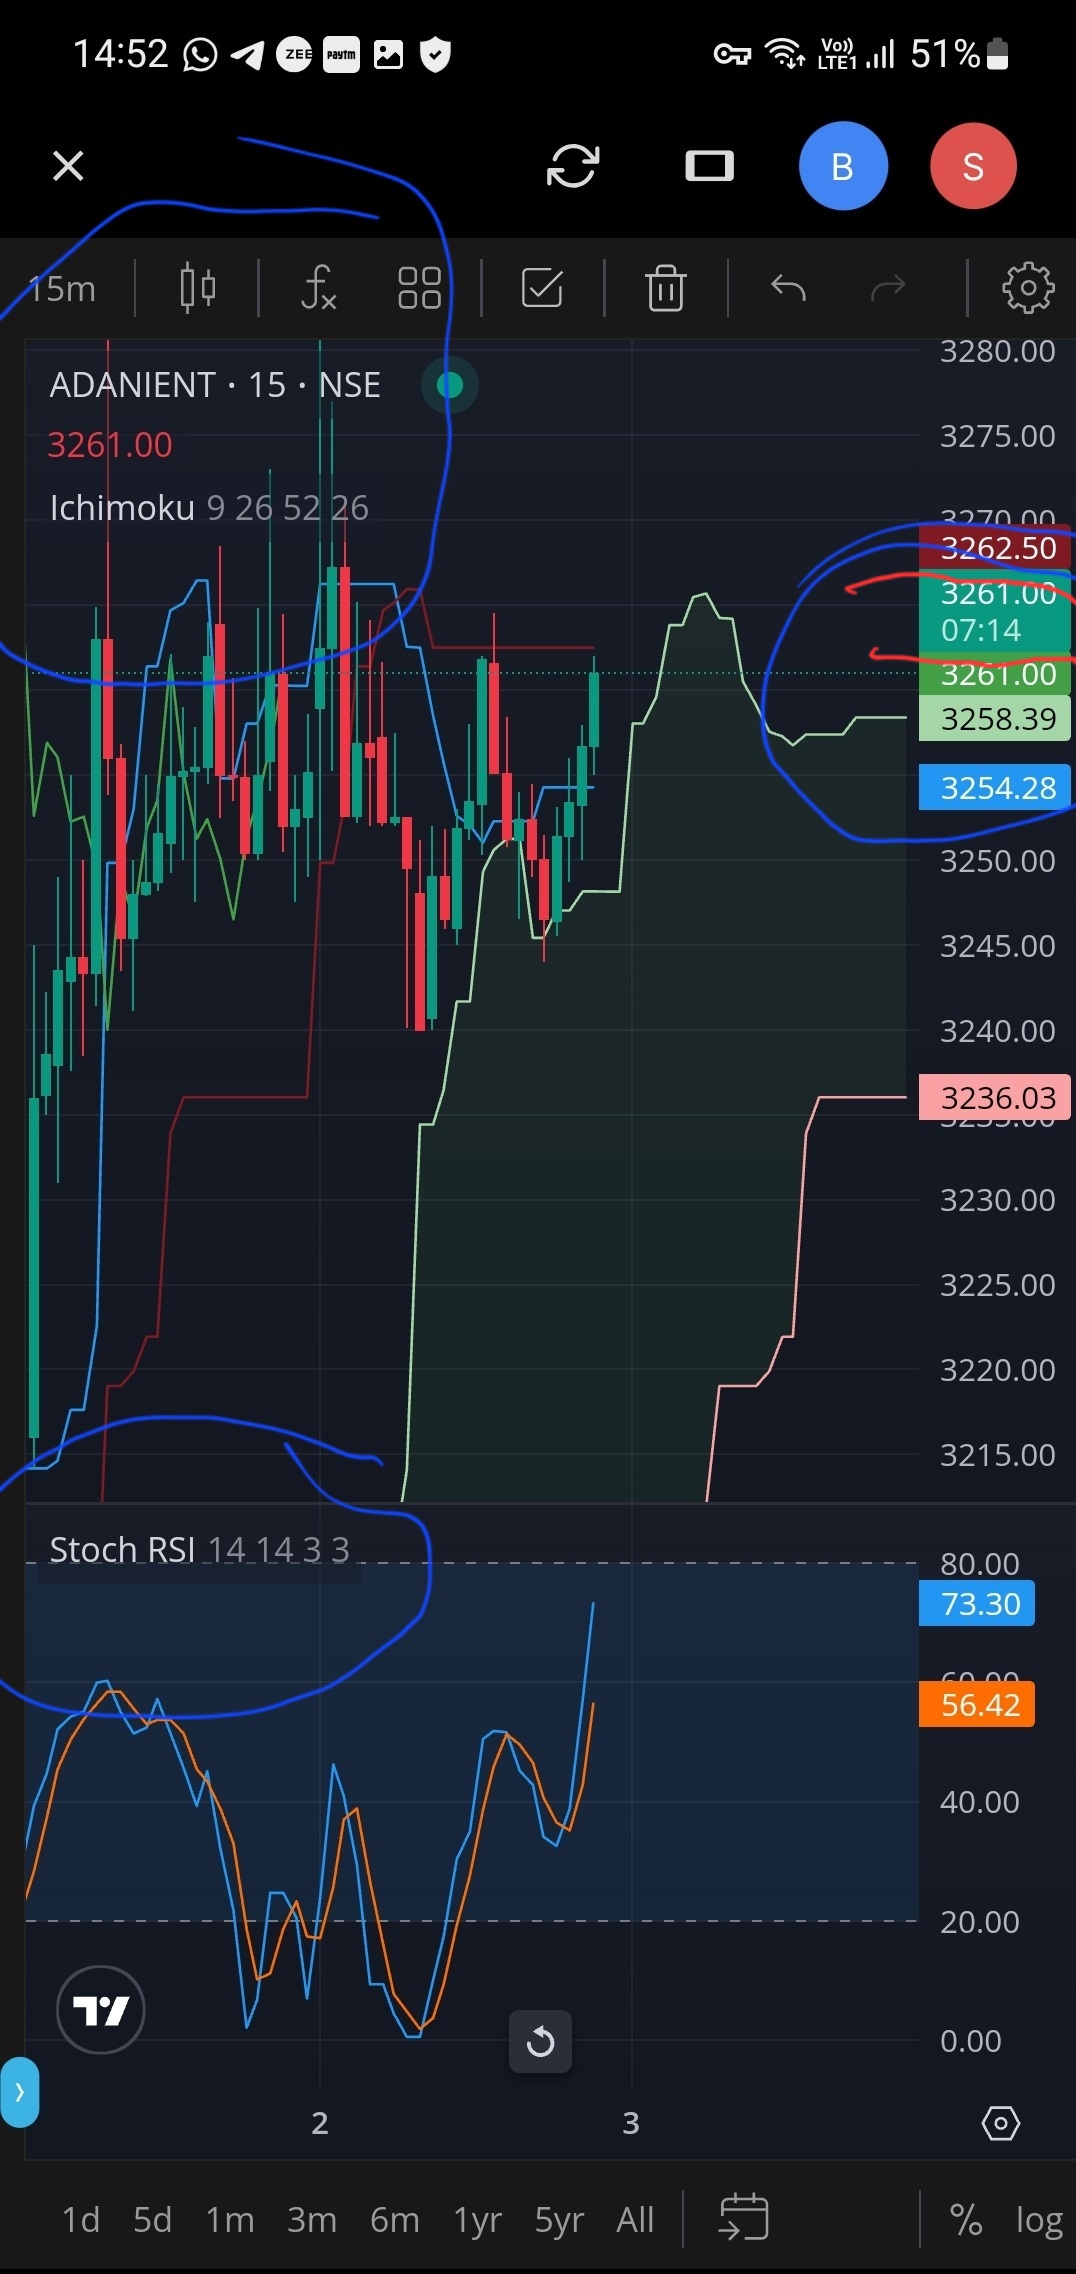
I have observed that whenever trading view V2 beta chart is used & if any indicators are added after sometime it gets disappeared from the chart. Also time frames gets disappears viz chart is reset to it’s original view. Is this default or any issue? . This shud not be happened if anybody have added any indicators then that shud be there whenever he opens the app.
Also is there any feature / indicator where we can see at what price we have bought & sold the shares? Currently I do not see this on chart
I have attached SS for reference.
If I use trading view app it do not disappears on that but in kite web & mobile app it disappears whenever I’m away from the app.
As per the above query, we wish to inform you that currently on the Trading View V2 the auto-save feature is not available. After adding the indicator or switching to a different time frame you can save the same as Template. To save it as the default Template, click on Save as default layout. However, we have made a note of your feedback and will look for the possibility to incorporate the same in future updates.
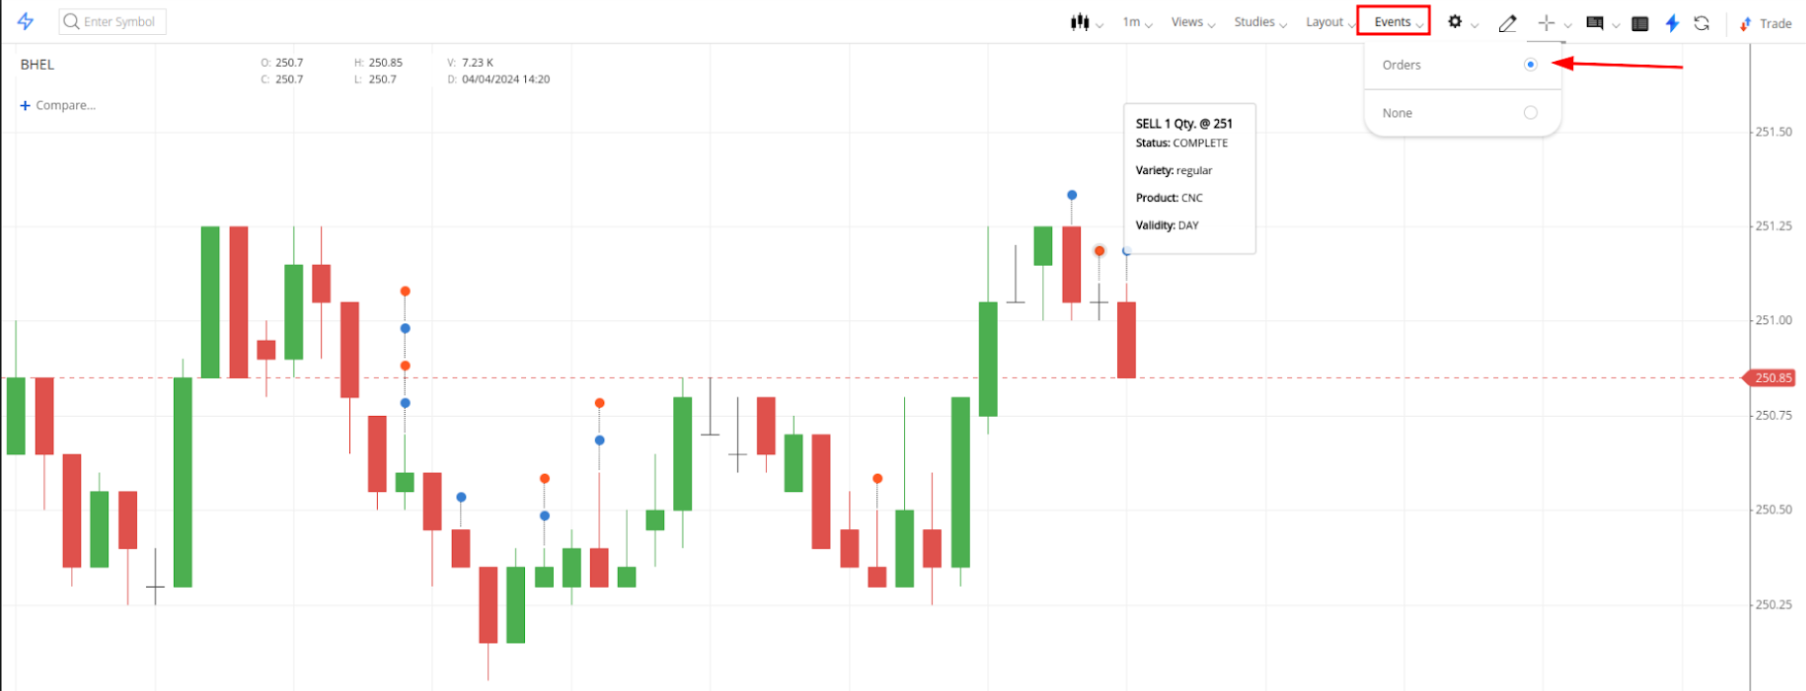
We would like to inform you that on the Chartiq charting library we can see the same day purchased orders on the chart in the Kite web. Please find the attachment given below.
Currently, the Event feature on Chart IQ charts is exclusively accessible on the Kite web platform. Your feedback regarding this has been duly noted, and we will explore the feasibility of integrating this feature into the Kite mobile application.
As of now, the features mentioned above are not present on the Chart IQ charting library in Kite. Your feedback has been acknowledged, and we will explore the feasibility of incorporating these features.
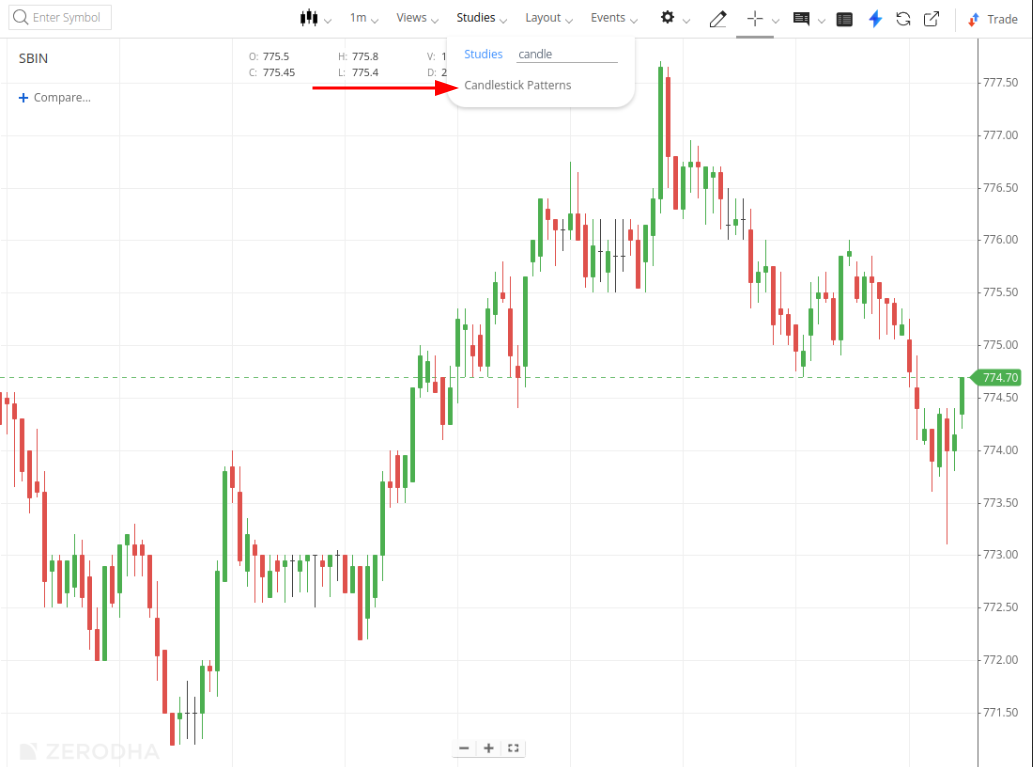
Currently, the Candlestick Patterns indicator is accessible on the Chart IQ charting library in Kite. Please verify this feature. At present, it is not available on the Trading View charting library. Nevertheless, we have taken note of this and will explore the option of incorporating it.