Welcome back to The Long and the Short—where you get an honest take on trading, something you won’t hear elsewhere.
I’m Sandeep Rao. In our last episode, we explored the fascinating concept of the Overnight Drift — that strange but powerful idea that markets often move the most when they’re closed. Prices gap up or down overnight, rather than inching along during regular trading hours.
Today, we’re building on that theme by diving into another timeless idea: trend following . This isn’t just some new trading concept — in fact, it’s the opposite; it’s been there for centuries. And it’s still going strong in many ways.

Whether you’re a long-term investor or a short-term trader, trend following has something for everyone. If you understand how it works, it can be the backbone of a systematic, resilient approach to markets.
The Pioneer: Richard Donchian
There’s one name that quietly shaped the entire philosophy of systematic, rules-based trend following — long before computers, algorithms, or the famous Market Wizards — Richard Donchian .
Yes, there were a few before Richard Donchian, but it was Donchian who pioneered rules-based trend following.
Born in 1905 in Hartford, Connecticut, to Armenian immigrant parents who traded in oriental carpets, Donchian’s story began far from Wall Street. His parents had fled Western Armenia, then under Ottoman rule, and built a new life in America.
A bright student, Donchian graduated from Yale with a degree in economics and later earned an MBA from MIT Sloan. His first job wasn’t in finance at all — he worked as an assistant in his family’s rug business. But fate had other plans.
One day, he picked up a book that would change his life forever — Reminiscences of a Stock Operator , the legendary account of Jesse Livermore. The book captivated him, and soon his fascination with markets took hold.
From Fundamentals to Price Action
In his early years, Donchian was a fundamental investor — studying earnings, analyzing balance sheets, and hunting for value. But the market crash of 1929 was a turning point. Losing much of his savings, he became obsessed not just with why prices moved, but how they moved.
In 1933, he joined the Wall Street firm Hemphill, Noyes & Co. as a securities analyst. Like most of his peers, he relied on economic data and fundamentals — but he began to notice something that others overlooked: that price itself carried its own logic, its own pattern.
A year later, he captured these early insights in his “Twenty Trading Guides” — a slim set of principles that quietly marked the start of a new way of thinking. They combined Dow Theory’s structure with pragmatic trading wisdom: “Limit losses and ride profits.” “Never add to a losing position.” These were the seeds of systematic thinking — rules distilled from experience, not emotion.
After World War II, his path shifted again. Moving from Wall Street’s calm to the roar of the Chicago Board of Trade, Donchian found himself amid traders shouting bids for corn, wheat, and copper. These weren’t companies with quarterly reports — they were living, breathing markets of supply and demand.
And here, he realized something profound: price itself could be studied, modeled, and followed.
That was the moment of transformation — when a fundamentals-driven analyst became a pioneer of technical, rules-based trading. And from that quiet revolution, the modern scientific approach to trend following was born.
What Exactly Is Trend Following?
Trend following is a rules-based trading or investing strategy that seeks to capture profits from persistent price trends in any asset — up or down.
Rather than predicting where prices will go, it simply reacts to what prices are doing — buying when an uptrend is confirmed, selling or shorting when a downtrend is confirmed, and using strict rules to manage risk and exit. It’s one of the most intuitive and simplest forms of systematic trading — based entirely on price behavior.
From a more technical angle, it’s really about comparing an asset’s current price to its own past prices. That past price could be an average over a few weeks or months, or maybe the highest price in a given period — any historical reference point.
If today’s price is higher than that past benchmark, the asset is said to be in an uptrend. If it’s lower, it’s trending down.
Donchian’s Two Approaches to Identifying Trends
1. The Donchian Channel
This is a breakout indicator that essentially captures a price range: the highest price of the past 20 days and the lowest price of the past 20 days, creating a band or channel. If the price closes above the band, you go long and your stop loss is the lower band, and then go short with the upper band as the stop loss.
2. The Moving Average Crossover
The second approach identifies trends by comparing two averages instead of a current price versus a past reference. For example, in Richard Donchian’s popular crossover strategy, we compare a short-term average — say, the 5-day moving average — with a longer-term one, like the 20-day average.
When the short-term average moves above the long-term, it signals an uptrend; when it dips below, it points to a downtrend.
It’s worth noting that Donchian created these indicators way before computerized charts and data were available, so in a way, it’s very simple in its calculations. Today, we have way better and more robust indicators like Olivier Seban’s SuperTrend, which is a volatility-adjusted trend following indicator, and exponential moving averages, which can be faster in identifying trends compared to simple moving averages that Donchian used.
Irrespective, the key thing here is — we’re not comparing one stock to another, or one asset class to another. We’re only comparing an asset to itself, through time, to understand which direction it’s moving.
Testing Donchian’s Methods on Nifty
Let’s examine how both indicators perform when applied to the Nifty daily timeframe, just the way Donchian did.
Donchian 20-Period on Nifty Daily Chart
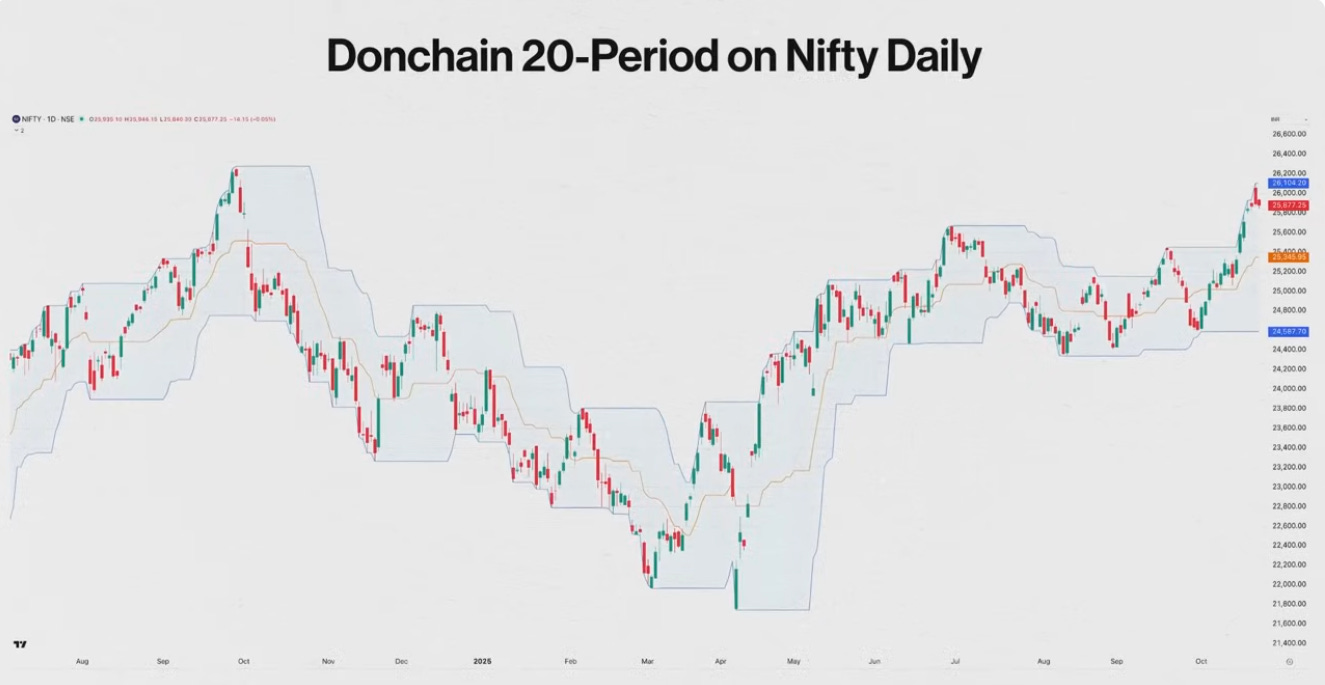
We tested three variants: Long/Short combined, Long only, and Short only.
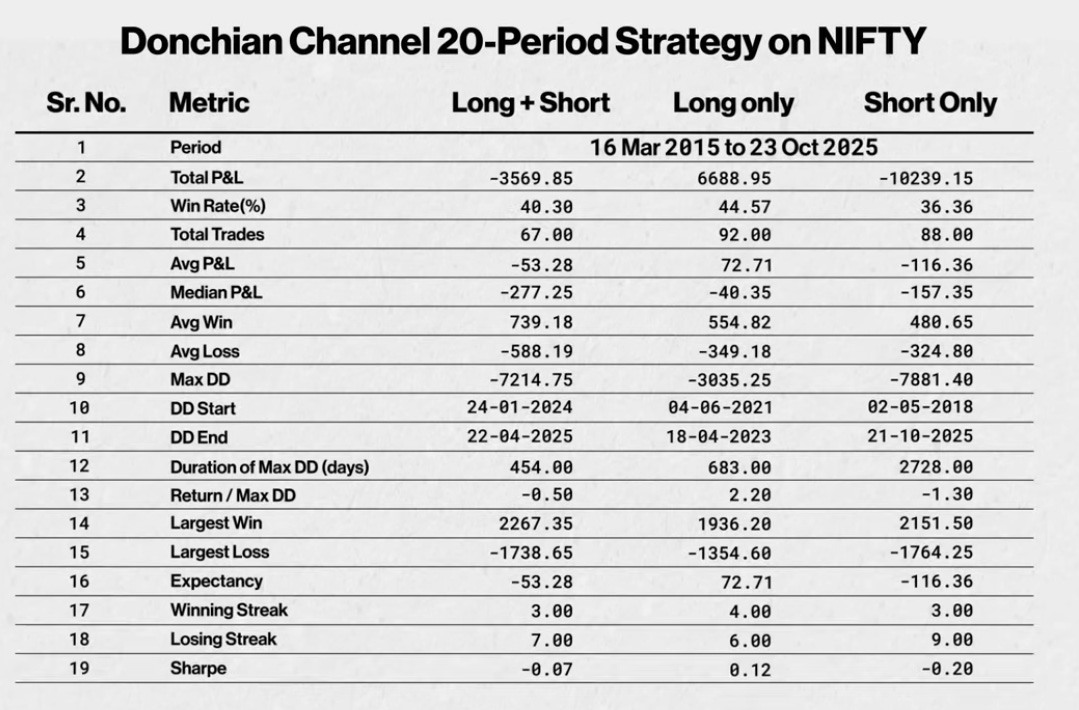
Looking at the results bottom up, the Sharpe ratios for Long & Short combined are just too bad — and we haven’t even included transaction costs or slippages. All show negative median P&L.
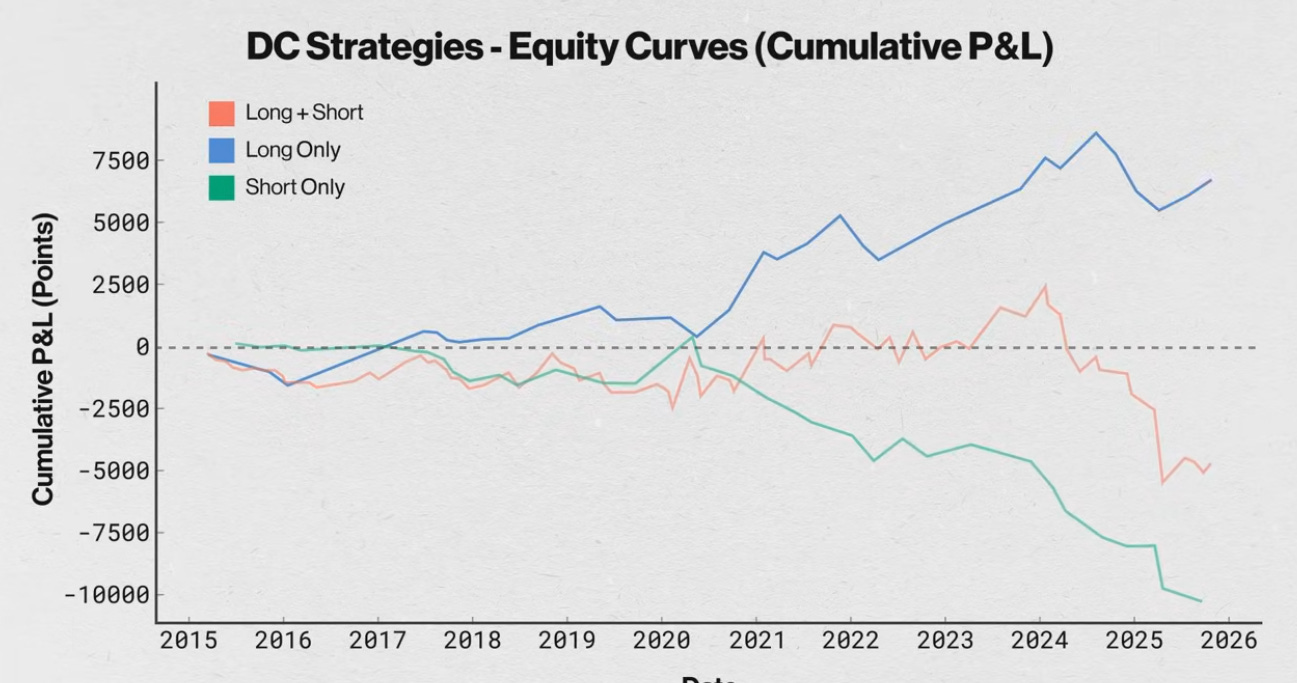
Looking at the equity curves, even the one that worked (the Long Only version) was in a drawdown for 5 years. Now, who would tolerate that? It’s tough. Just to be fair, even the diversified trend following program of the renowned Dunn Capital was in a drawdown for close to 4.5 years between 2003 and 2007. Such extended periods of drawdowns are common among trend following programs. It’s okay at a fund level, but it’s tough to manage that at an individual level.
So yes, Donchian 20 on a daily timeframe on Nifty fails badly.
5×20 SMA Cross on Daily Nifty
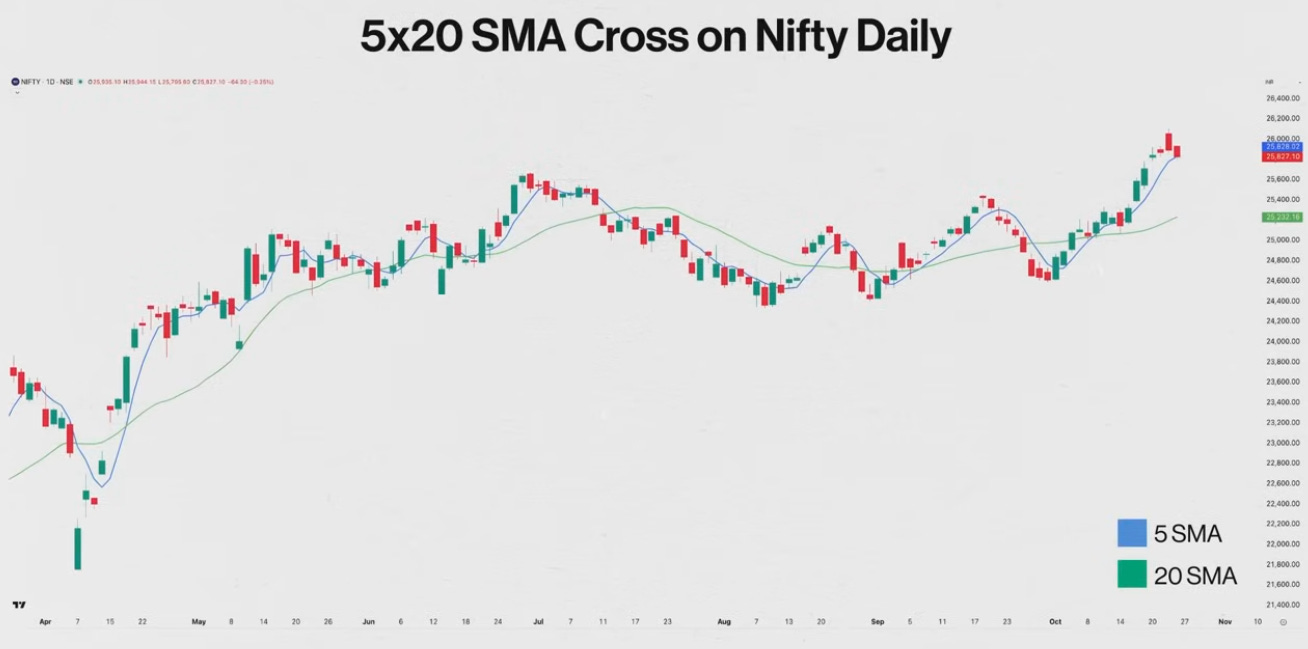
Moving to the 5×20 SMA Cross on Daily on Nifty, another of Donchian’s strategies:
- Blue line = 5 SMA
- Green line = 20 SMA
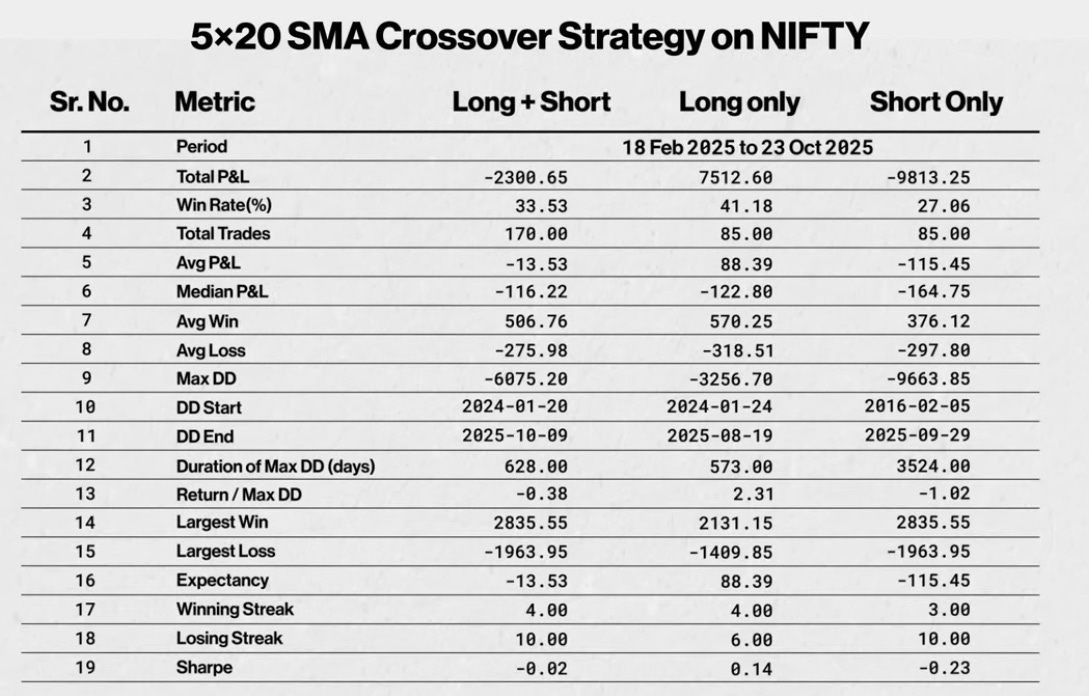
Again, if we compare to the previous Donchian 20 backtest, this is a shade better but still not tradable. Median P&L is all negative again. Just 7,500 points in 10 years in a long-only model? No way, that’s bad.
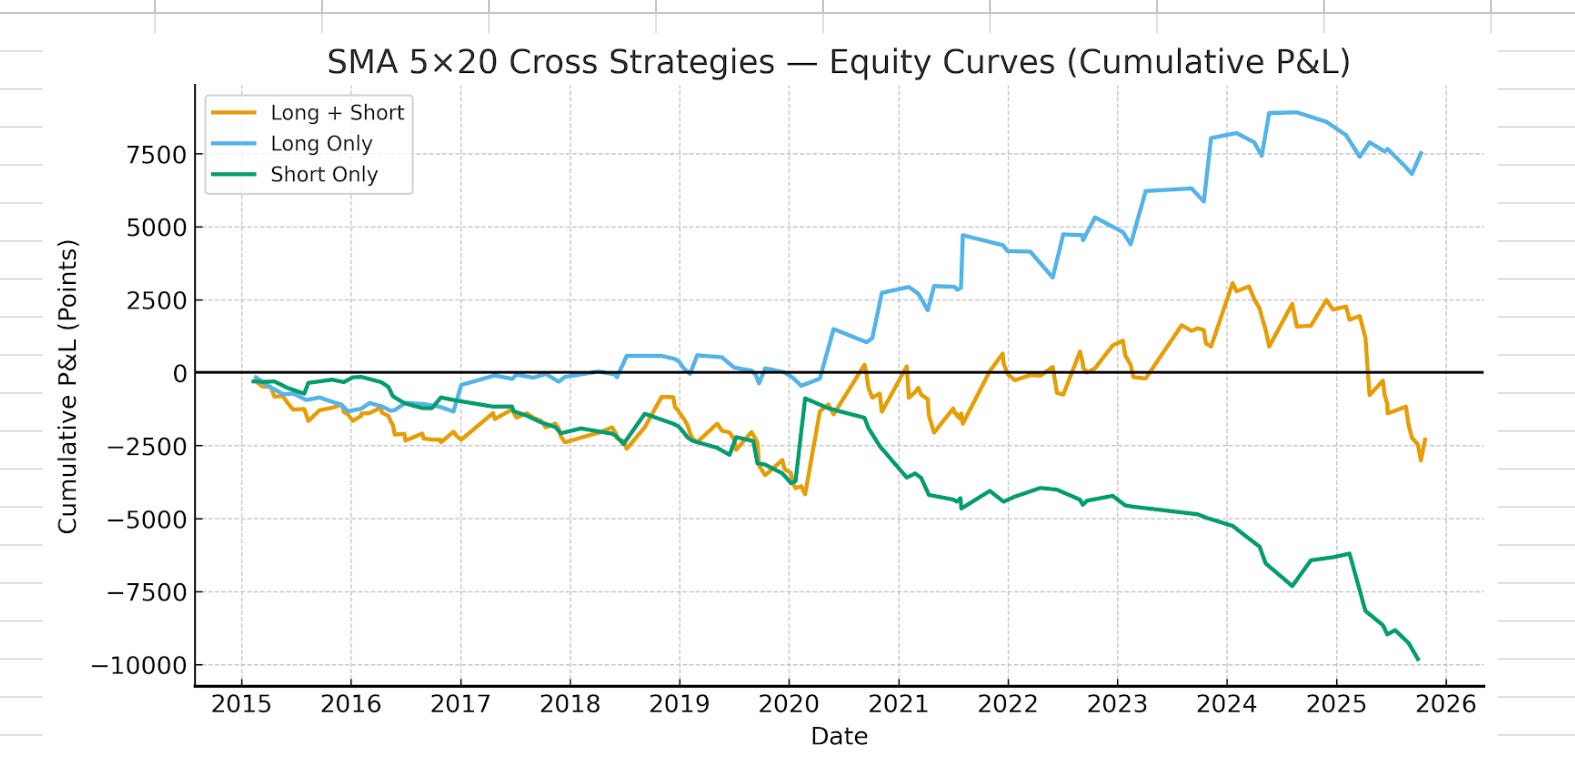
Looking at the equity curve, the system (especially Long only) seems to have picked up post-2020. All in all, the EMA cross is just a shade better than the Donchian breakout system. In totality, both are to be dumped.
Key Takeaways from the Backtests
One: There are broadly two ways to identify a trend — one uses a breakout metric, and the other relies on moving averages.
Two: Depending on the instrument or stock, one approach may work better than the other.
Three: Depending on how trends emerge in an asset, sometimes breakout indicators enter a trend earlier than moving-average systems, because crossovers take time for two averages to align. Sometimes it’s the other way round.
Four: The timeframe matters a lot. Some instruments trend better on daily charts, while others show stronger patterns on lower timeframes — say, a 4-hour bar chart or even 1-hour timeframes.
Five: It’s rarely a good idea to use indicators blindly with their default parameters. Donchian may have chosen a 20-period lookback for a reason back then, but that doesn’t mean it’s ideal for every market today.
In short, the parameters and timeframes shown in the backtest may not be perfect for the Nifty. Every asset has its own personality — some trend cleanly, others move in choppy cycles, and even strong trends can vary in pattern and structure.
Making Trend Following More Robust
To make a trend-following system more robust, you can experiment with different parameters and variations. For example:
- Trade in only one direction — long-only or short-only
- Use a single moving average instead of a crossover
- Try an exponential moving average to emphasize recent prices
- Replace moving averages altogether with a different trend tool, like SuperTrend
- Or even combine multiple timeframes — trade on hourly charts, but confirm signals using the daily trend
The combinations are endless. I’ll cover many of these variations — and some more advanced ideas — in future episodes. But for now, remember this: Trend following is simple in concept, but not one-size-fits-all. Each market, stock or index needs its own parameters and tweaks.
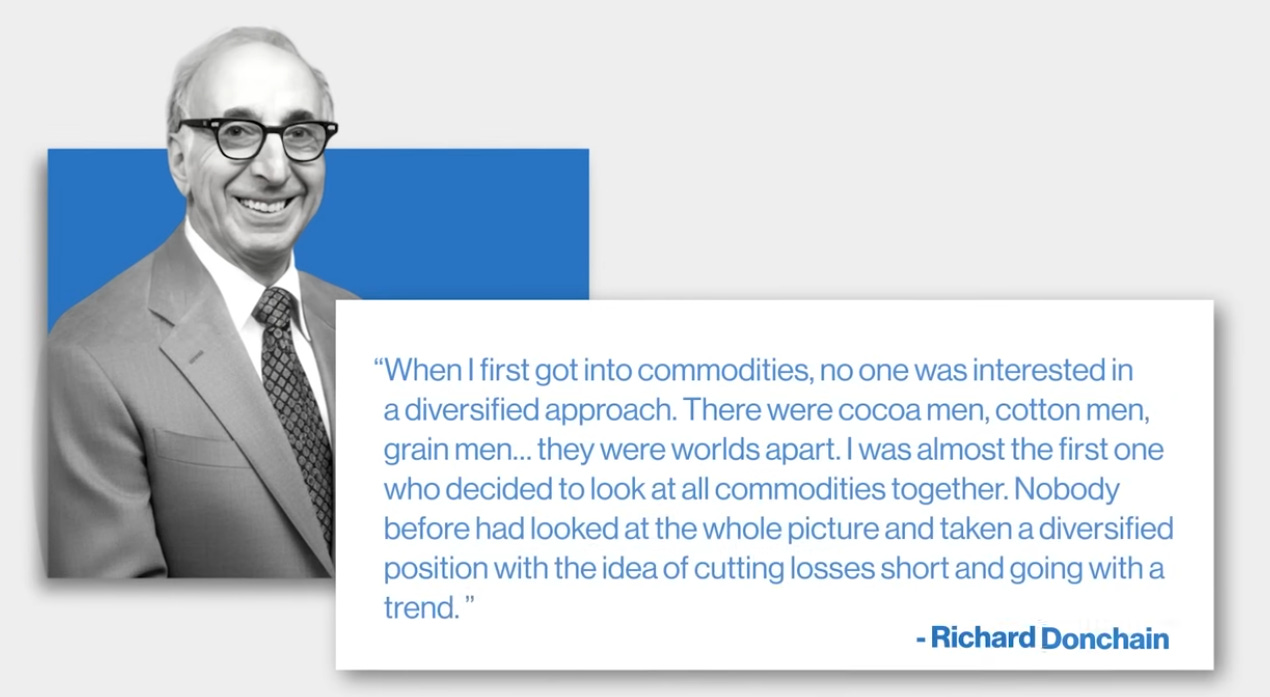
Diversification: Donchian’s Next Big Idea
When Donchian moved from Wall Street to the Chicago Board of Trade after World War II, he entered a completely different world — the world of commodities.
Here, instead of analyzing one company or one sector, he saw dozens of independent markets — corn, wheat, copper, sugar, cotton — each moving for entirely different reasons.
He noticed something subtle but powerful: When weather affected crop prices, metals barely moved. When industrial demand pushed copper prices up, wheat might fall. When bond prices rose, commodities often cooled off.
This gave him an intuitive grasp of uncorrelated behavior — long before the word “correlation” became a staple of finance.
In his own words (as quoted in Commodities Magazine , 1980):
The Birth of Managed Futures
By the mid-1940s, Richard Donchian had already made the intellectual leap — from studying companies to studying price behavior. Now came the bold step — turning that idea into a business model.
In 1948, Donchian founded Futures Inc. , the world’s first managed futures fund — a simple name for what was, at the time, a radical concept.
He invited investors to pool their capital, and instead of buying stocks or bonds, he traded futures contracts across multiple commodities — corn, wheat, cotton, copper — all through a single, systematic approach.
This was the birth of diversified, rules-based investing. Each trade followed a clear principle: cut losses quickly, let profits run, and never let emotion interfere.
It may sound obvious today, but back then, the idea of using structured rules to manage money — across dozens of volatile markets — was revolutionary.
That insight — the idea of diversification across uncorrelated assets — became the cornerstone of what we now call managed futures.
Can We Follow a Managed Futures Approach in India?
In the U.S., Managed Futures is a fund category — or a strategy — that trades multiple futures-based assets, both long and short.
For instance, a trend-following Managed Futures fund might hold positions in commodities, equities, currencies, and interest-rate futures — all traded simultaneously, each based on its own individual trend.
In India, however, we face a few structural challenges. For starters, we simply don’t have the same breadth of liquid futures products across asset classes. Currency and interest-rate derivatives are mostly unavailable, leaving us with just a handful of equity indices and a few commodities to work with.
Then there’s also this institutional gap. In the U.S., UK, and Europe, these strategies are managed by CTAs — Commodity Trading Advisors or similar structures authorized to manage money through futures and derivatives. There’s also a Société Générale CTA Trend Index that tracks the top 10 trend-following funds. In total, the approximate AUM of these trend programs could be close to $100 billion — this is just a ballpark figure.
In India, while technically Alternative Investment Funds (AIFs) can do something similar, the leverage restrictions, tax inefficiencies, and other restrictions on investing in derivatives outside of India make the structure impractical for true Managed Futures-style investing.
The DIY Opportunity
But as I have said in the past, at an individual level, you could build something similar if you’re a DIY trader. But realistically, it would still be a far cry from what institutional CTAs do in the U.S. or elsewhere.
That said, since I am a glass-half-full kind of person, I would ask: Are we even making full use of what’s already available here?
I’ll leave you with that thought.
What’s Next
In the upcoming episodes, I’ll dive deeper into the different nuances of trend-following — exploring what works, what doesn’t, and how you can adapt these ideas to the Indian markets.
If you have any questions, drop them in the comments — I’ll do my best to answer them.
Till then — trade safe, and stay curious.