Welcome back to The Long and The Short—where you get an honest take on trading, something you won’t hear elsewhere.
I’m Sandeep Rao, and in the last episode, we broke down what trend following really is—and how Richard Donchian, often called the father of trend following, helped shape systematic trend following as we know it today. We even tested some of his ideas right here on Nifty.
Today, we’re taking that a step further.

I’ll walk you through how to build a simple trend-following system that actually works, and to do that, we’ll focus on two key concepts:
- Timeframe
- Trend Identification
Timeframes refer to the price intervals you trade, and trend identification approaches involve methods and indicators used to identify a trend within a given timeframe. All of this, once again, using Nifty as our playground.
Alright then—let’s dive in!
A Side Story from Astrophysics
Like I always do, a bit of a side story from the world of astrophysics. Incidentally, I’m reading the book “Astrophysics for People in a Hurry” by Neil deGrasse Tyson, and in it he describes how supernova explosions happen.
Most stars spend their whole lives just burning quietly, like a candle that never goes out. Inside them, tiny atoms crash together and make light, and that’s what keeps them shining for millions, even billions of years. That’s what the Sun is doing right now—just glowing steadily, a slow and steady burn of sorts, while keeping everything on Earth alive.
But some stars are much, much bigger than our Sun—so big that they live fast and burn out young.
When these giant stars run out of fuel, something amazing happens. These stars can no longer hold themselves, and they collapse, exploding into what scientists call a supernova . It’s like a massive boom!
That explosion, to me, feels a lot like a breakout —sudden, powerful, and impossible to ignore. The steady burn that happens before the supernova? Well, that’s like a moving average —slow, persistent, quietly building momentum.
Two Ways to Catch a Trend
Market trends work the same way. There’s a long stretch of gradual progress, then boom—a breakout. That gives us two ways to catch a trend.
If you want to ride the slow buildup, moving averages are your friends. If you’d rather wait for the big moment, that’s where breakout tools like the Supertrend come in.
Of course, there are many ways to capture breakouts—any channel or range-based indicator will do. I just prefer Supertrend because it reacts faster than most and catches the move early.
Even if you look at the research and literature around trend following, almost all of it comes back to these two fundamental methods.
Take the book “Following the Trend” by Andreas Clenow—I’d call it the manual of systematic trend following. He dedicates an entire chapter to comparing exactly these two approaches: breakouts and moving averages.
Similarly, Ken Tropin’s Graham Capital, one of the world’s leading CTA firms, has published several insightful papers exploring how professional managers identify and capture trends. And again, their work highlights these same two pillars—the steady, signal-driven momentum captured by moving averages, and the explosive, threshold-based shifts marked by breakouts.
So in a way, I’m not reinventing the wheel here.
These methods are foundational to trend following—time-tested, data-driven, and battle-proven across decades of market cycles. That’s why we choose them.
Do Timeframes Really Matter?
That brings us to the next—and perhaps the most important—question: do timeframes of analysis really matter?
By timeframes, I mean daily, 4-hour, or even 1-hour bars. Some people call them time intervals or data intervals—but they all refer to the same thing: the frequency at which you look at market data.
Now, in most books on trend following, timeframe selection is treated as a matter of personal preference—something you pick for convenience, not as a parameter that can truly change outcomes.
But I’ve always found that approach unsatisfying.
Except for one book—“Technical Analysis Using Multiple Timeframes” by Brian Shannon. It also barely scratches the surface, but it plants an important idea: the power of looking at markets through multiple timeframes. Shannon talks about aligning higher and lower timeframes so that your trades move with the broader tide, not against it.
Later, while reading the book “Inside the Black Box” by Rishi Narang, that concept really clicked. He makes a simple but profound point—what looks like a trend on one timeframe might appear completely mean-reverting on another .
That’s when it hit me: timeframes aren’t just about convenience—they define perspective .
So when we build or test a trading system, it’s not enough to pick one timeframe and run with it. We need to test a system across timeframes, compare outcomes, and understand where the edge truly lies.
Later, when I present the data for three different timeframes—daily, 4-hour, and 1-hour—you will notice the difference for yourself.
Building Blocks of a Trend-Following Strategy
So we’ve spoken about two fundamental building blocks of creating a trend-following strategy: the trend identification method and the timeframe of analysis .
Now let’s get to the interesting parts—the backtests.
Disclaimer: This is not a recommendation to trade any of the backtests or simulations that I share. These examples use spot prices and are discussed only for illustrative purposes.
Over to the backtests.
The Backtest Setup
The instrument or index I am testing is Nifty Spot . I will be testing all of this on three different timeframes: Daily, 4-Hour, and 1-Hour bars .
Across these timeframes, we will apply EMAs and Supertrend to separately compare their performance. The data here is from January 2015 to October 2025 .
Let me give you a quick example of how these strategies are defined.
EMA Strategy
For the EMA, we go long when the price closes above the EMA and continue holding the position as long as the price stays above it. We go short when the price closes below the EMA—this setup is known as an SAR, or Stop and Reverse system .
That means the exit for a long trade is also the entry for a short, and vice versa—the system is always in the market, switching direction whenever the signal flips.
Supertrend Strategy
With Supertrend, the logic is similar—only the reference point changes. Instead of the EMA line, we use the Supertrend bands. If the price closes above the upper band, we go long. If it closes below the lower band, we go short.
We will use a similar logic across timeframes, though the lookback period of the EMA would change.
Daily Timeframe: Supertrend Takes the Lead
Let’s start with the Daily timeframe .

For daily bars, I use an 8-period EMA , and in Supertrend, I use the default 10,3 parameter . Since Supertrend is a volatility-based indicator, the lookback input in it need not match the EMA lookback, hence I use the default 10,3 across for this illustration.
In general, the 8-Period EMA on Daily does a pretty bad job compared to the 10,3 Supertrend.
Of course, by now, if you have been watching the episodes of The Long and the Short, you would know it makes little sense to look at the short side, especially on daily timeframes.
Long Only Comparison
So let’s compare just the Long-only parts.
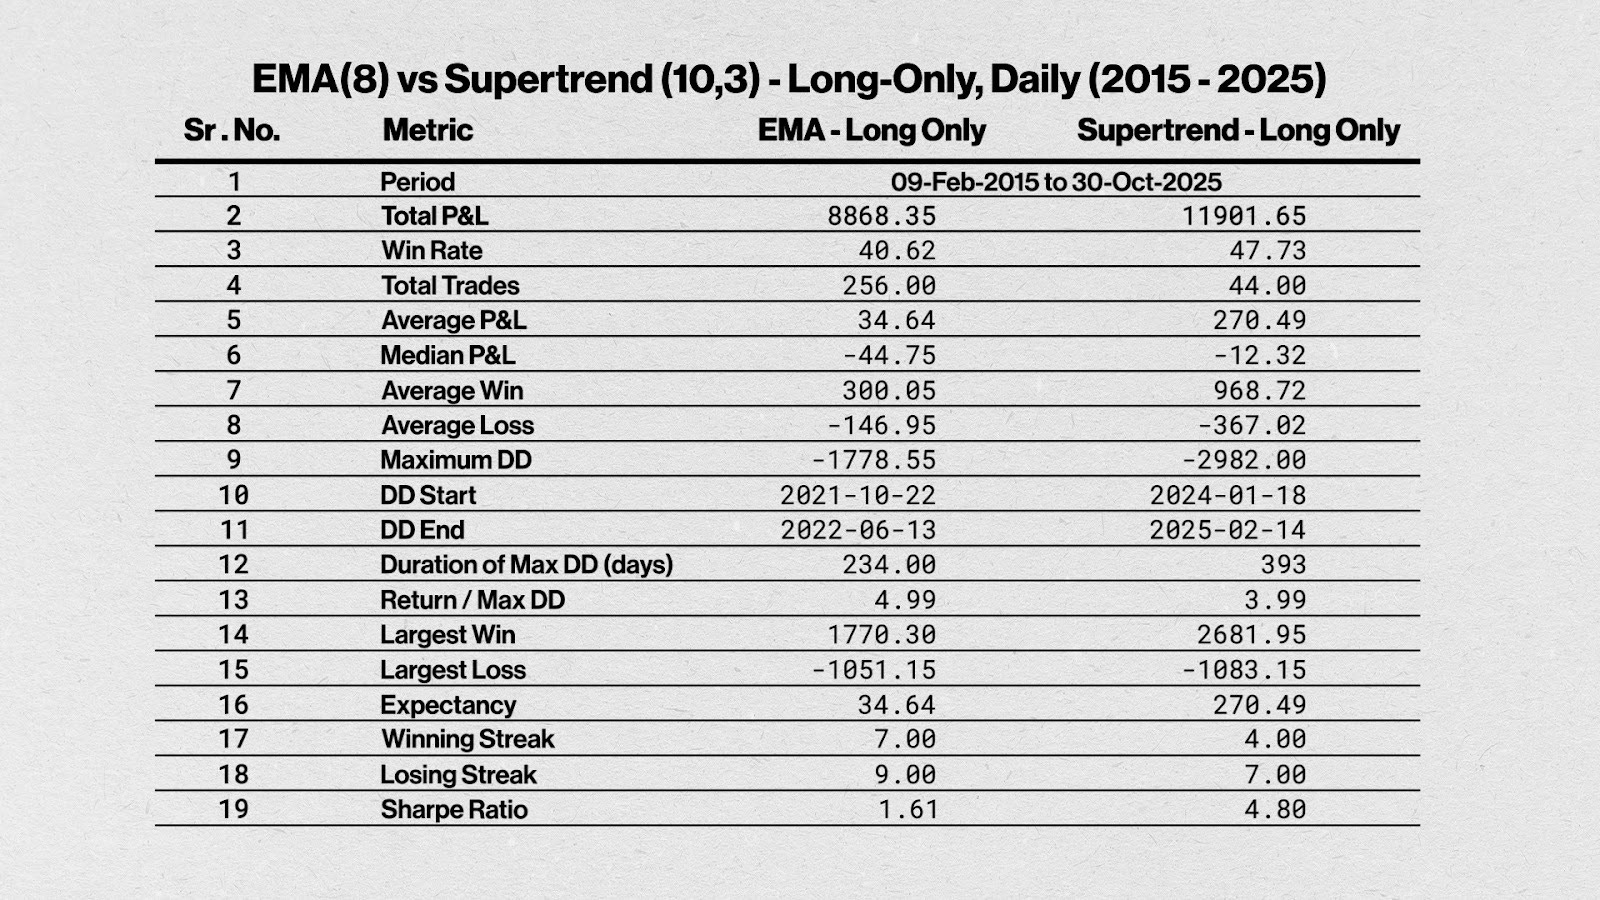
Look at the table from the top. Total P&L speaks for itself, and now look at the Average P&L —that’s 35 vs. 270, that is a massive difference. What that means is on average per trade, the EMA system makes just 35 points whereas the Supertrend-based system makes 270 points.
This happens because EMA takes a lot of trades—256 vs. 44—and that many trades is not always a good idea, as the system keeps chopping around a lot.
The only thing good about the EMA system is the Return to Max Drawdown ratio .
So it’s quite evident that Supertrend is outperforming on almost all parameters on a daily timeframe . But what could be the reason for such outperformance?
Why Supertrend Outperforms on Daily
I think it’s because Supertrend adapts to volatility rather than reacting to every price fluctuation like the EMA does.
Since it uses the Average True Range (ATR) to set its bands, the Supertrend naturally widens during volatile phases and tightens when markets are calm, allowing it to filter out noise and capture only sustained directional moves.
On an index like NIFTY, which has a strong long-term upward bias, this volatility-adjusted approach keeps the system invested during large trending phases and avoids frequent whipsaws seen in faster indicators.
In essence, Supertrend’s strength lies in its built-in noise filter —its ability to stay committed to a direction until a genuine reversal occurs—resulting in longer profitable holds, higher average trade returns, and overall better risk-adjusted performance, but with a higher max drawdown.
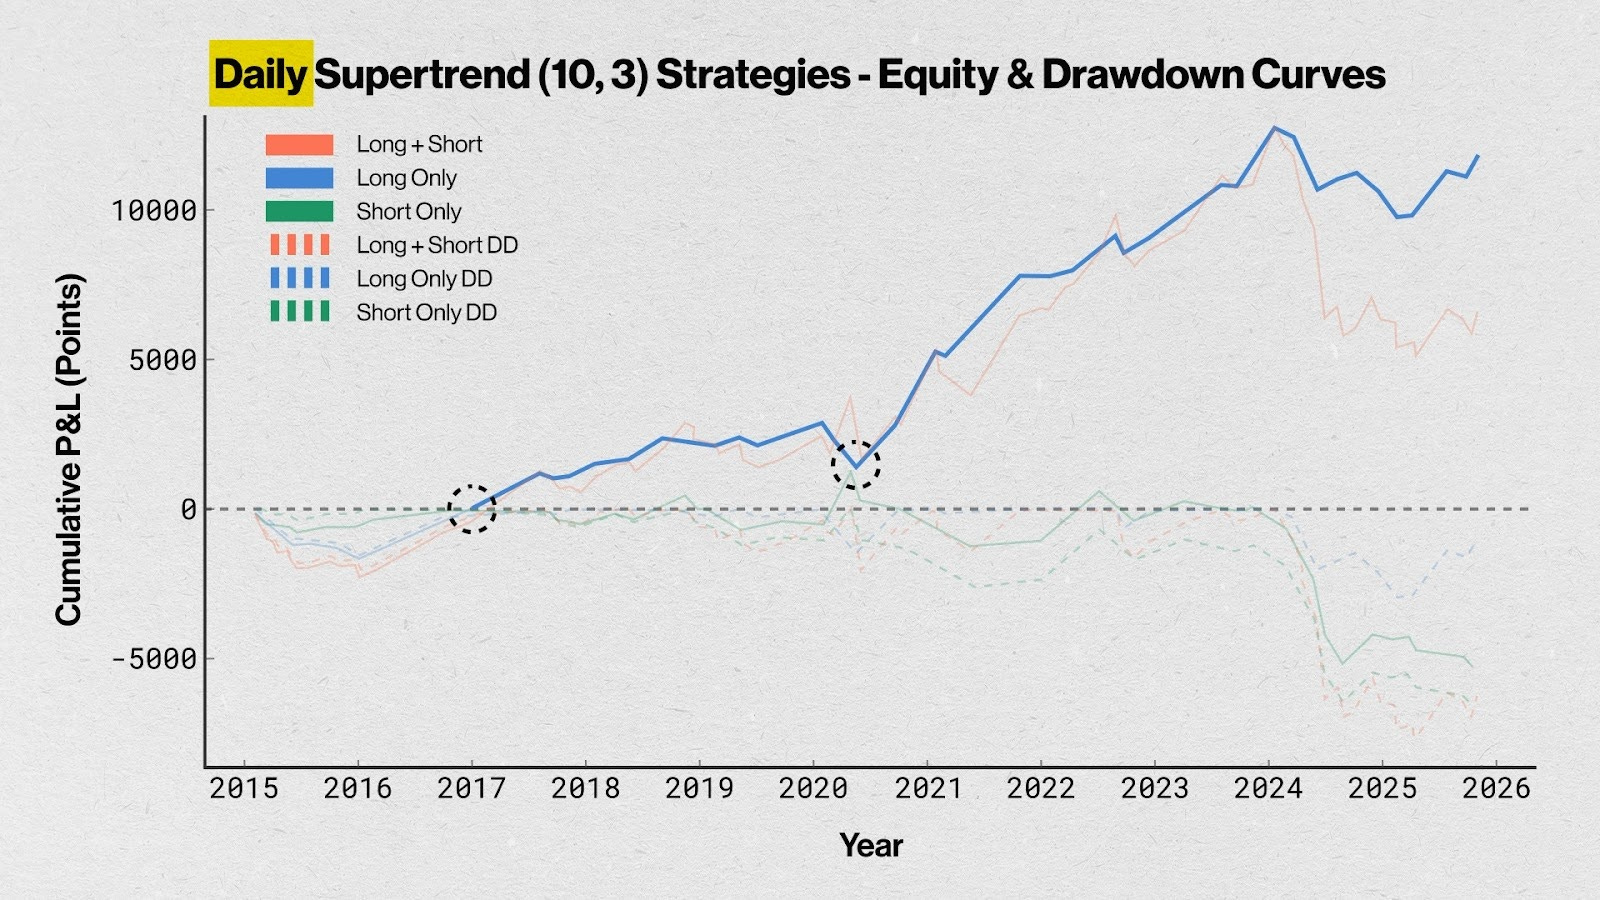
Equity Curves Tell the Story
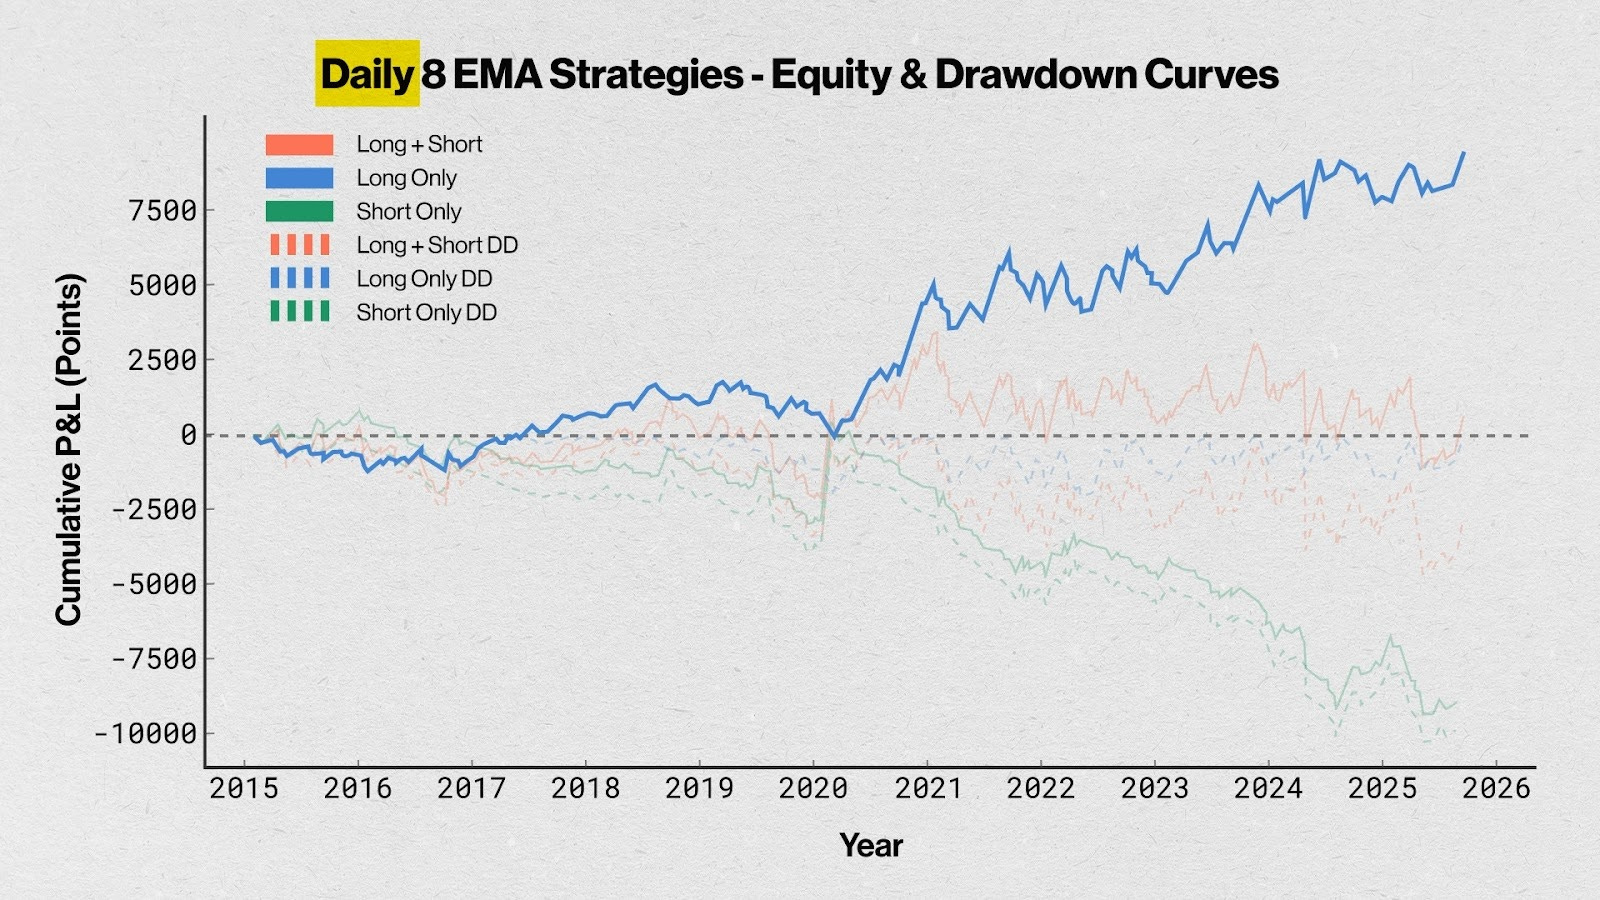
If you look at the equity curve of both EMA and Supertrend, it becomes quite clear. The blue line trending up represents Long Only on Daily. Almost no action till 2020, and then it picks up.
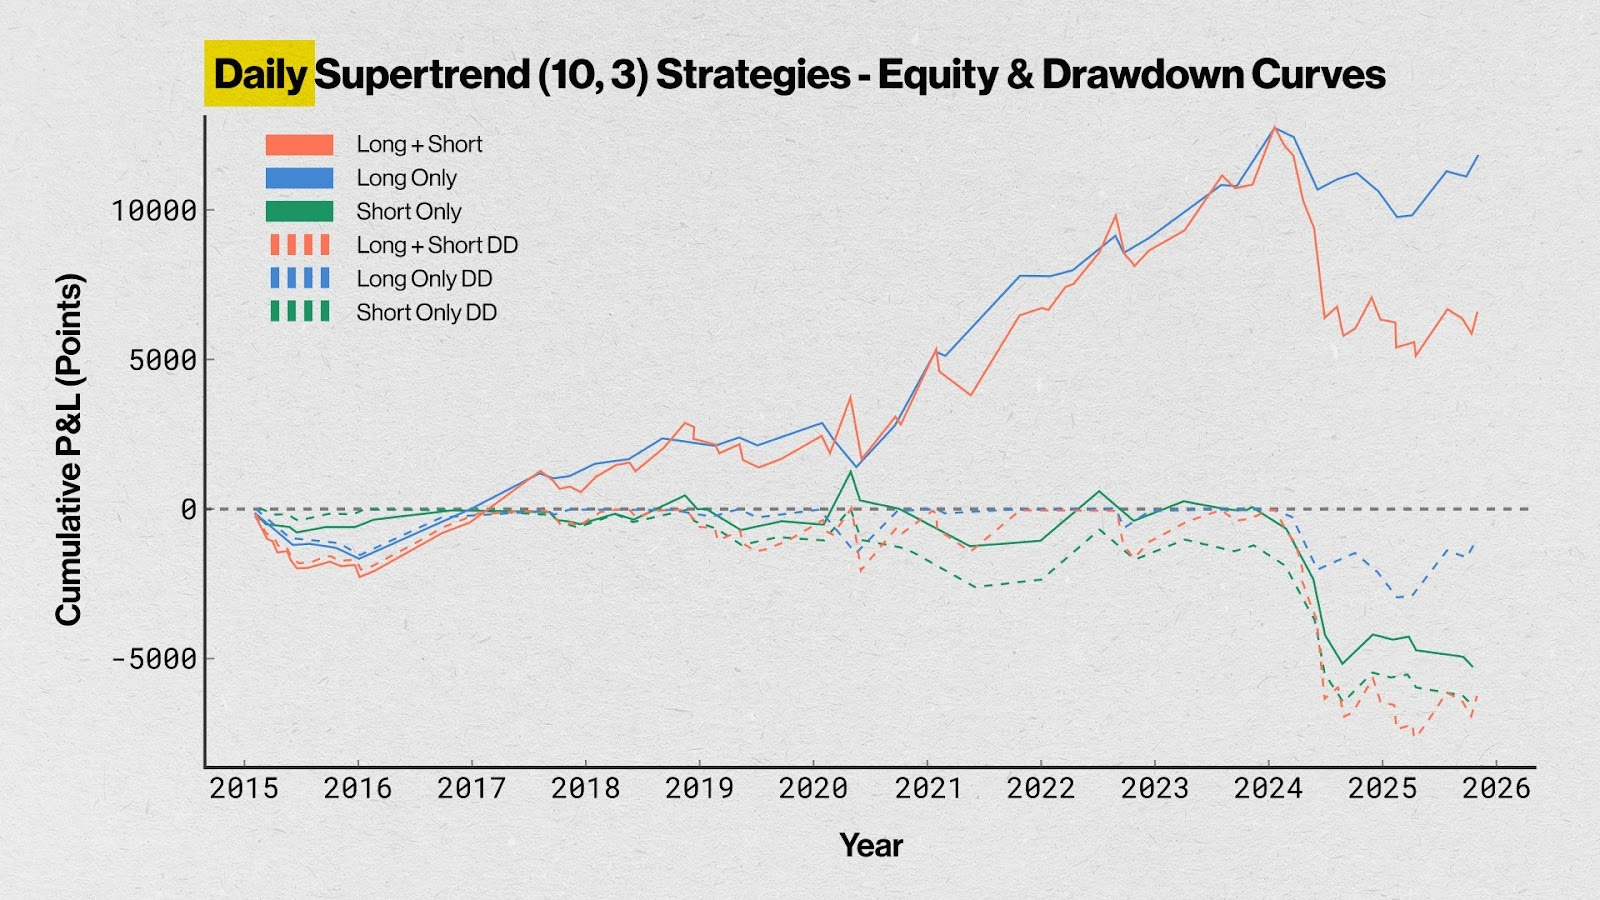
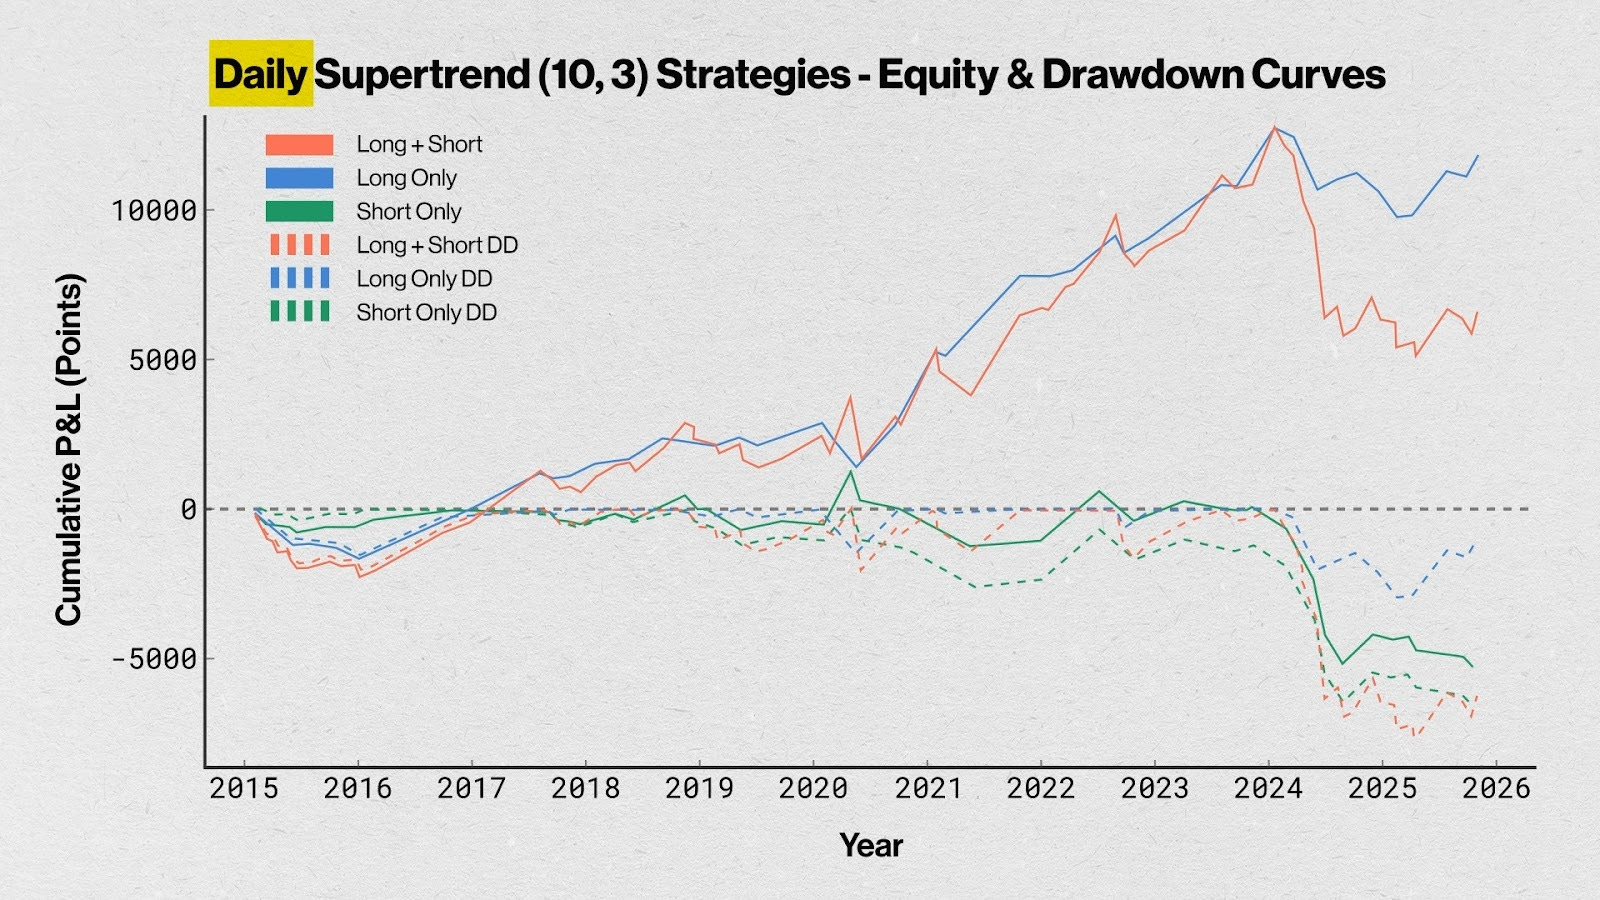
Compare this with the equity curve of Supertrend on Daily. Looks smooth, isn’t it? More importantly, it picked the trend much earlier, from 2017 onwards, with a minor dip in 2020.
So all in all, on a daily timeframe, Supertrend wins on consistency and risk-adjusted performance, while EMA wins a bit on speed and efficiency, nothing much otherwise.
So all in all, on a daily timeframe, Supertrend wins on consistency and risk-adjusted performance, while EMA wins a bit on speed and efficiency—nothing much otherwise.
4-Hour Timeframe: The Gap Narrows
With the daily timeframe done, let’s now go one level deeper—the 4-hour timeframe .
Here, the lookback period for the EMA is set to 21 —why 21? Because it maps to the same 1.5-week duration, similar to an 8-period lookback on daily—and the Supertrend parameters remain the same at 10,3.
Long Side Analysis
Let’s start with the tables again. Here, I want you to see both the Long and the Short direction trades.
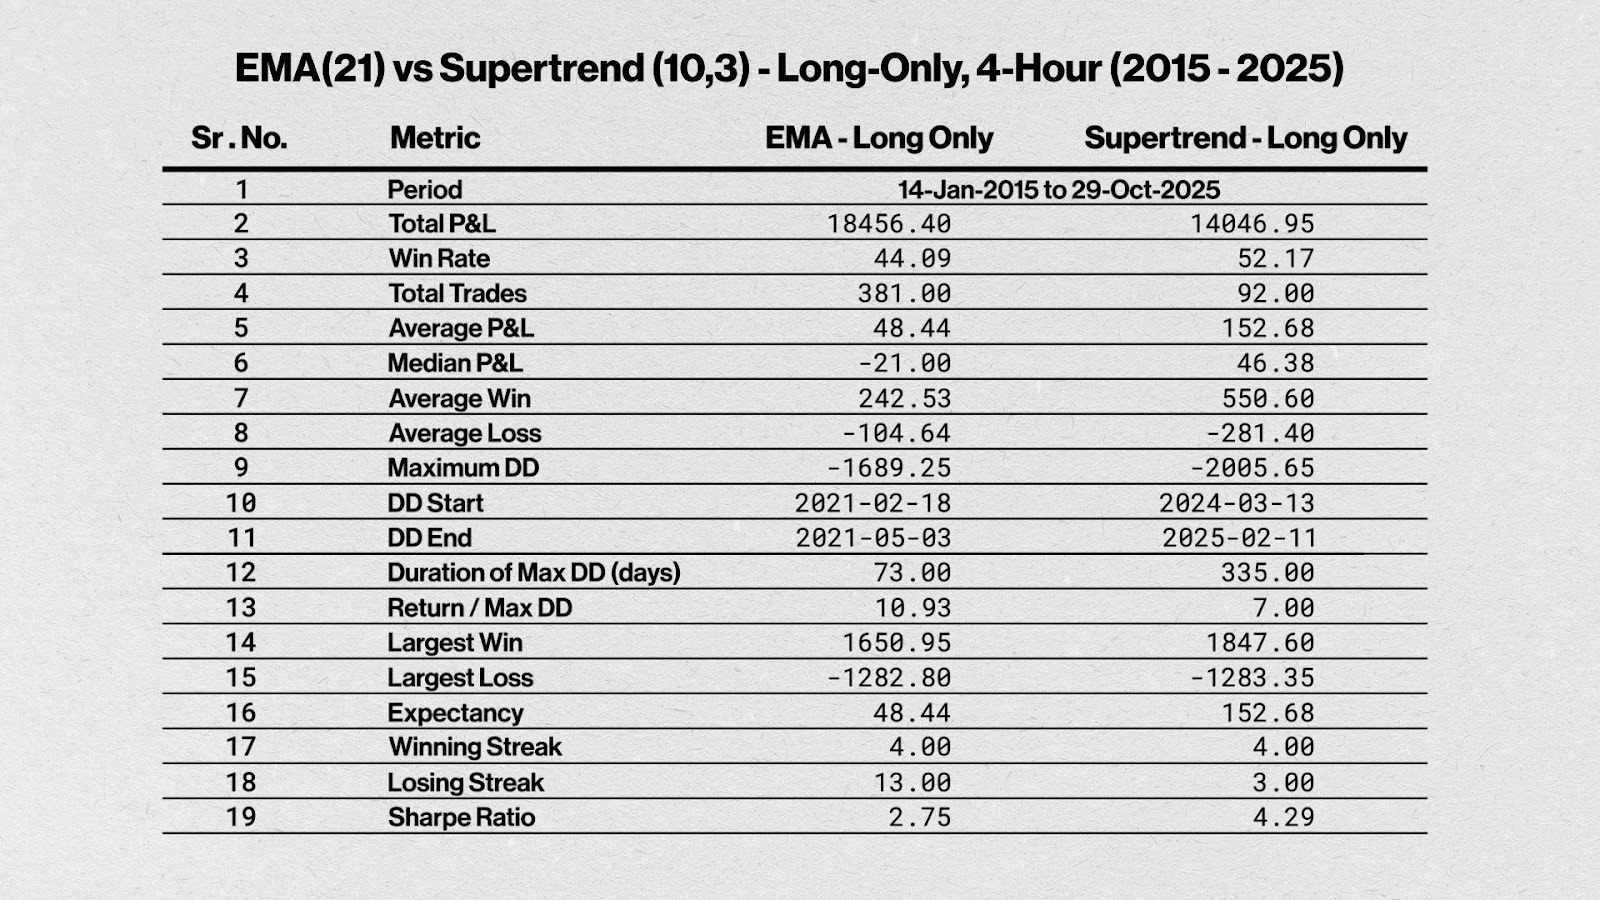
On the 4-hour chart, the absolute P&L for Longs may appear higher at first glance. But what truly matters is the average P&L per trade : 48 for EMA vs. 153 for Supertrend.
This is where Supertrend clearly leads—mainly because it generates fewer trades. On the long side alone, EMA triggers nearly four times as many trades as Supertrend. Once you factor in transaction costs, most of EMA’s apparent edge may disappear.
Short Side Turns Profitable
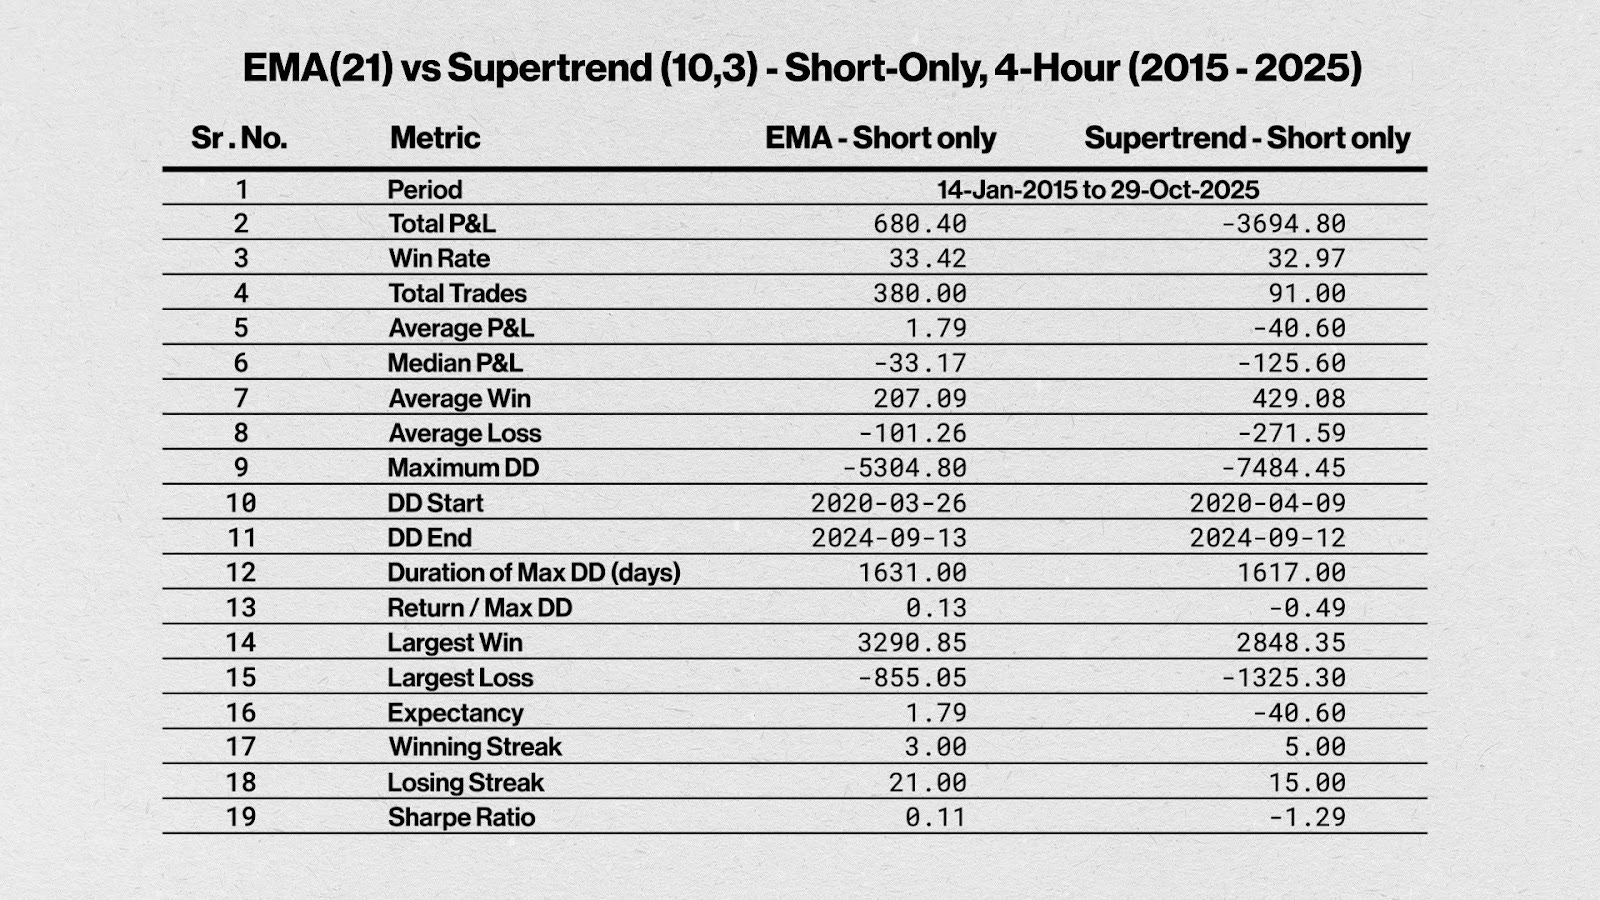
Interestingly, as we shift to this lower timeframe, the short side starts turning profitable , particularly for EMA. While the short trades on Supertrend are in negative of close to 4,000 points, EMA-based shorts are slightly positive at 700 points.
That’s because EMAs react faster , and in Nifty, short trends tend to be sharp and swift, giving EMAs a natural advantage there.
Drawdown Analysis
When it comes to drawdowns, Supertrend still shows a higher maximum drawdown than EMA—but the gap between the two narrows significantly. On the daily chart, Supertrend’s drawdown was about 70% higher, whereas on the 4-hour chart, it’s only around 20% higher compared to EMA.
Also note how the total points captured increase as we move to a more granular timeframe—a sign that shorter intervals can pick up more market movement, though often at the cost of higher trade frequency.
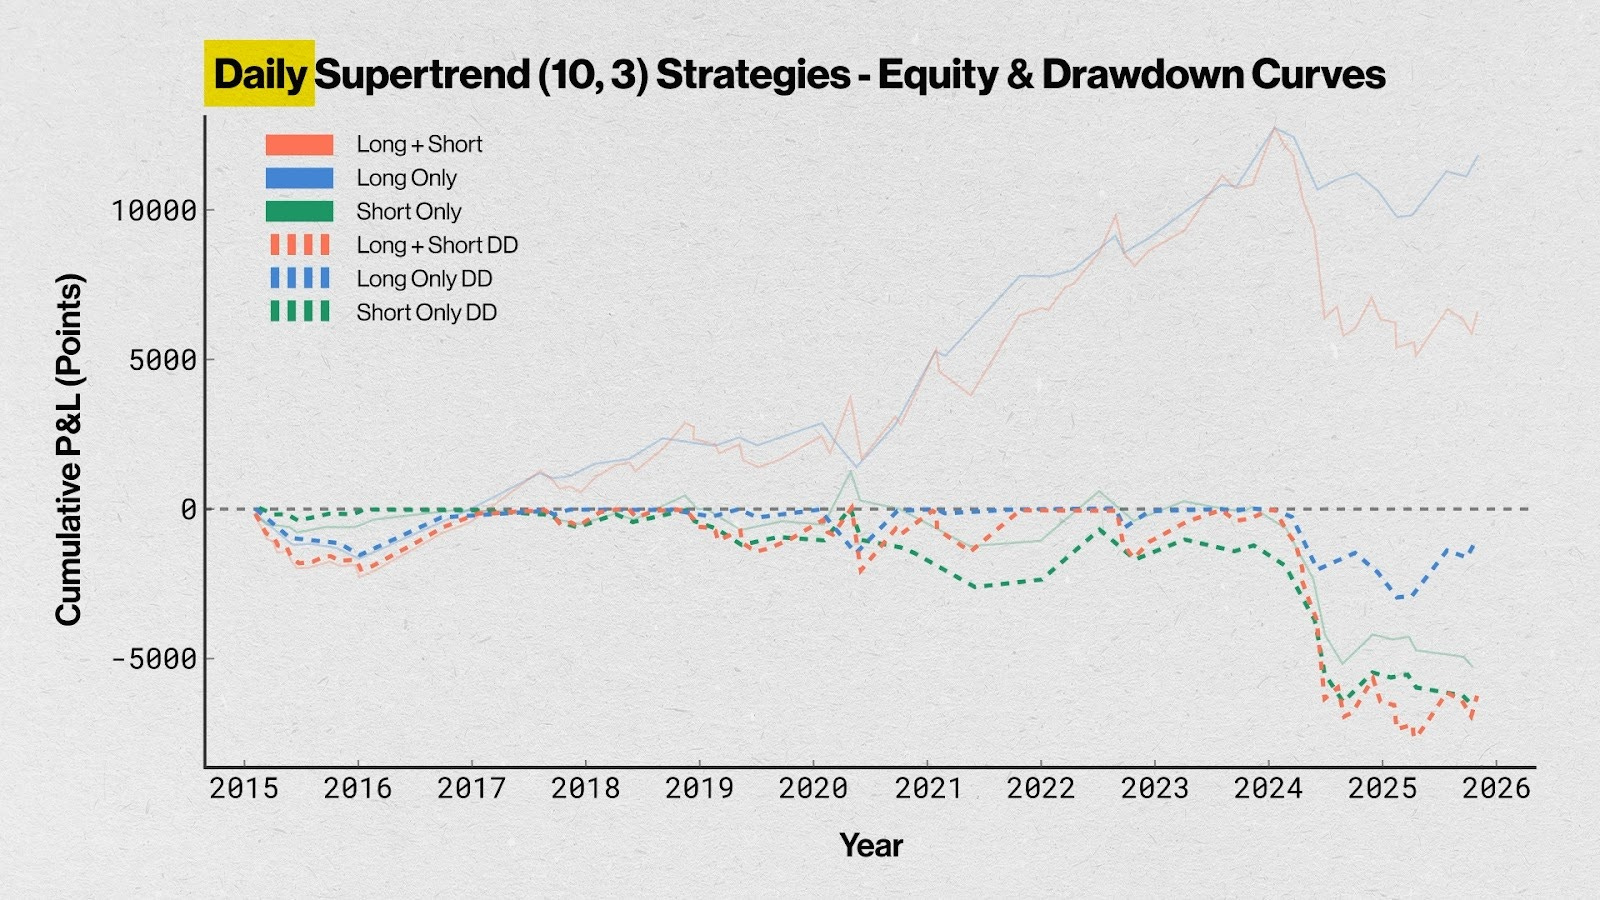
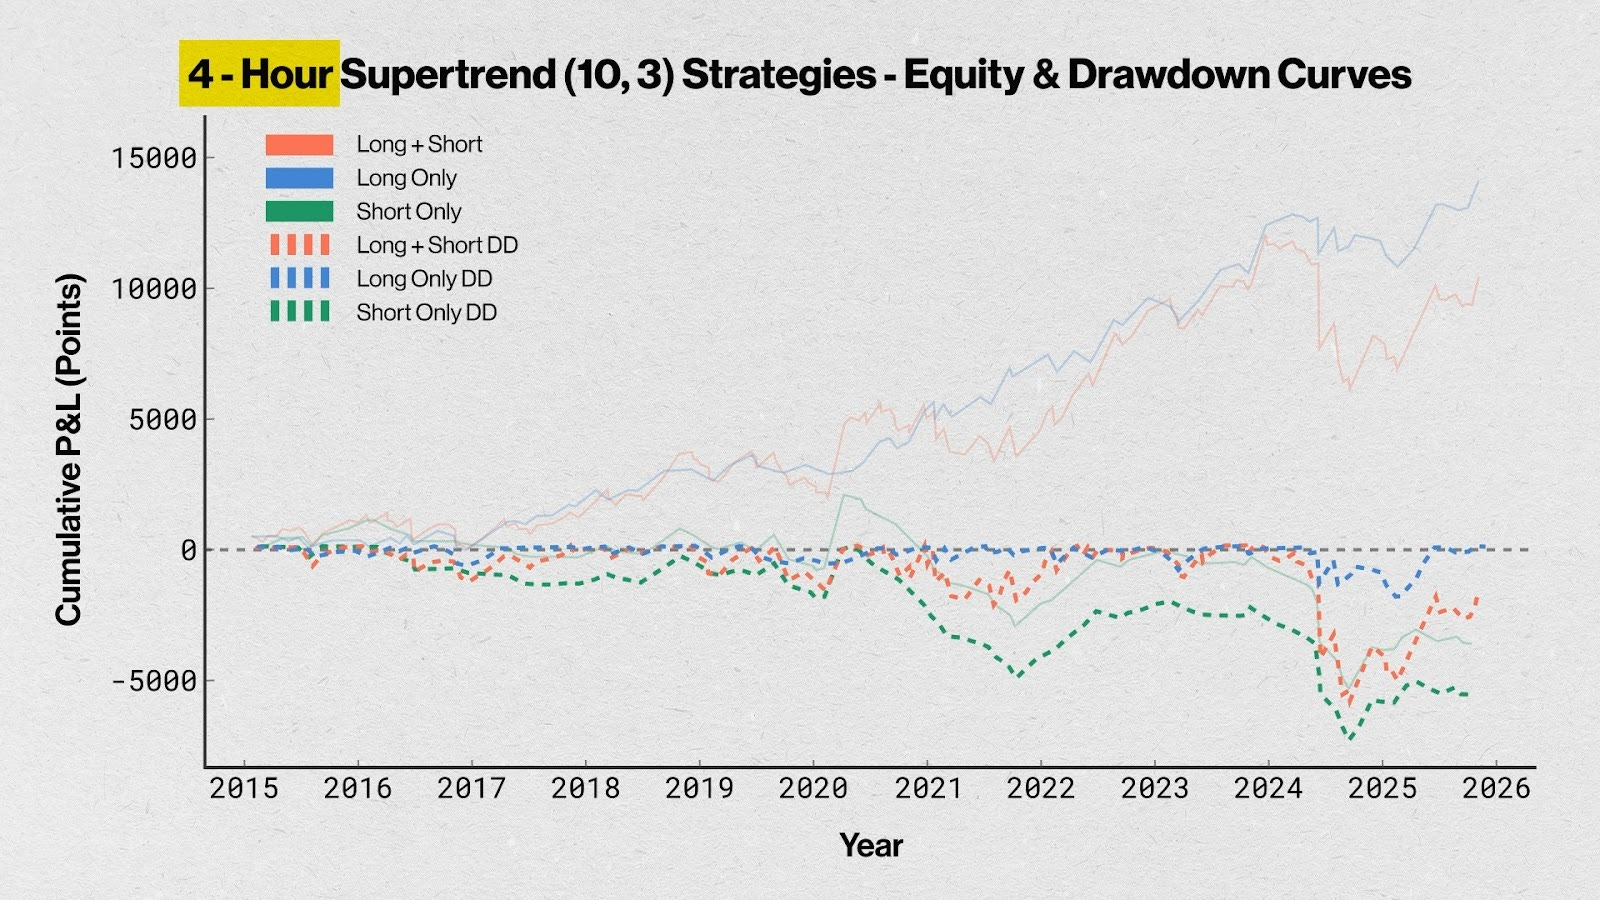
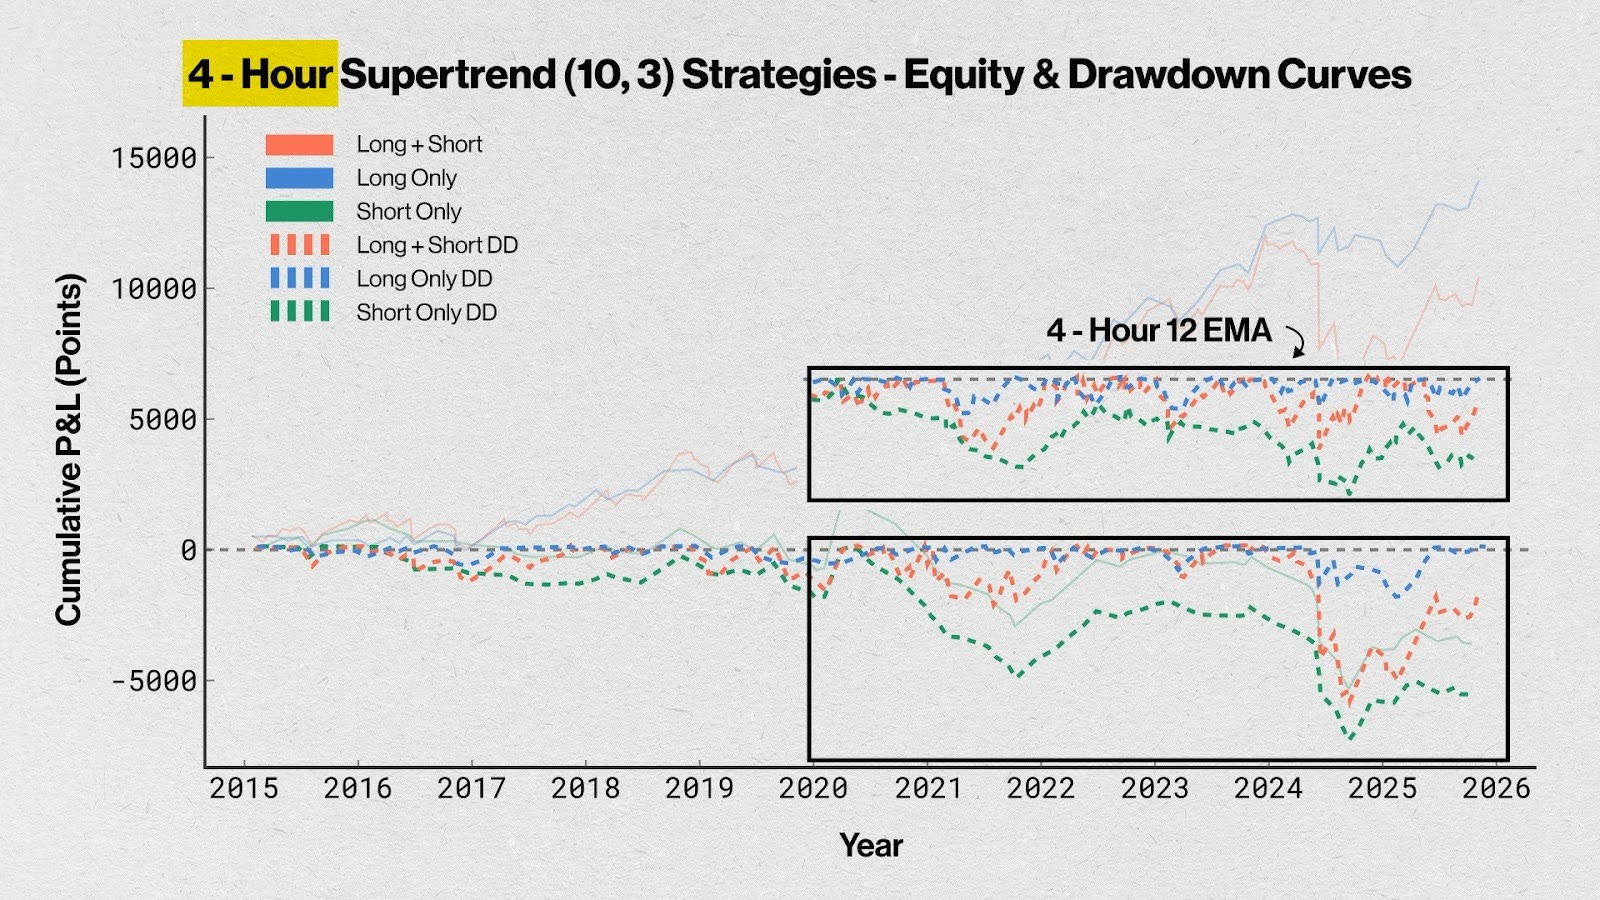
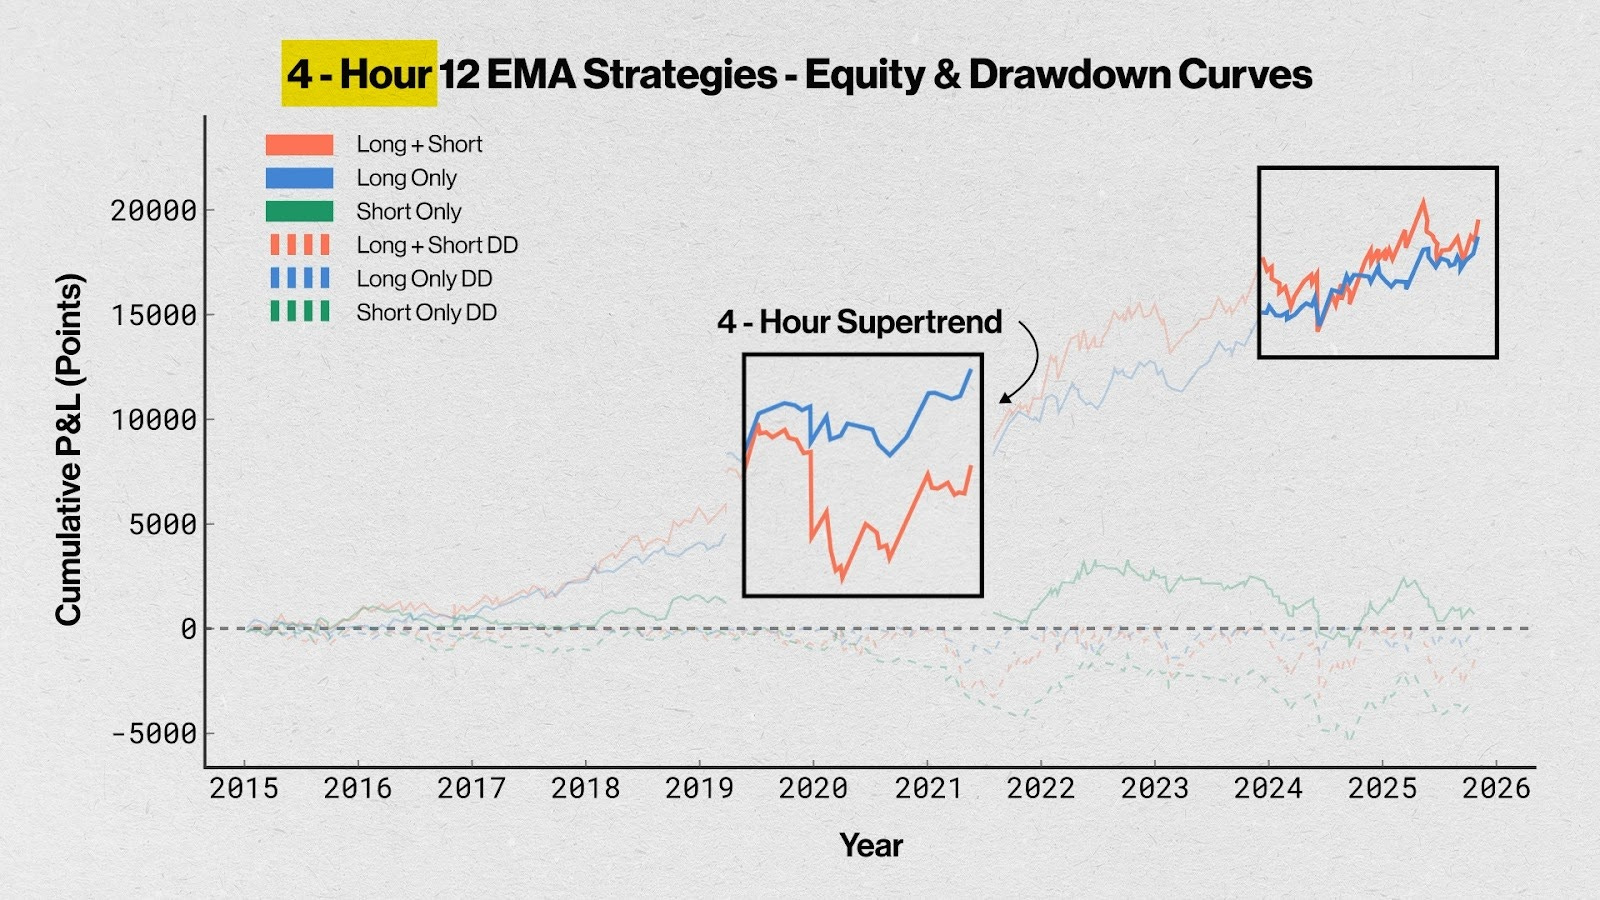
Equity and Drawdown Charts
If we look at the equity and drawdown charts for EMA, it is slightly smoother than Supertrend. Look at the period post-2024. This smoothness comes from the faster reaction time of EMAs.
As you can see, the drawdowns in Supertrend on the 4-hour period are deeper.
All in all, if you are exploring the 4-hour timeframe, you may have to drill down deeper to analyze year and month-wise returns, average P&Ls, and then find a sweet spot.
1-Hour Timeframe: EMA’s Speed Advantage
We are done with the Daily and 4-hour bars, now let’s move to the 1-Hour timeframe . Among the three, this is the fastest timeframe.

Here, the EMA uses a 50-period lookback , exactly what I track in our Weekly Market Metrics series—while the Supertrend parameters remain unchanged at 10,3.
Comprehensive Comparison
Let’s start with the tables. In this timeframe, we will compare all three: Long + Short, Long Only, and Short Only .
Now, the key difference between the two on this timeframe lies in their gross points , i.e., the Total P&L. On that metric, EMA definitely takes the lead .
However, when we focus on average P&L for long-only trades, Supertrend still outperforms—but not as much as it did on daily. Same with win rate. Supertrend offers a way better win rate for a trend-following system compared to the 50-period EMA: 42% vs. 29% . Makes a difference on the margins.
Short Side: EMA’s Clear Win
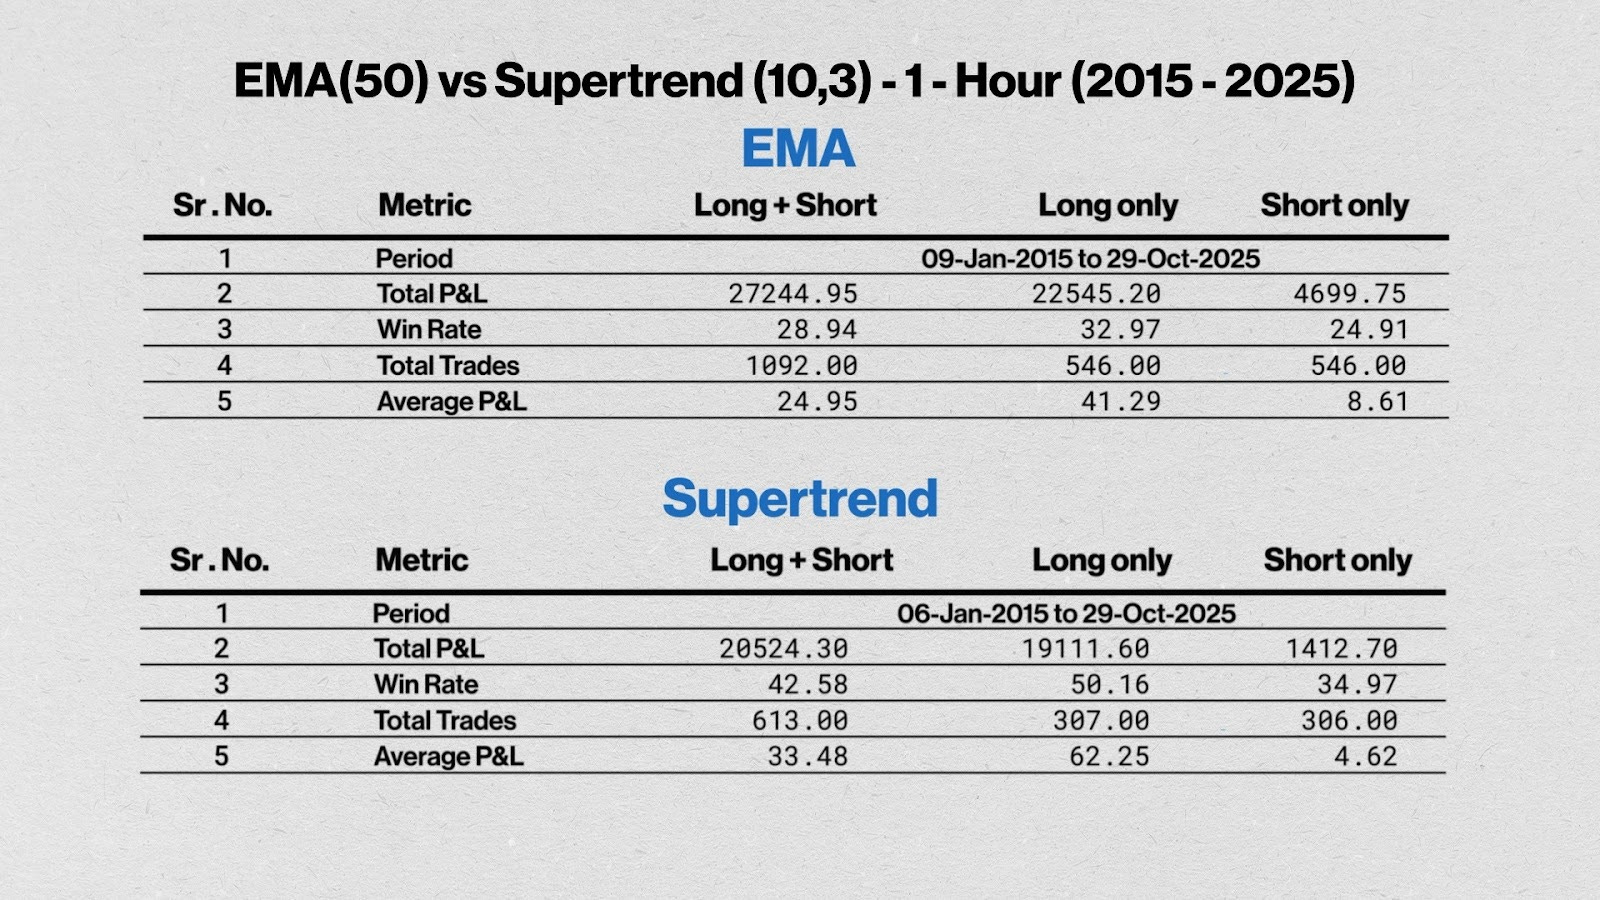
Where things really get interesting is on the short side . Here, EMA clearly wins with 4,700 points vs. 1,400 points —because it reacts faster, and on the 1-Hour timeframe, short trends in Nifty tend to develop and fade quickly. The EMA’s responsiveness helps it capture those swift downward moves far better than Supertrend does.
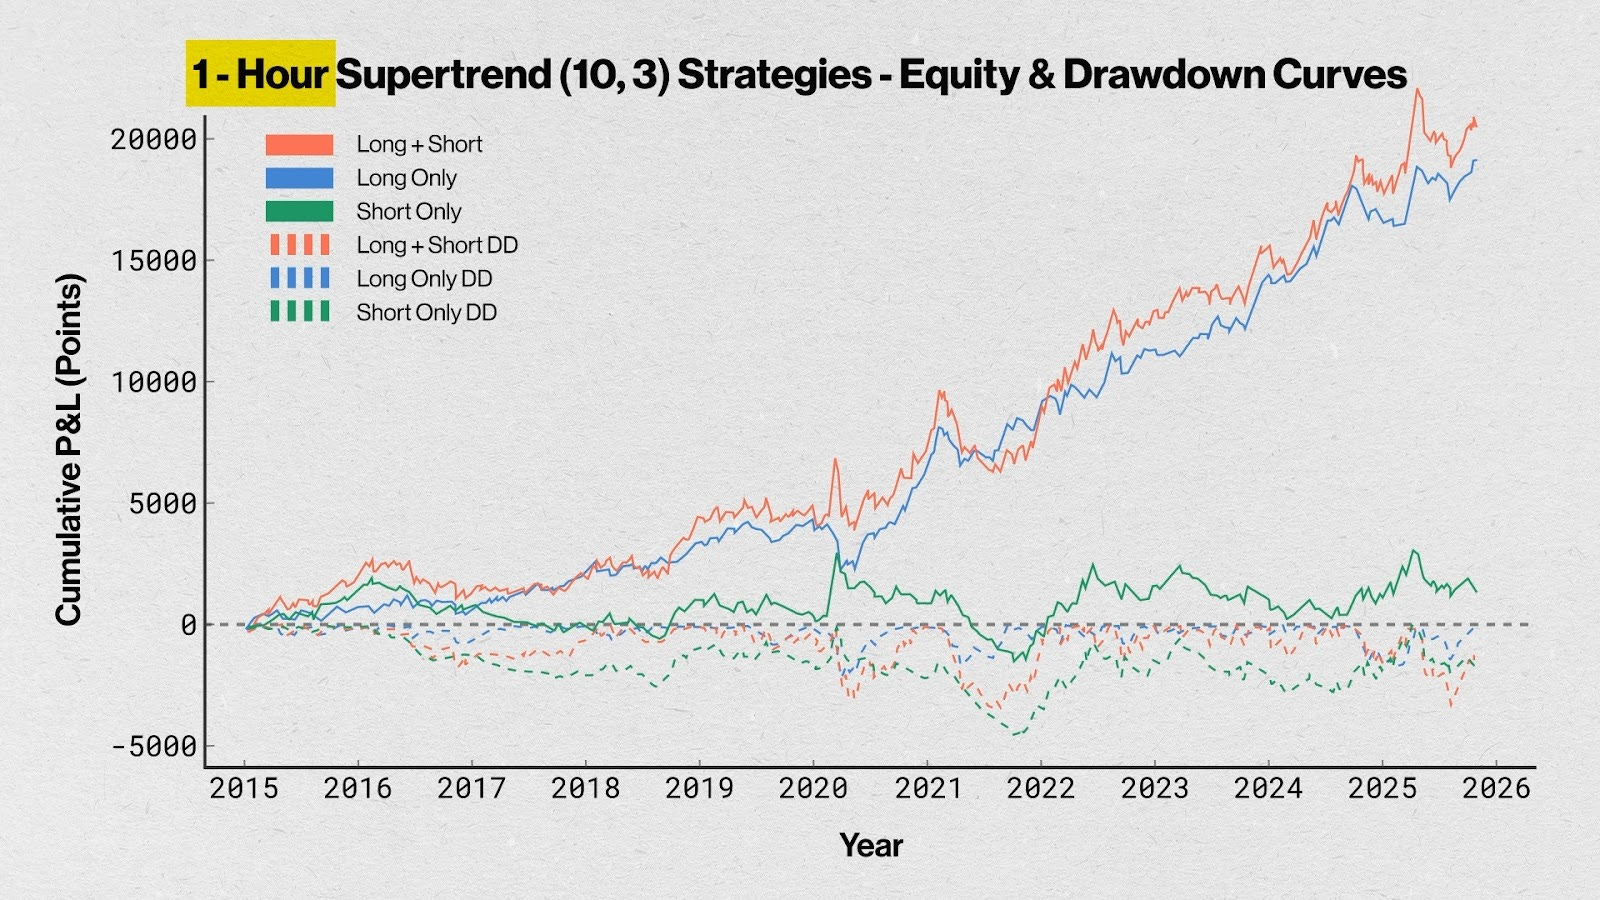
Equity Curves Reveal the Difference
If you want to see that difference, just look at the equity and drawdown curve charts: You’ll notice that the gap between Long+Short and Long-only results is much wider for EMA.
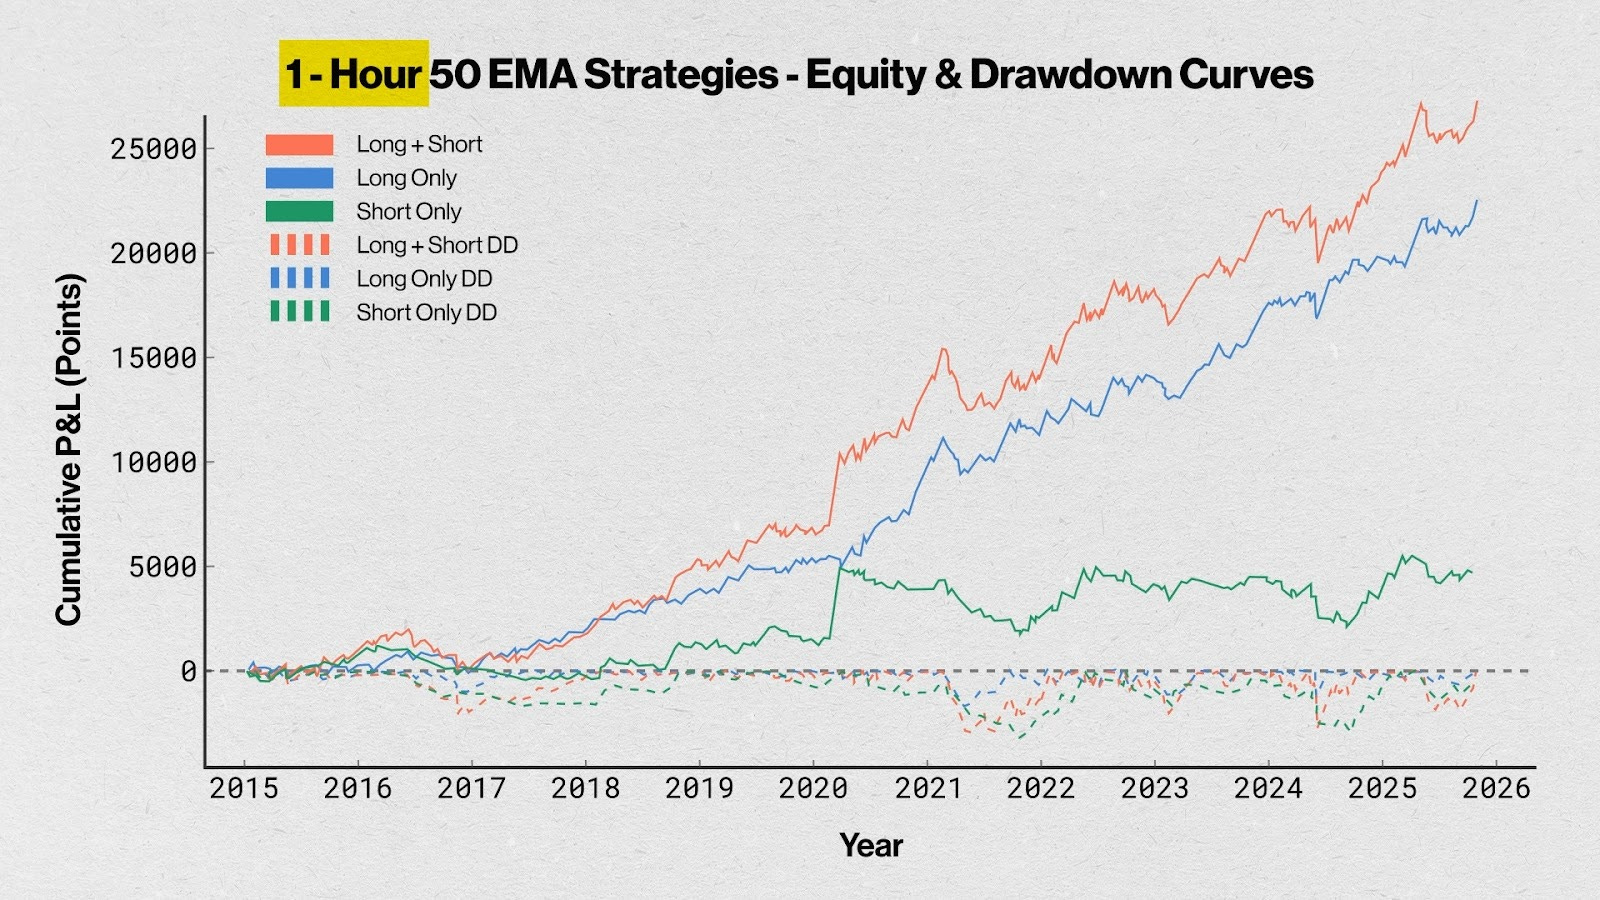
That tells you something simple but powerful—the value added by short trades in Supertrend is almost negligible, whereas for EMA, shorts contribute meaningfully to overall profitability .
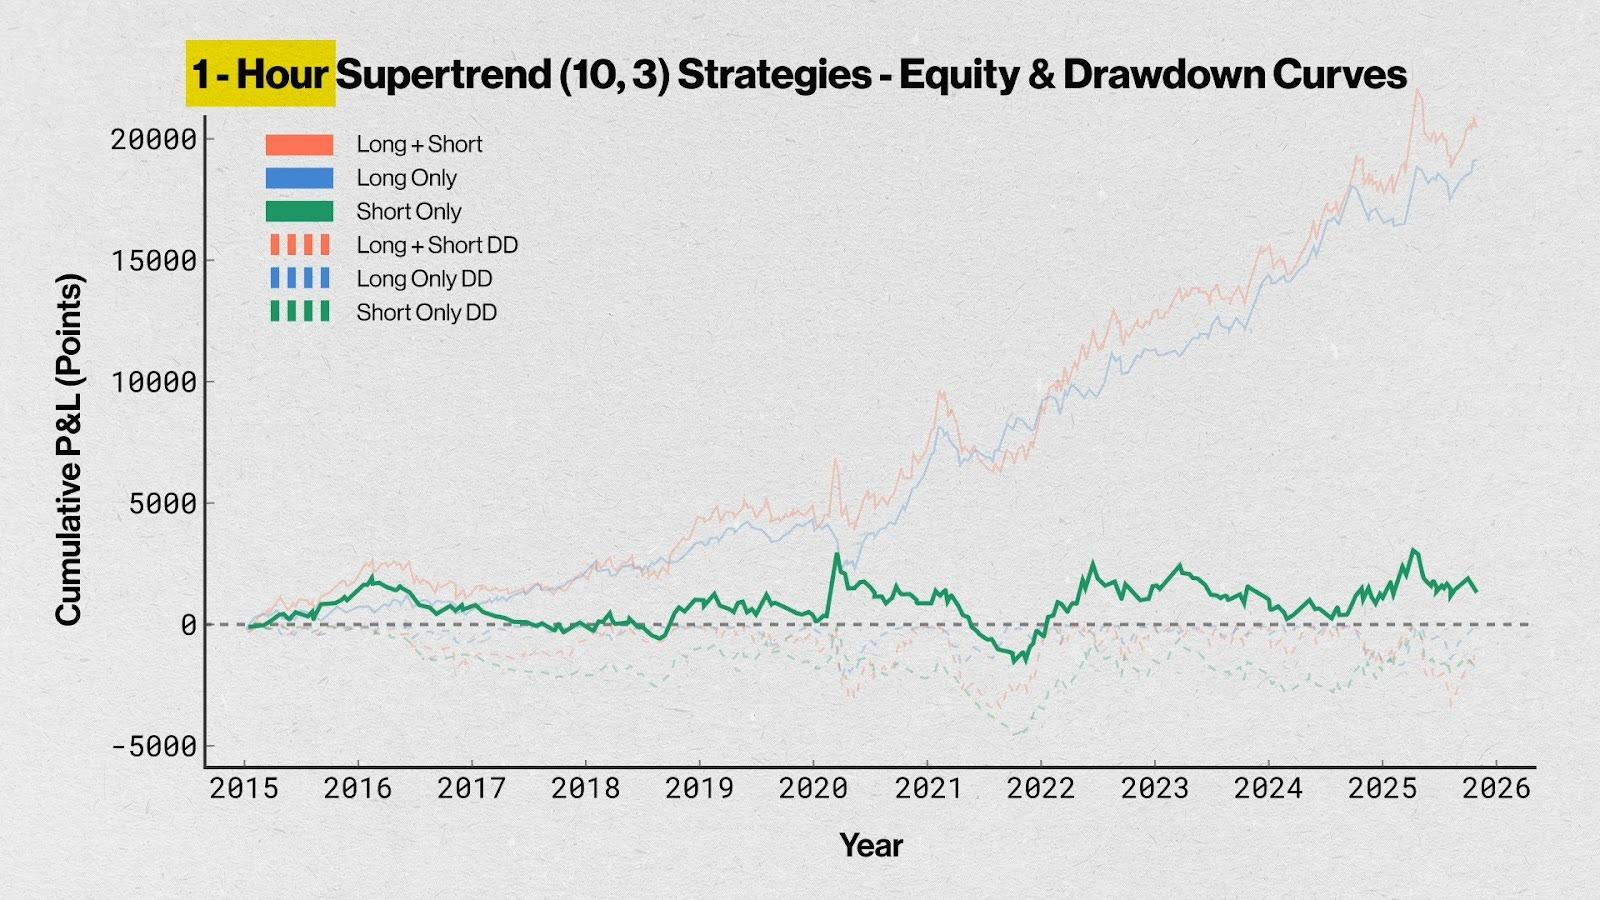
You can also look at the Short-only equity curve—the green line in the Supertrend version; it tends to give up on the gains more often than not.
So, What’s the Conclusion?
Now that we’ve compared EMA and Supertrend across three timeframes—daily, 4-hour, and 1-hour—you might be wondering: So, what’s the conclusion?
Well, there’s no one answer.
But what I can offer is a framework —a way to think about it systematically, so you can decide which model fits your trading style best.
Timeframes: Capturing Intraday Impulse Legs
Let’s go back to the two key ideas we started with—the timeframe of trading and the method of capturing trends .
Talking about timeframes: You’ll notice that as we move to lower timeframes, the gross P&L increases —and that’s an important insight. One possible reason is that a large part of trends often unfold intraday, in what’s called an impulse leg —the first strong move of the trend.
Another factor is that market corrections and crashes tend to start during the day and continue on subsequent days. An hourly system can therefore help exit long trades faster, protecting profits during sudden drops, and that can make a big difference.
Slower timeframes, like the daily chart, often miss this early momentum and faster reaction to trend shifts.
Of course, this behavior can vary from one asset to another, depending on how its intraday price action tends to be. But in our case with Nifty, shorter timeframes clearly seem to capture more of the trend .
Indicators: Context Matters
Now, let’s turn to the two indicators we used—EMA and Supertrend .
Here’s what stands out:
In certain contexts, like capturing short-side trends, EMA performs better because it reacts faster. But for long-side trades, Supertrend often comes out ahead —it takes fewer trades and gives each position more room to breathe, thanks to its volatility adjustment.
So maybe the final choice depends on what you want to capture. If you prefer to play the long-only game, Supertrend might suit you better. If you want to include short trades, EMA gives you that extra edge.
Or perhaps, the best approach is a blend of both —combining the stability of Supertrend with the agility of EMA.
Your Turn to Explore
But here’s the thing—don’t take any of what I shared as gospel . I just shared an illustration with you all. On top of that, if you tweak the lookbacks, add buffers to reduce trades (especially for EMA), you may be able to get better results. Same with Supertrend as well.
I’ll leave that work to you.
Closing Thoughts
And that brings me to the end of this Part 2 episode on Trend Following. I hope you found these ideas useful.
If you have any questions, drop them in the comments—I’ll do my best to answer them.
In the next episode, I’ll focus on the idea of trend following across two uncorrelated assets: Nifty & Gold . And yes, don’t forget to subscribe to the channel.
See you in the next episode of The Long & The Short Show.
Till then—trade safe, and stay curious.