Understanding Adjusted Prices for Historical Data After a Rights Issue

I hope you’re all doing well. I wanted to start a discussion regarding adjusted prices for historical data after a rights issue, specifically focusing on the example of PPLPHARMA. I’ve noticed some inconsistencies in the historical closing prices provided by Zerodha/TradingView, and I’m curious to understand the methodologies behind these adjustments.

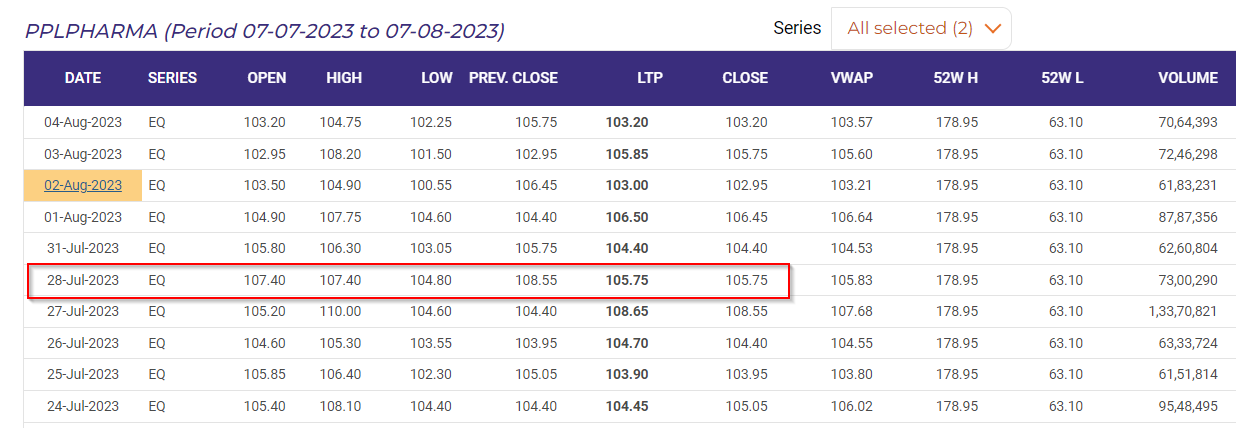
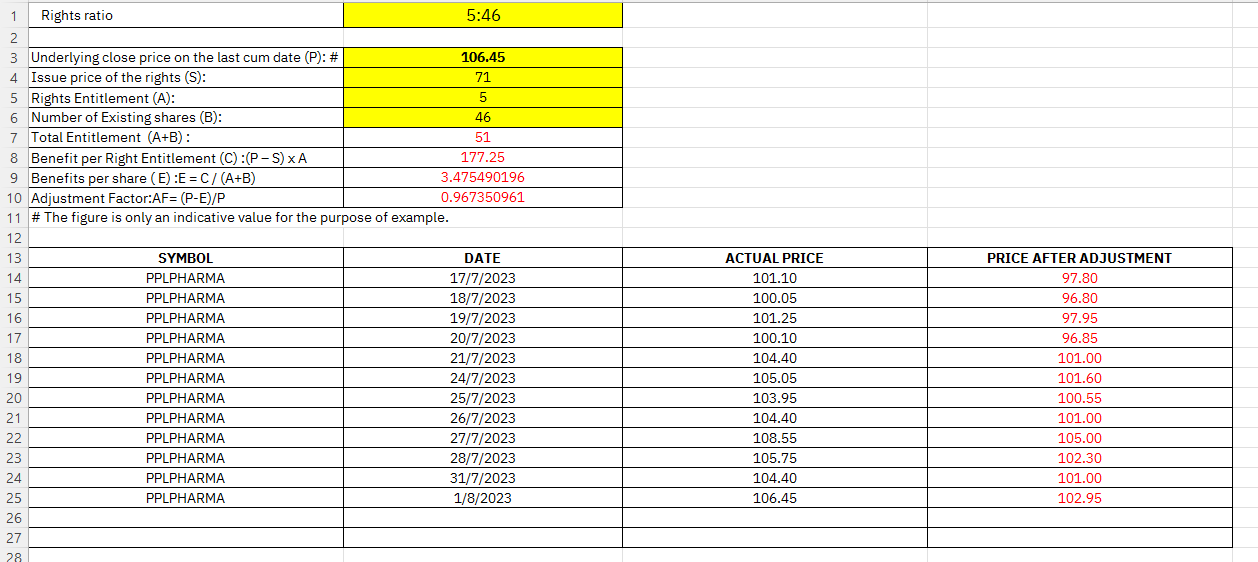
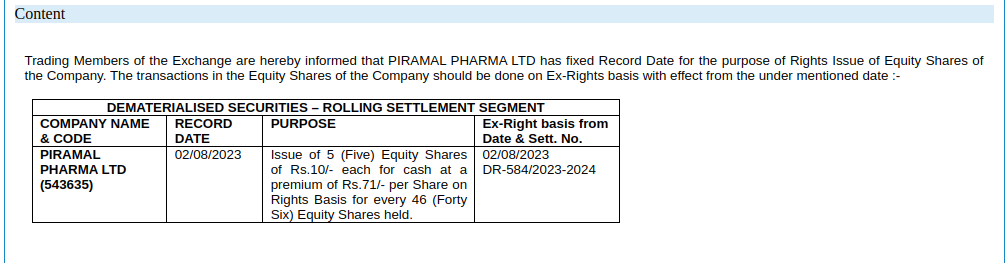
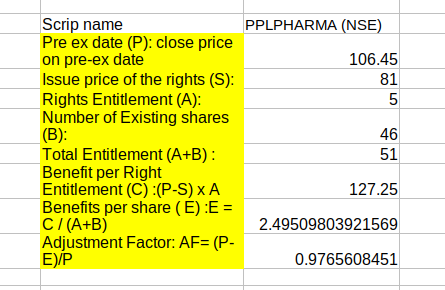
To recap, PPLPHARMA recently announced a rights issue of 5 shares for every 46 held, with a special price of Rs 71. The ex-date for this rights issue is 02-AUG-2023. Before the rights issue, we have the following historical closing prices:

26 Jul 2023 → 104.4
27 Jul 2023 → 108.55
28 Jul 2023 → 105.75
31 Jul 2023 → 104.4
01 Aug 2023 → 106.45

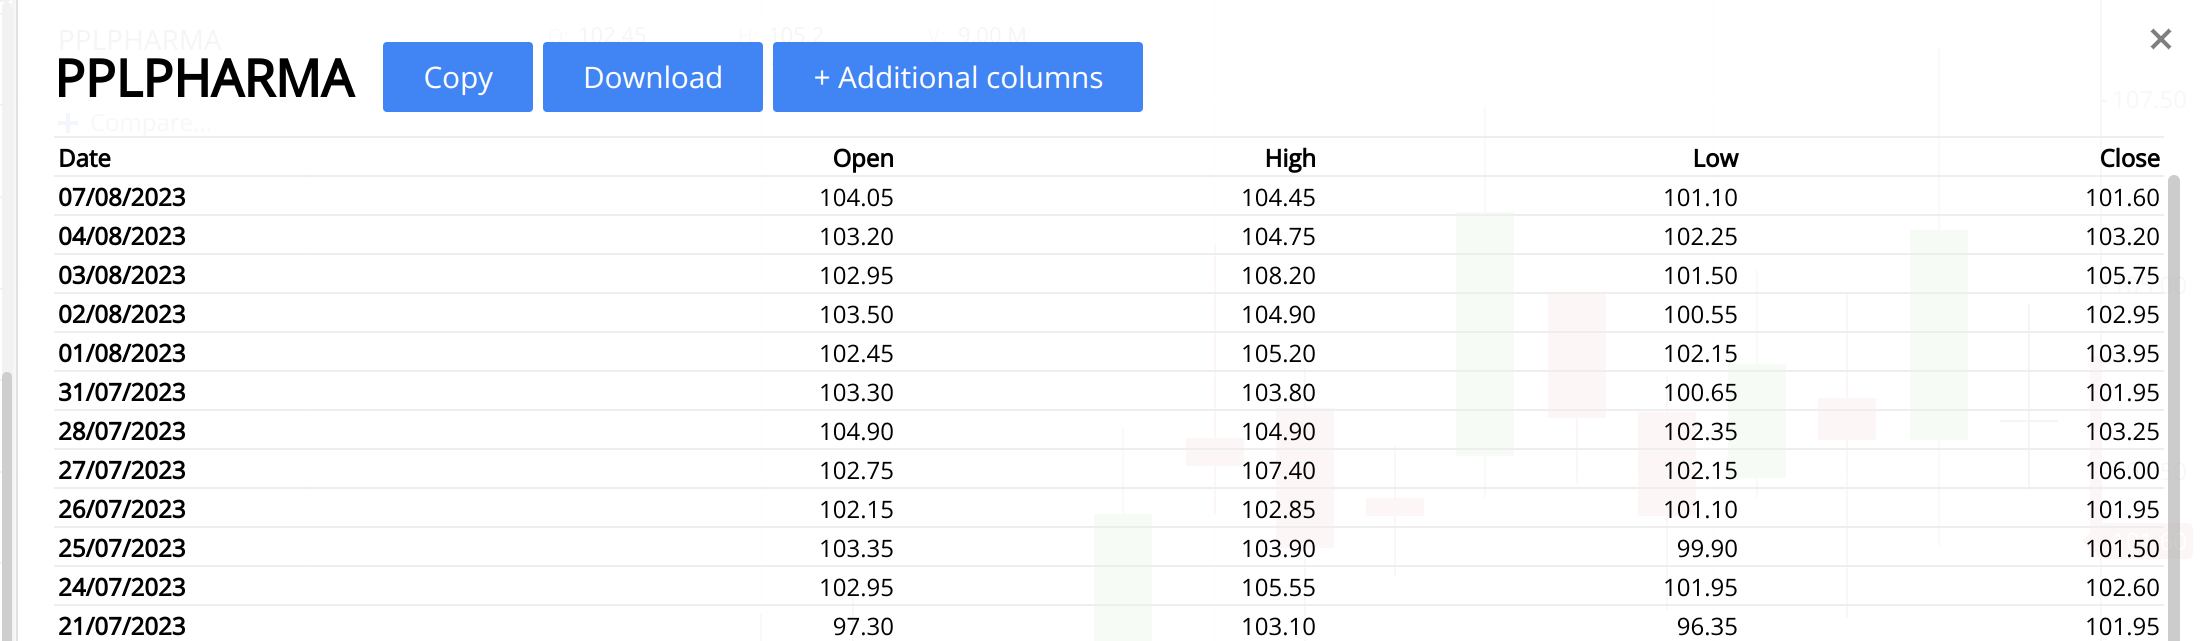
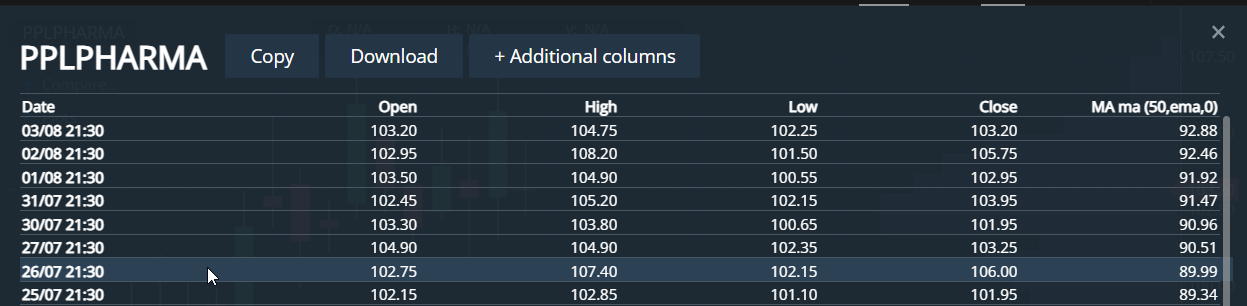
However, when I look at the Zerodha chart, I see different adjusted closing prices:

26 Jul 2023 → 101.95
27 Jul 2023 → 106.00
28 Jul 2023 → 103.25
31 Jul 2023 → 101.95
01 Aug 2023 → 103.95

Even more intriguingly, when I change to data view, the adjusted closing prices change again:

26 Jul 2023 → 106.00
27 Jul 2023 → 103.25
28 Jul 2023 → 101.95
31 Jul 2023 → 103.95
01 Aug 2023 → 102.95

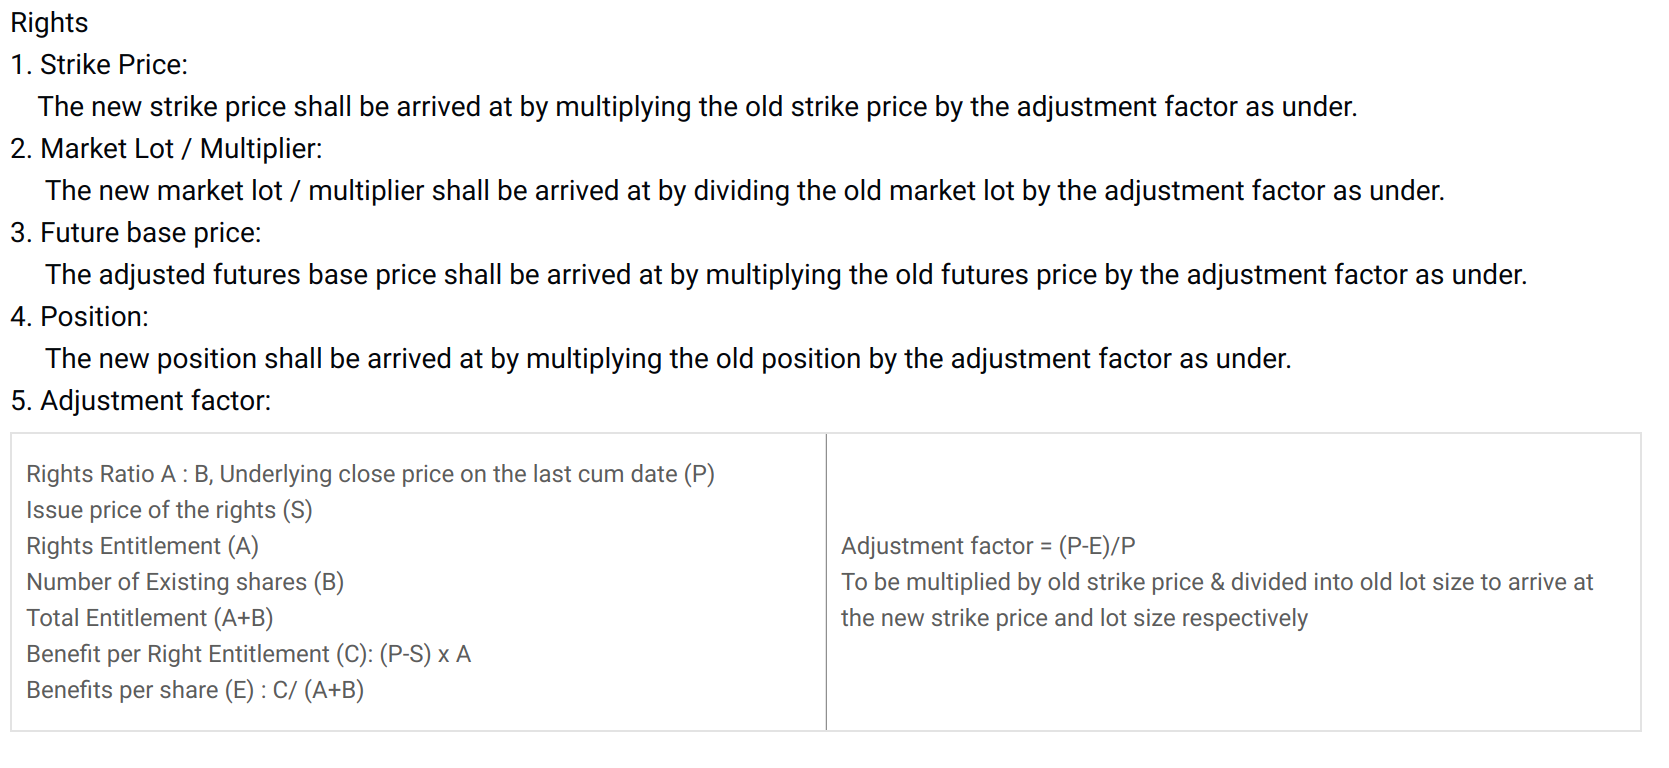
This has left me somewhat puzzled, as I couldn’t find clear details on the adjustment methodology on the NSE India website. I did come across a methodology document from Refinitiv (https://www.refinitiv.com/content/dam/marketing/en_us/documents/methodology/corporate-actions-methodology.pdf), which sheds light on adjusted prices for various corporate actions. However, I’ve noticed that while it seems to work for splits and bonuses, it didn’t provide accurate results for rights issues.

I’m reaching out to the community to see if anyone can provide some clarity on this matter. Do you think the Zerodha/TradingView chart data is correct? Could there be a different methodology applied by Zerodha that’s causing these discrepancies? Are there any other reliable sources or documents that might shed light on how adjusted prices are calculated after a rights issue?

Your insights and experiences would be greatly appreciated.

Looking forward to your input!

I think you are talking about ticks…well it is not available because in India we don’t get second by second data because the servers are not fast enough.and internet connection and processors on servers are not powerful enough…when there is huge volatility in market sometimes those things can happen or happens every time…I saw my placed order on infosys got sold 10 rs above where stock got rejection in rejection…and other place like options call or put buying in buyers perspective it is happening daily…If you want to notice this you can try one thing …just search nifty after market closing in Google you will get a price … (closing price).Then go to tradingview and check the closing price…You will know …Another thing Zerodha and other brokers on tradingview only get silver perk equal to somewhat delayed data
Top Brokers — Verified Reviews by Actual Clients — TradingView — India see indian brokers which we are mostly using have silver level perks …

Thank you for your response. To clarify, I was referring to daily price data, not second-by-second updates. Let’s take a specific example to delve deeper into the matter. Consider the close price of PPLPHARMA on 28th Jul 2023. Here’s what I found on different platforms:

NSE India Site → 105.75
TradingView → 103.30
Kite → 103.25

These discrepancies among the three sites raise important questions about the methodology behind these adjusted prices. Why do they differ, and what factors contribute to these variations? Understanding how these adjusted prices are calculated is crucial for accurate analysis.

If anyone has insights into the underlying methodologies used by these platforms to arrive at their adjusted prices, it would greatly help.

You can refer here.

Data matching for me. In your screenshot, it shows data from August 1st as July 31st. Could you try a hard refresh (press Ctrl+Shift+R) and check again?

@Arockiya_Raja - Thank you for your response.

I did encounter this adjustment methodology as well, although I initially believed it was primarily intended for the derivatives market.

However, even after applying the adjustment factor derived from this methodology to the historical prices, I’ve noticed that the resulting adjusted prices still do not align with the figures displayed on platforms like TradingView or Kite.

This further adds to the complexity of understanding the calculation process behind these adjusted prices.

1 Like

I will check and get back on this.

1 Like

Hello @pjsaran and @Arockiya_Raja , were you guys able to figure out the process used for getting these Adjusted Prices ? Why the prices are not matching?

Regards

Nope. @Arockiya_Raja - Did you manage to find anything?

I checked this but missed to reply here. Will reply to you Monday.

1 Like

As per your above calculation, I can notice that the Issue price has been considered as Rs. 71 whereas it should be considered as Rs. 81 (Rs. 10 + Rs. 71 premium). Notice

The adjustment factor will be 0.9765608451
image

3 Likes

Perfect. Thanks a lot. I see the calculations matches now.

Thanks for noticing and clarifying this @DhanushK

@pjsaran , is there any other case as well, in which you have faced issues for getting proper calculations for the various Corporate Action Adjustments for Rights, Bonuses, Splits etc.?

I have been looking for ways in which the NSE Bhav Files EOD Data could be adjusted for the various corporate actions, but the task looks complicated and might require a lot of efforts “because of the number of symbols involved and so many corporate actions”, so have not been able to practically do this yet. Doing such work manually, does not seem to be the best way, there should be some automated codes which could do this work in a jiffy and on a regular basis. If anyone has any ideas in this direction, then please do let us know. I am willing to buy a paid solution as well, which can adjust the NSE Bhave EOD Data with all the corporate actions in an automated manner.

Thanks

@4autotrading,

I am also looking for price adjusted Bhavcopy for NSE and BSE stocks.
DId you find any options from anyone here? Please do let me know.

Not aware of perfectly adjusted data unfortunately.

But we do have ‘PR’ files in bhavcopy, ex - PR100124.zip today which report corp actions.
I have been using them to get advance warnings of corp actions.

They could be used to create atleast some of the common adjustment ratios like splits and dividends.
But things like rights issues, mergers/demergers would be more complicated and i don’t think these files have enough info.
Also, these files don’t seem to be very well standardized as same info can have different tags that we need to search for, perhaps at some point they were creating this manually.

So not perfect, but can we can cover most of the corp actions through these. I dont trade overnight cash yet, and i haven’t gotten around to trying to use this for automatic adjustment.

1 Like

Thanks for your prompt reply