Can anybody help me understand why its like this? The closing point on chart and actual closing numbers are different.
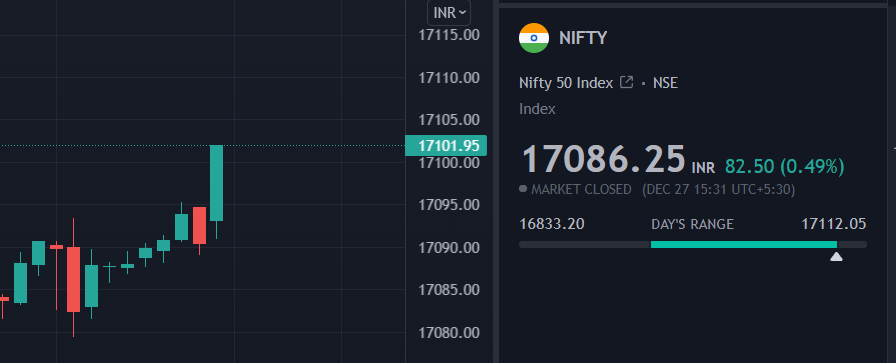
Final closing price for the day is weighted average price of last 30 minutes of trading. This can differ from LTP (Last Traded Price) which you’re seeing on charts.
1 Like
You can swither RTH to ETH if you are confused about the difference in screen and in the chart. You can find this option unde the chart.
Last traded price and closing price of any stock, index can be same in rare cases but mostly they are different from the chart closing price.
Refer to post market session.