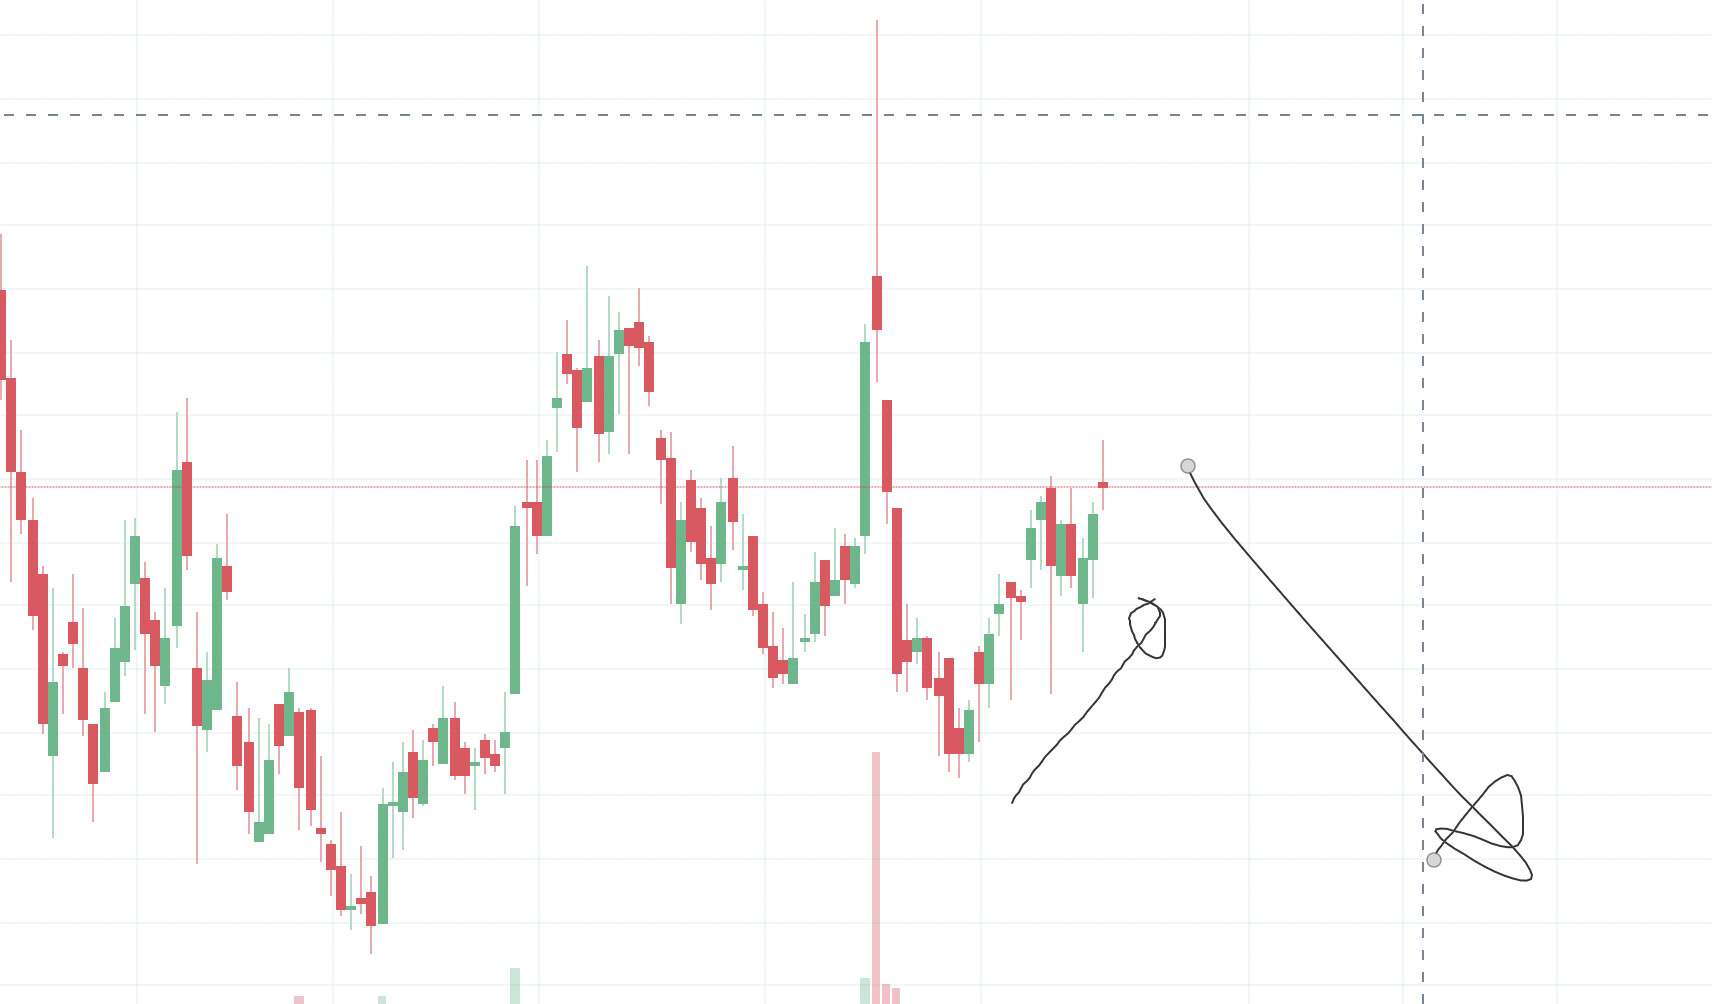
HDFC AMC Daily chart. can the marked portion be considered an uptrend. If today’s candle closes a doji, and the day after is a bearish will you consider the possibility of a downtrend?
1 Like
50/50.
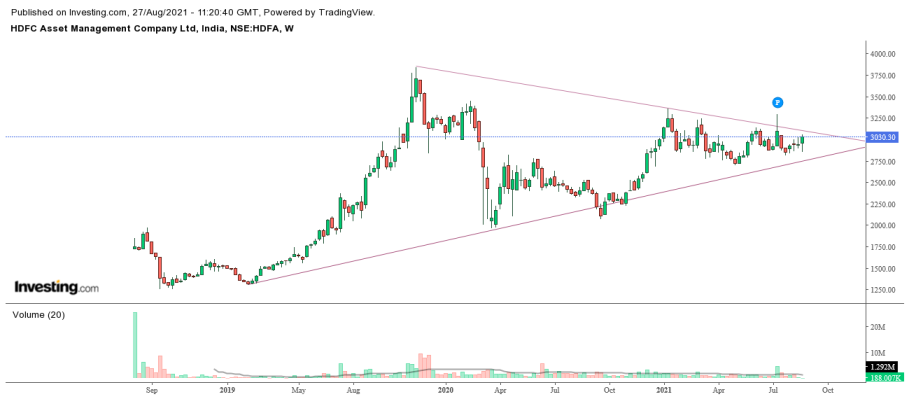
See monthly and Weekly chart + volume analysis ,its still consolidating.
From last few months HDFC AMC is in a trading range(2700 to 3100) with positive bias or you can say that, is in a consolidation
So this is basically can be range trading right, does this look like bearish if there was a bearish candle
1 Like
Yes , but one need to look at Volumes & other parameters/chart flow , Bearish/Bullish candles are just one part. This particular stock is trading in a trading range in my opinion , one can wait for breakdown/breakout to take a long/short trade or else one can do trading range.!
other parameters apart from volume like?
Also is chart flow defining the long term trend, short term trend or something else?
1 Like
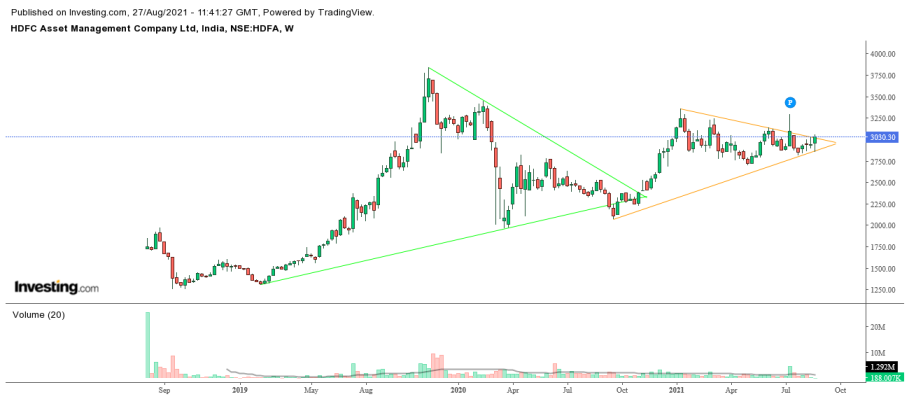
Apart from Volume there are many parameters like Chart patterns, trend lines, thing is that ,lesser& simple parameters works better, Chart flow defines long term/short term based on style & time frame selected for the trading.I am posting 2charts, you can find that a long triangle & a short triangle patterns visible in HDFC AMC weekly chart.
okay thanks