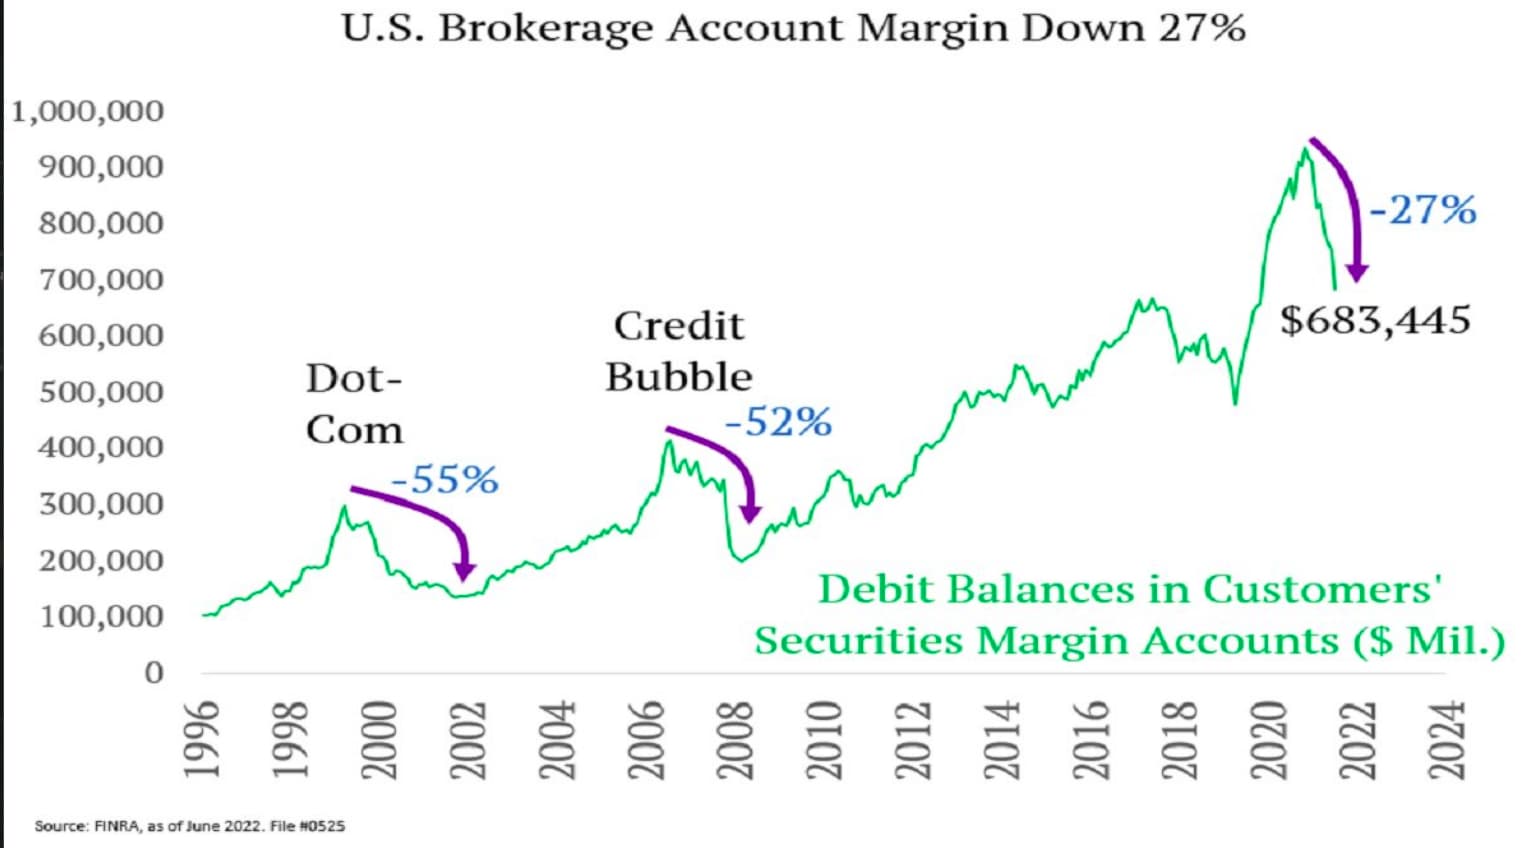
Decline in US Brokerage Account Margin:
Dot-Com Bear: 55% Decline
Global Financial Crisis: 52% Decline
Current Bear: 27% Decline
Source : Jeff Weniger
Even though there has been some deleveraging (27%) , The most notable point for me is how current lows are 50% more than highs of 2008 credit bubble and the fall in terms of absolute number is almost equal to the peak margin amount of 2000 crash.
Here’s an excerpt from : https://skyjuiceiswater.blogspot.com/2018/08/the-danger-of-margin-trades.html#jumpspot5
-
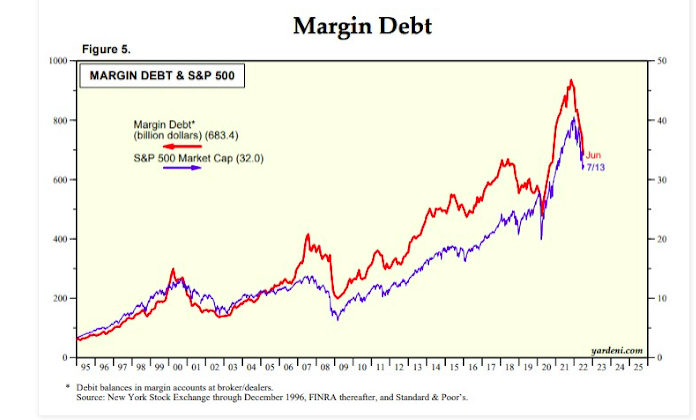
Margin debt is always a leading indicator for market crashes; it will fall before the market index started to fall;
-
Except for the Dot.com bubble in 2000 and before the SEC rules were changed, the margin debt will rise first, followed by the market and also when margin debts almost reach and touch the S&P500
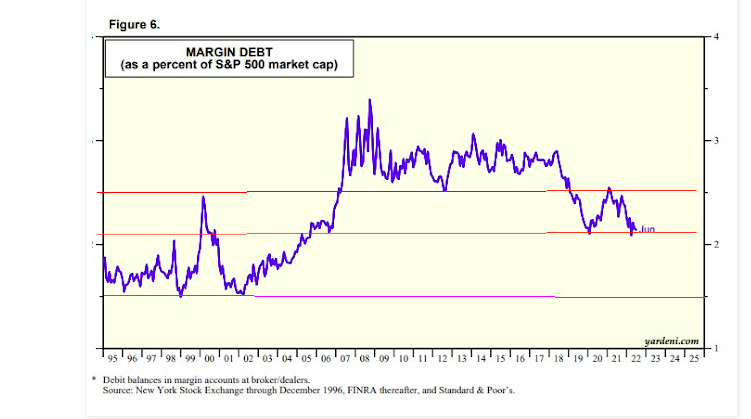
Margin Debt as a % of S&P Market Cap
-
The chart shows that margin debt is no longer the main source of the “driving force” behind the market. The investors could have found and used other sources to drive up the market, especially when such changes occurred after the latest round of QE which is also driving up US inflation at the same time;
-
Nonetheless, the curve of margin debt as % S&P has just hit support again. It might have indicated that the market could have recovered provided there is no further aftermath event like Lehman Brothers in 2008 causing secondary damages to the stock market.
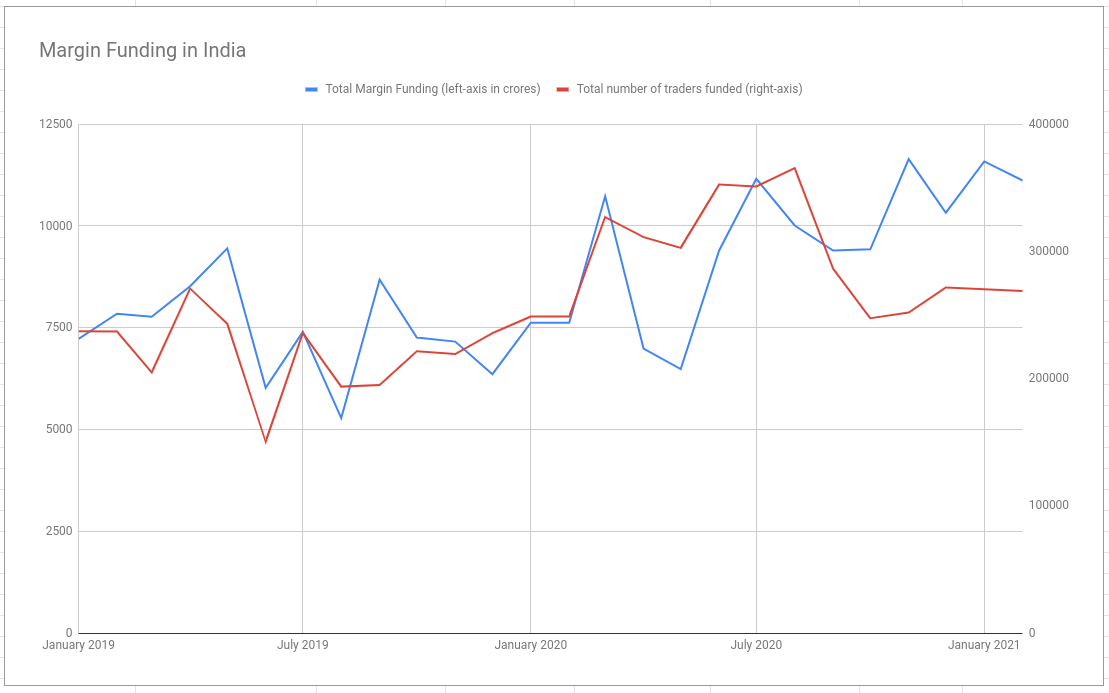
It would be interesting to see if we have any similar trends or correlation in Indian market performance with amount of leverage propped by Indian brokers esp the traditional ones. @nithin @Bhuvan