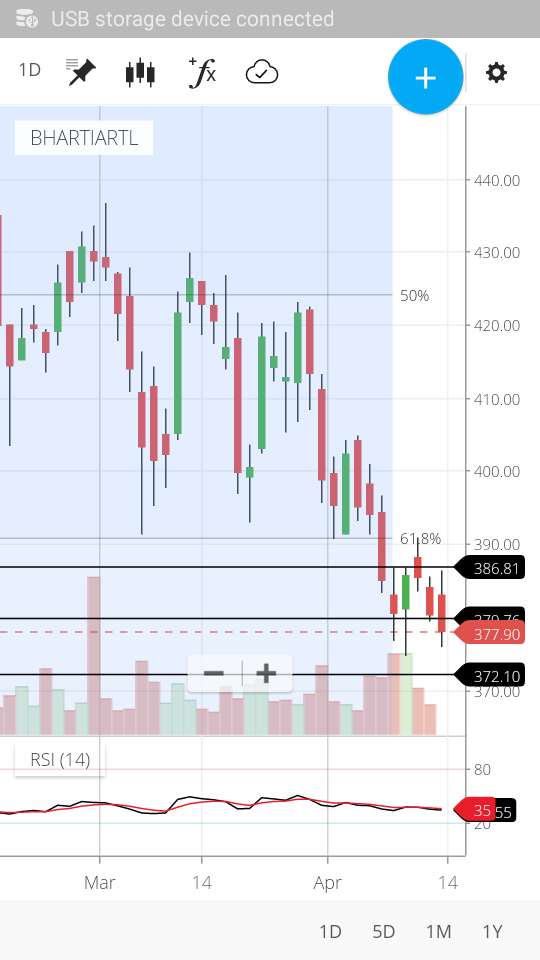
My view is that Bharti airtel will fall below 371, but i am considering 366 as support level . Bharti airtel closed below major support level ( 380 ) after trading at level near 380 from many day’s in to a congestion or a trading range level of 365-366. So i assume Bhrati airtel downward trend is decelerating in to a side ways / trading range ( 365 - 380). and also i assume , by considering long term chart , downward trend accelerate below 365 level.
Well i wanted to write about Bharti , when it crossed back above 380 level and also after 392 level, i accept my first view was defeated by the market , when i was posting , 371 level was in my mind , ignored the false breakdown below 380 level i was very negative on Telecom sector. . But i was sure that down trend in Bharti airtel was decelerating
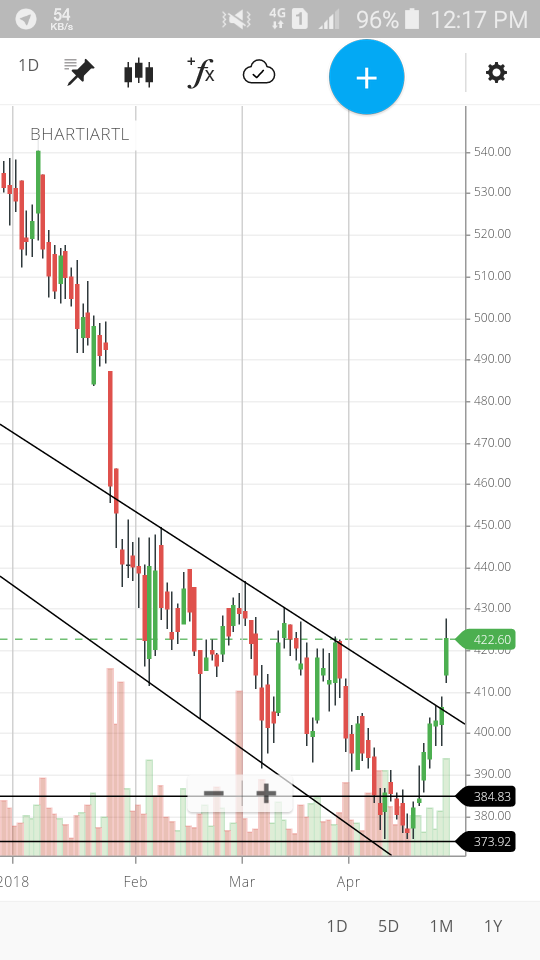
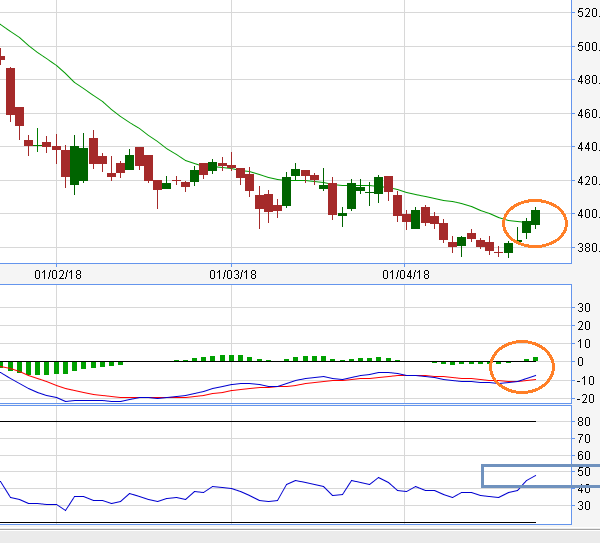
After checking charts again , i assume Bharti Airtel will cross 410 easily till 421 & 430 level . all chart indicators are showing upward bias for Bharti airtel and also it crossed above 20 DMA
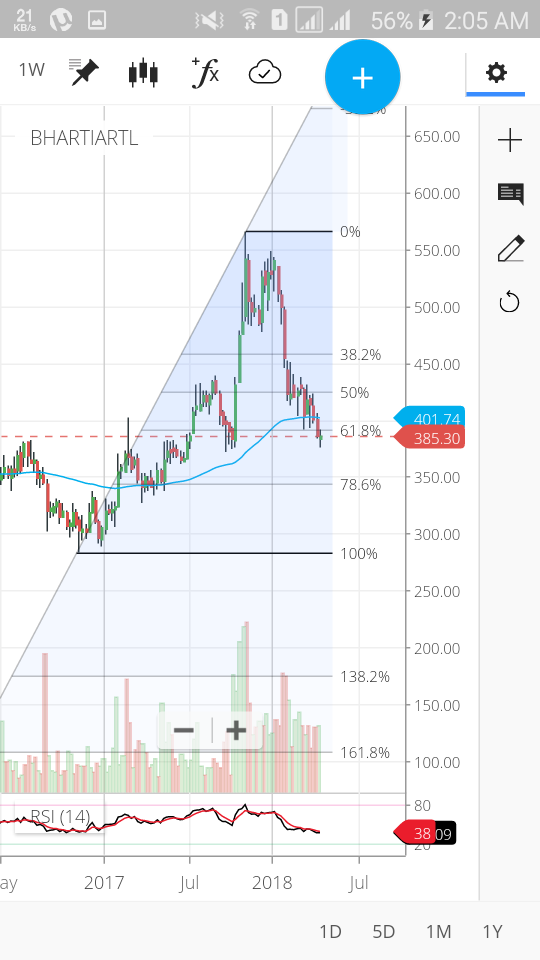
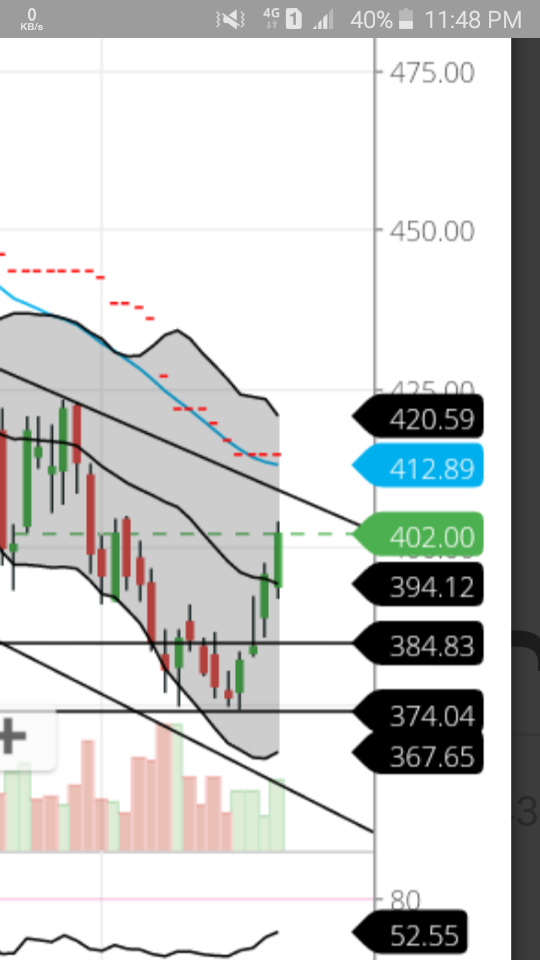
Yes you were surely correct but you may be didnt notice the main support 374 - 371.
My stop loss was also 370 .
And had tensed when it touched 374.3 level.
But it reversed from that level.
Which was good indication when it reached above 392 resistence then it was giving good feeling
Now your expectation are also fine and depends mainly on Results coming on 24th April.
What you say about results.
Yes correct i considered 380 & 365 only. Since i rely on TA , i don’t use much Fundamental analysis, but the price momentum , indicates a better results by Bharti airtel , and also there is a news about Netflix & bharti airel is offering it to their customers.
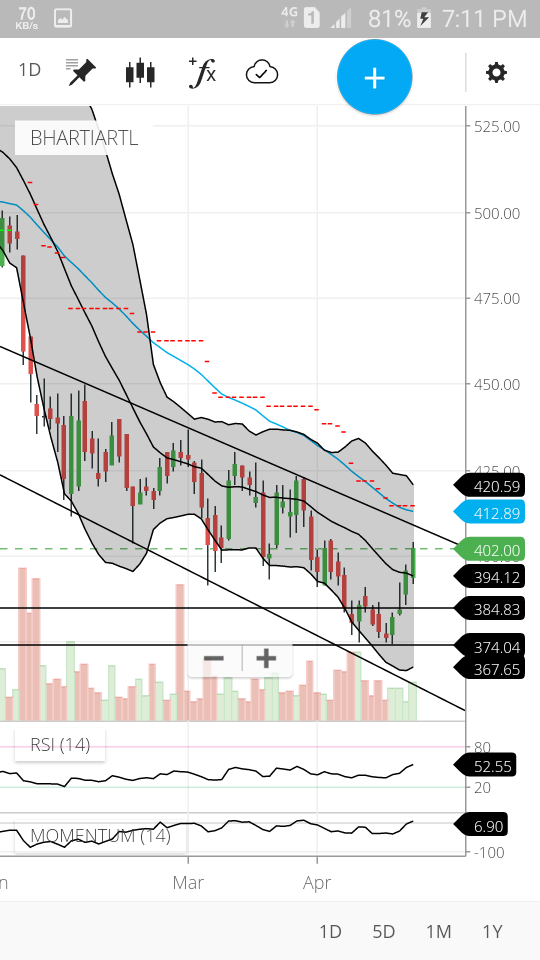
Slightly , i differ here, nearest resistance levels are 406- 411 , i assume after 380-392 and 400 resistance levels , all three major resistance levels crossed easily , so crossing 406 - 411 level’s are not much difficult
Try to avoid appreciate my views bcos , there are lot many naysayers on Trading Q&A constantly mitigating thread after threads , messing up purpose of that particular thread, especially threads related to Technical analysis . so chances of a naysayer descending on this thread
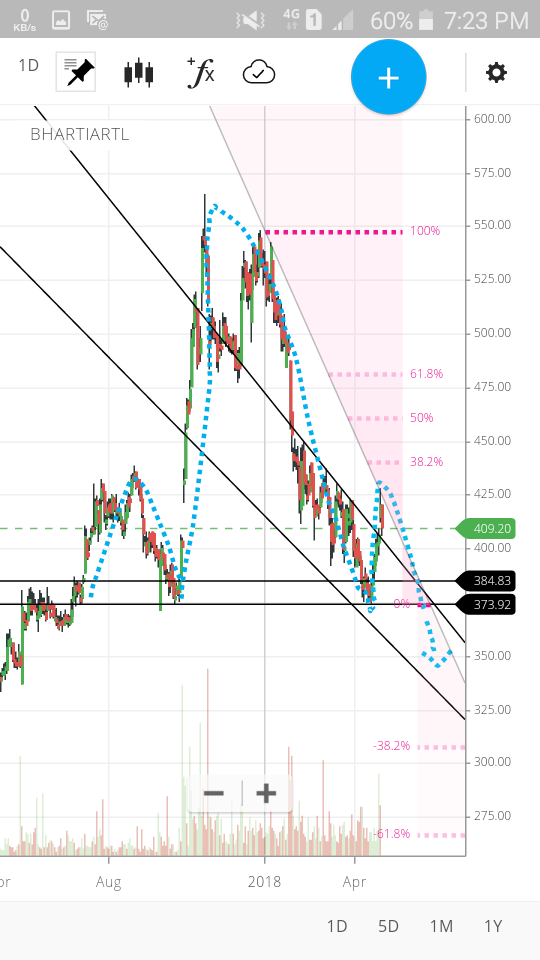
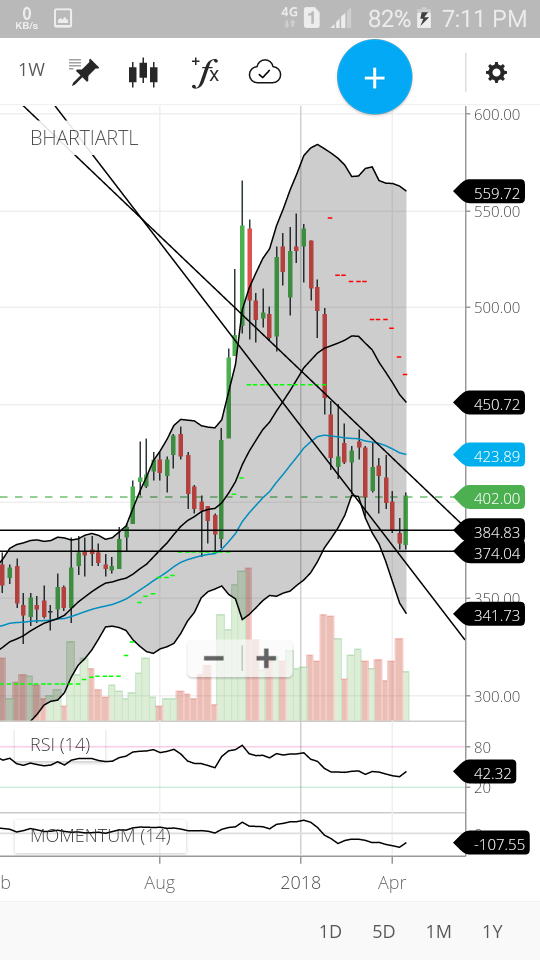
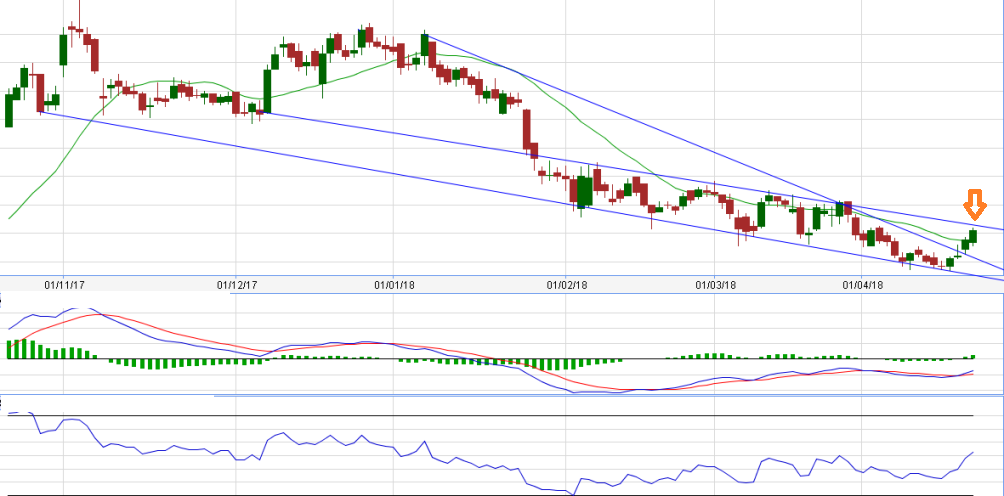
After checking Bharti airtel chart again today , on long term chart H&S ( head and shoulder )formation is visible , So i am not recommending , just a yellow flag , imagine if i were you , i will take out 50 % profit on 23-4-18 and let the other half to see , if results are good or not.
In days to come, IMHO BHARTIARTL may fall below 371 and find support around 350 or 330 or 300.
To add, for trading I would avoid this counter as the chart clearly depicts clear indecisiveness. Hence chopiness.
Exactly , people who follow Funda’s ,scratching their head for the reason behind today’s Bharti Airtel’s price movement , whereas TA indicated today’s price level of Bharti airtel 3 days earlier
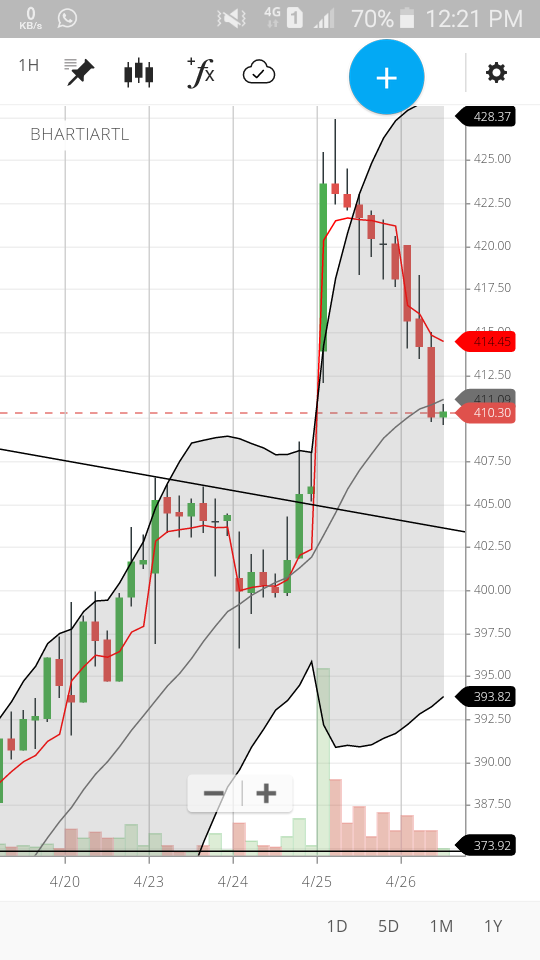
Today was the FNO expiry day , there is an interesting action on Bharti airtel stock price , open & high was exactly at 420 , yesterday and today it failed to close above resistance level of 421 , but reversed from day low ’ & support level of 406 & closed above it , so Bharti airtel price action on next trading day will show its the clear direction. If Bharti airtel fails to close above 421 level confirms the H&S formation on long term chart.

 bcos , there are lot many naysayers on Trading Q&A constantly mitigating thread after threads , messing up purpose of that particular thread, especially threads related to Technical analysis . so chances of a naysayer descending on this thread