Tradingview has a well defined volume profile which includes session volume , range volume as well with POC , HVN, LVN as well where as zerodha just have volume profile that’s it why don’t you improve it when you know it’s one of the important indicator, there’s also an option of tick volume in tradingview’s volume profile. @siva-reddy @nithin
1 Like
Tradingview is not selling that bit, they want to keep it to themselves. We are trying to add few custom indicators in comings days, hopefully we will provide all those.
1 Like
Siva it’s been over 15 days since trading from chart was revoked.
Please atleast provide that one.
It was big help
Should come out in a week.
1 Like
Eagerly waiting for that
Thanks! But I fail to understand when zerodha can afford to code all volume profile essential features by themselves why aren’t they doing it? I’m asking because that’s a very important tool to me which helps me analyze better.
We use their charting libraries, changes has to go through them.But we will fix this in coming days.
Instead of adding it to tradingview , Zerodha can enhance and improve the volume profile they already have in chartiq , like they in addition can just provide session profile, VAH , VAL , POC , and tick volume. That’s it , I know you guys are trying but try to make it quick, I’m really counting on you guys.
Yeah on chartiq only we will be doing.
Thank you so much!
Siva when can we expect customized volume profile tool? It’s a very important tool for trading. Please try to escalate it and release soon. It would be of great help. Thank you
Not any time soon, we just use charting libraries and these are not our inhouse products.
@siva-reddy there is an indicator called spread in trading view. Can you please tell what does that do ? Is it for plotting straddle and strangles?
Maybe difference between bid and ask, or spot and future or could be anything ,if you can ping me exact link I can say.
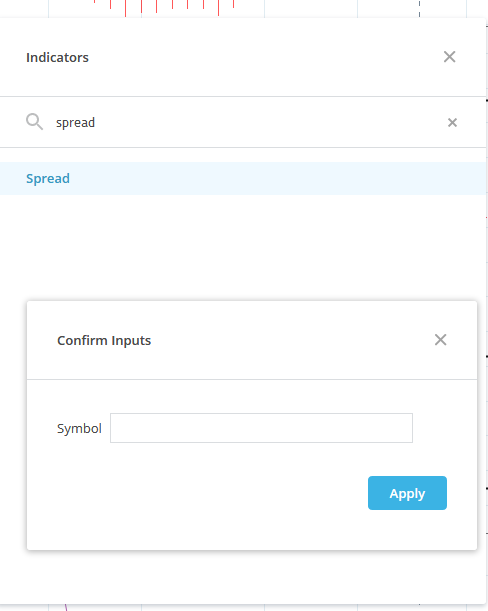
This Indicator shows you spread between prices of two securities. To get better understanding you can plot this on chart of Nifty and compare with Nifty Futures, you will get an idea of how this works.
1 Like
Thanks for a prompt reply. Is there any other indicator when I can add 2 script, Aim is to plot straddle or strangle premium
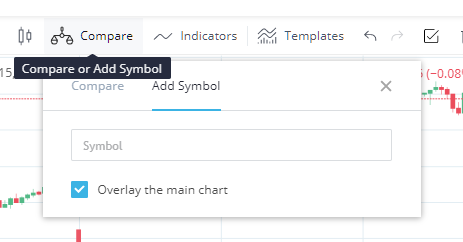
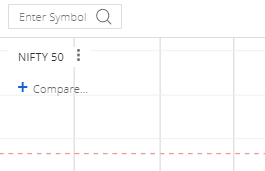
Not aware of any such Indicator, but if your aim is to plot price chart for multiple scrips then you can do so using Compare option on Trading View and ChartIQ, this will plot price chart for multiple securities.