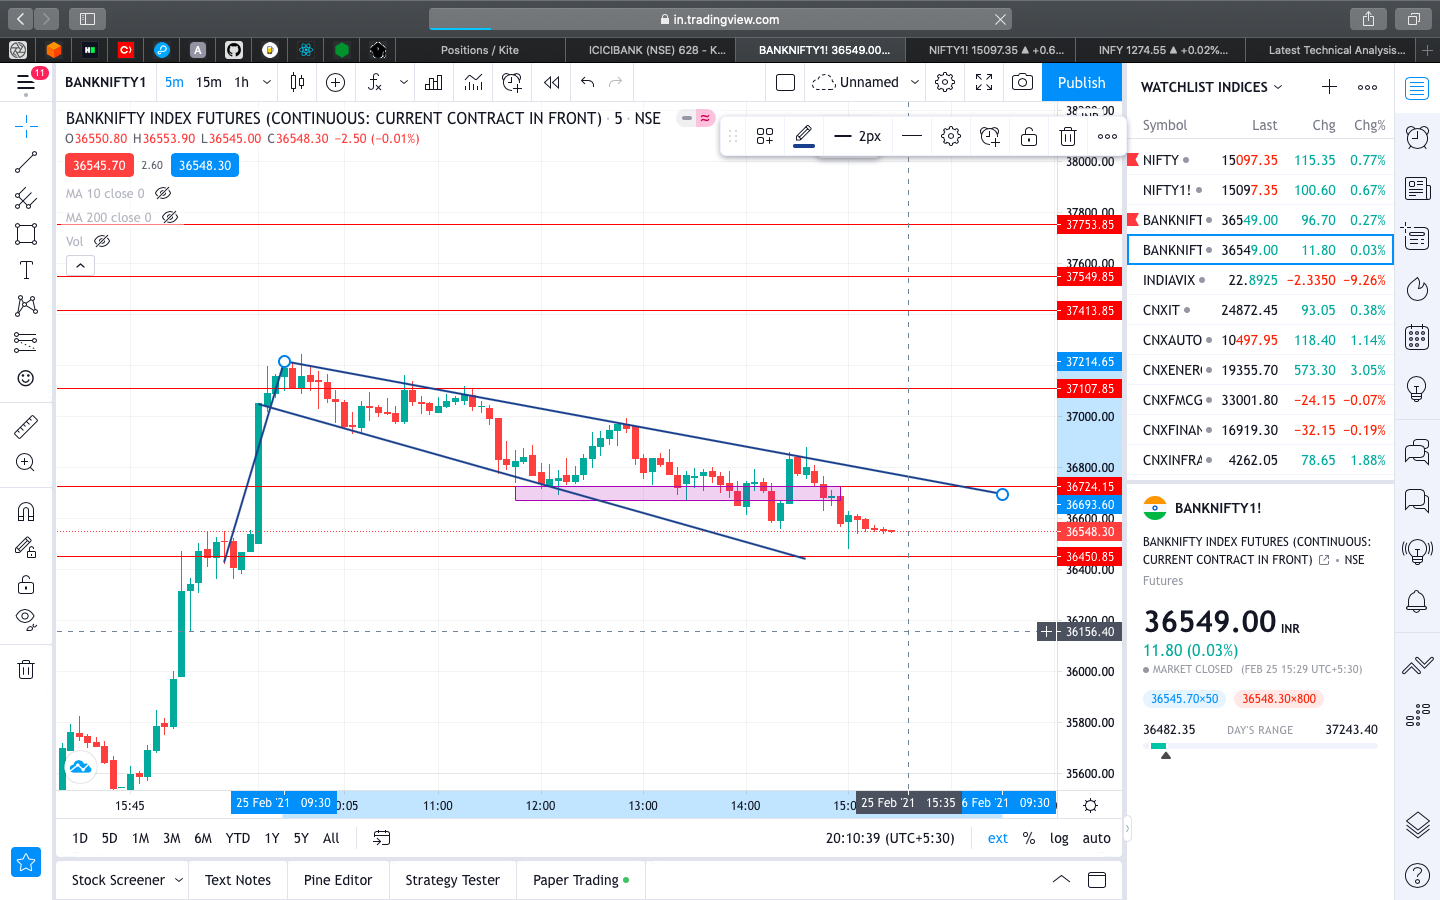
Since I am a new user I was allowed to upload only one media file. So I uploaded the 5 min chart. Please guide me. Any help/suggestion would be much appreciated.
Is bank nifty futures forming flag and pole pattern on 15 min chart ?
Is the rectangle a good reversal zone ?
I entered the trade at 1 st red candle closed below rectangle on 5 min chart. Was I wrong in entering the trade, I hoped to cover some points but then when next candle was very bullish I had to exit the trade (It closed above rectangle)
I just want to know if my analysis was wrong or the market reversed from that point took resistance from upper trend line and then came down.
I guess it was trap, whatever is your trading candle time frame, wait for the candle to close and for a retest, it was buying zone and breakout failed. if Market is bullish, be careful to buy put or sell on just breakout of a demand zone and vice versa.
Also would suggest you keep an eye on 15 min candle and trade on 5 min candle, if we watch 15 min candle it did not give close there.
@rahulsingh It’s not necessary that only complex systems will work…most of the successful traders work majorly on price action (‘line draw’ krke) & I am pretty sure that their success ratio is much more than yours…no offense.
@harsh430 It was expiry day.
I think what Rahul meant was that no system is perfect. You can draw trend lines, supports, resistances and use whatever indicators and the trade can still go against you.
It was monthly expiry, so I was expecting short covering yesterday or today and it happened after NSE glitches has been cleared out.
Normally if the one day before the stock or index has been moved largely, then the next day on gap up or gap down opening, selling starts at 9:30 ( because of profit booking).
If I were in your position, I would have entered long only when the days high is broken and sustained for atleast more than 10 mins.
Checkout the last Jan expiry chart also, same to same movements.
Always check the higher timeframes chart before trading in 5 mins chart, I know you entered in the fear of losing the opportunity to gain some points, but most of the big guys check one hr and 15 min chart.
When the BNF broke 37000, it was an indication that it will become resistance and many people starts selling aggressively.
The pattern mentioned has been repeated many times over the expiry days, so this should be your first pattern that comes to mind on expiry days ( with gap up).
In the chart, the Lower lows are made and the entry should be when the higher high is made .