Hello and welcome to the Weekly Market Metrics! I am Sandeep Rao, and we’re in Week 01 of the year— and yes, with that, 2026 arrives!
I hope you have all your resolutions written up on your walls. Personally, I chose a different strategy for 2026. I would have monthly goals instead of yearly. If I cannot do something consistently for a month, what sense does it even make to think about yearly goals?
Anyways, over to markets.

2025 marks a decade of positive returns on Nifty, something we have not seen since the index’s inception in 1990. That’s quite something, no?
It reminds me of this 2024 Tim Harford FT article, where he describes the market as being run by Loki, a Norse god of mischief who makes the price zig-zag wildly to trick you. However, Odin (the All-father and another Norse god) has set a rule: over any 30-year period, Loki must deliver an average return of roughly 7–10%. In the article, Tim goes on to explain why that works.
Back home to our markets. Well, we made a new all-time high this Friday. The last trading day of the year started with a good uptrending move, with the index up about 191 points and 0.74%. That uptrend continued to the end of the week, marking a 286-point rally.
Remember in the WMM W51 episode, I spoke about the Santa Rally? Well, it did play out as expected. 26th December close was at 26,042, and this Friday closed at 26,329—an upmove of 287 points. As they say in Hindi, Bhagwan ke ghar der hai, andher nahi.
With that, let’s check the charts and see how the price action played out. Now, since this is a month and year-end episode, we will look at how December and the year 2025 fared. We’ll also look at what is possible in the coming week.
I have a lot of things to talk about, so better get your coffee or chai.
NIFTY: A Decade of Uninterrupted Green
Yearly Performance
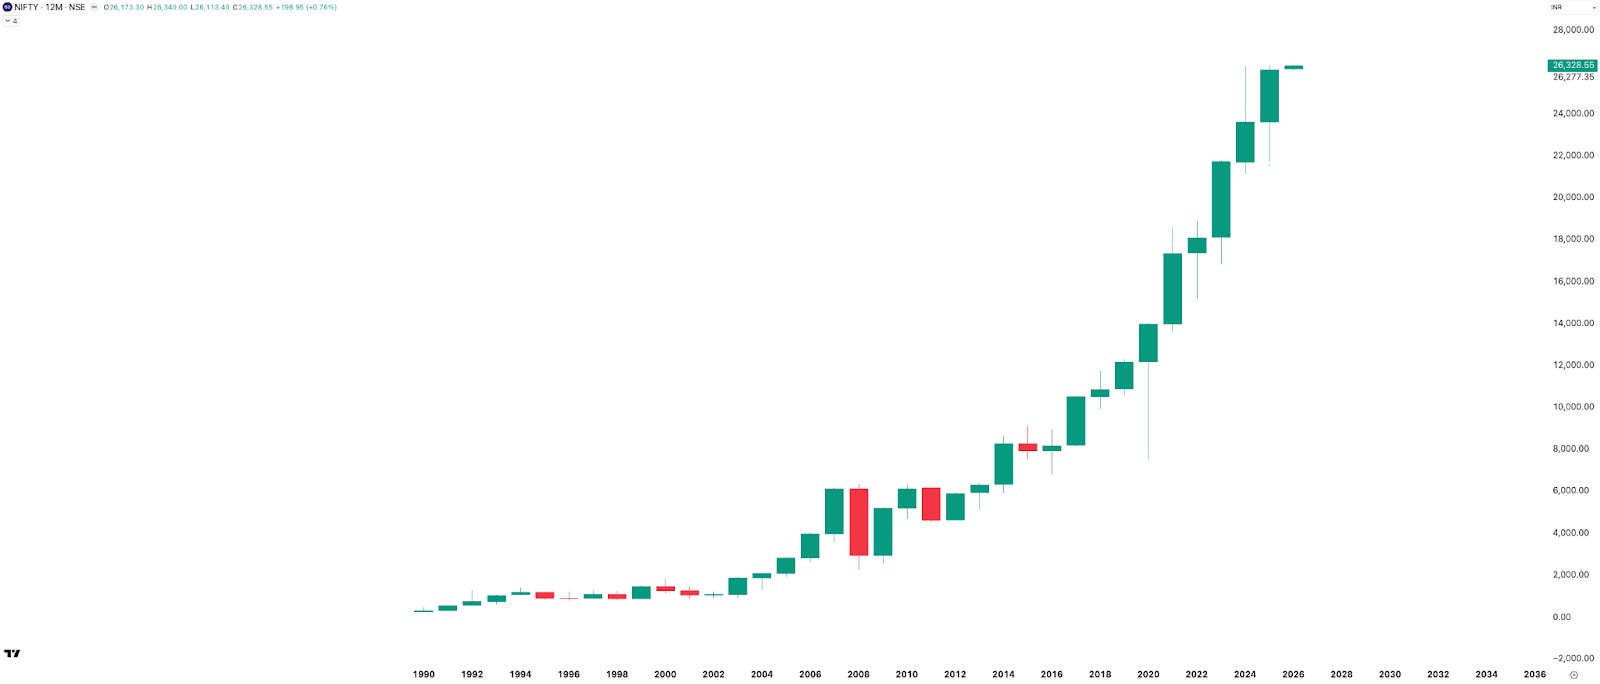
Let’s look at the NIFTY yearly chart. For 10 straight years, NIFTY has closed green—positive returns every single year. From 2016 to 2025, NIFTY is up 229% in absolute terms.
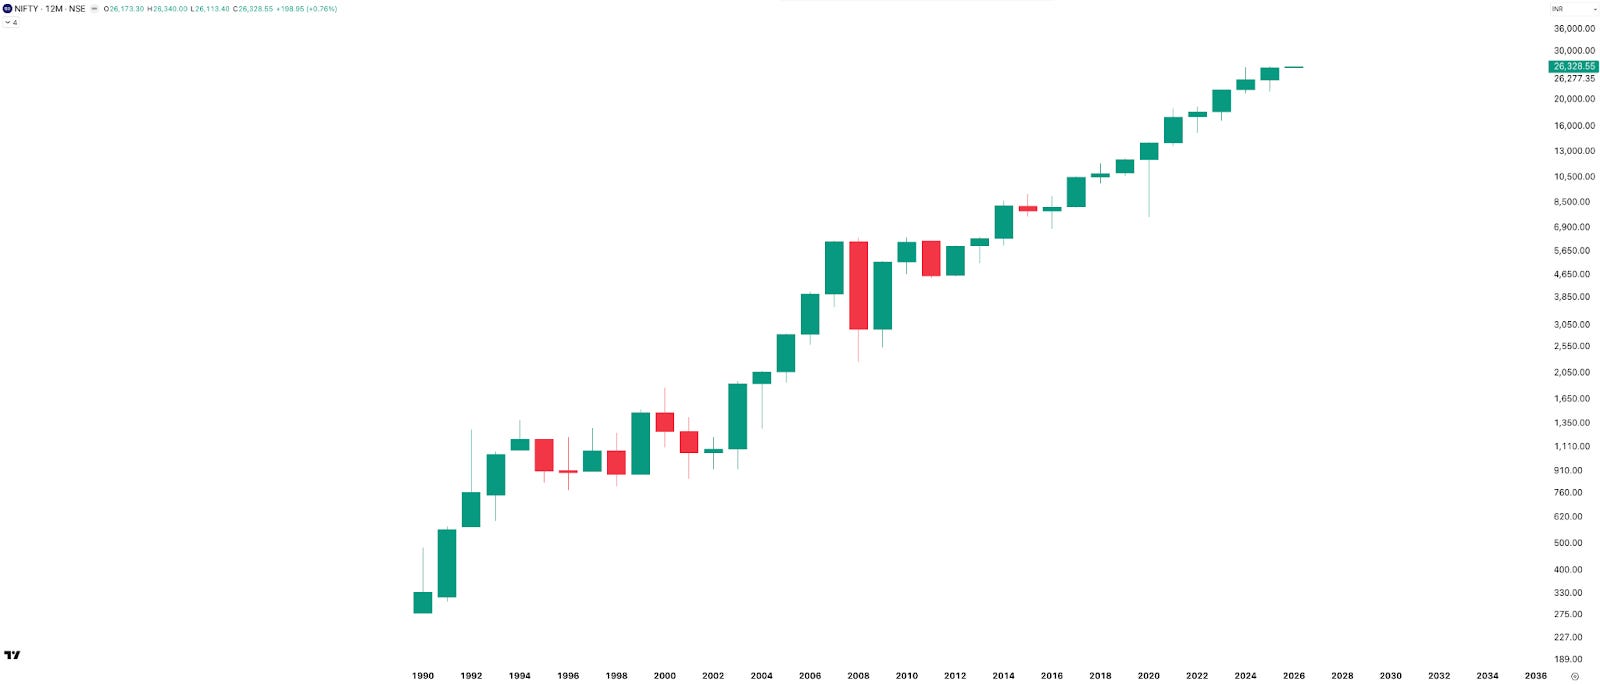
Also, look at the same chart on a logarithmic scale—you’ll see a much smoother, more consistent uptrend. Log scale matters for long-term analysis because it shows percentage growth, not absolute points. It helps you see real growth over time, without recent years looking bigger just because prices are higher. I’ll explain log scale in detail and why it matters in a future video.
Risk-Adjusted Returns Analysis
After seeing these charts, I decided to look deeper. I analyzed NIFTY’s yearly risk-adjusted returns. It’s a simple metric: Calendar Year Return ÷ Maximum Drawdown of that year. This shows how much return NIFTY delivered for every unit of risk taken.
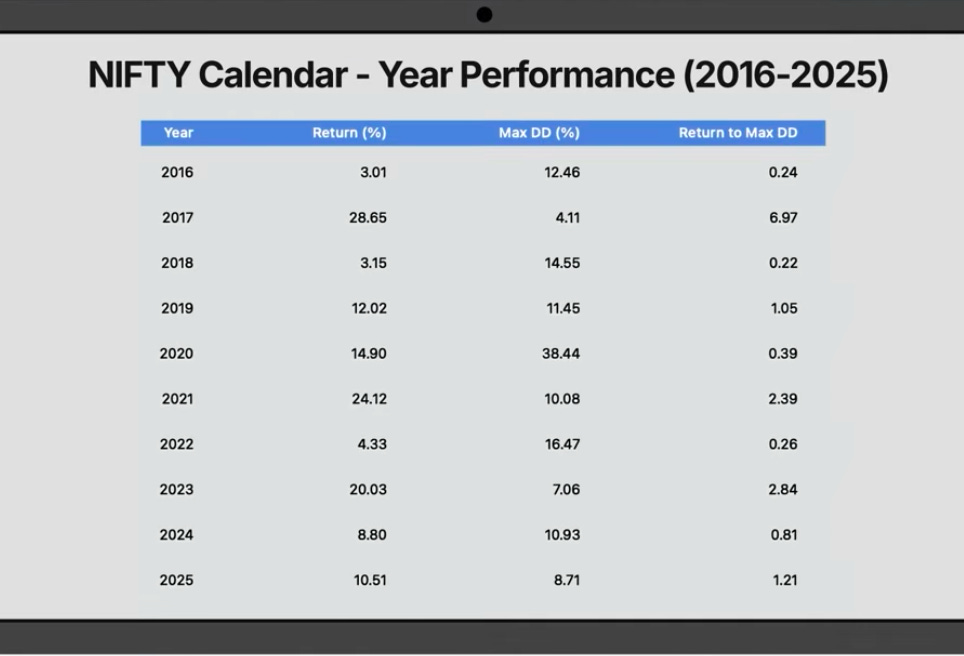
The mean risk-adjusted return is 1.64, while the median is 0.93, showing that a few strong years drive the average. Standout year was 2017—massive returns with minimal drawdown, best risk-adjusted performance. 2021 and 2023 also delivered strong returns with controlled risk.
On the flip side, 2020 had decent returns but extreme drawdowns. 2025 with 1.21 is above median but below average, so it was a kind of okay-ish year.
So what’s the takeaway? Returns matter, but how much pain you take to earn them matters more.
Monthly Seasonality
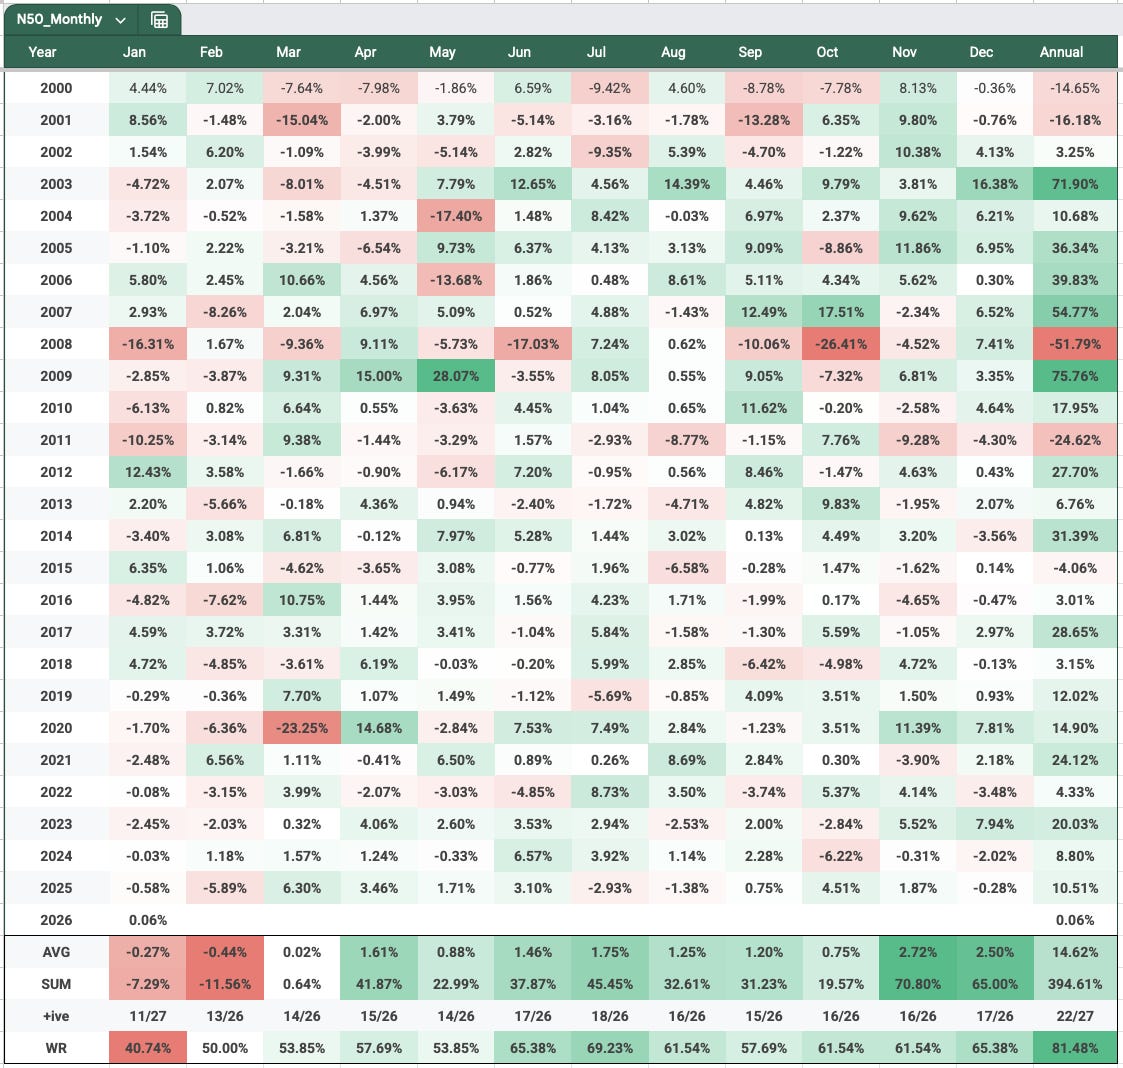
With December done, let’s look at NIFTY’s monthly seasonality chart. December is a historically strong month, yet this time it closed red again—making it 3 out of the last 4 Decembers in the red.
Now we move into January. January is one of the weakest months historically—the lowest win rate at ~41% and a negative average return. Even more interesting is the fact that 7 out of the last 7 Januaries have all closed red. That’s some consistency.
So will the same streak continue, or do we finally see a green January? I’m leaning towards a green close this time—but you know my track record with predictions. Maybe the year changes… and so does my luck with predictions.
Weekly Timeframe
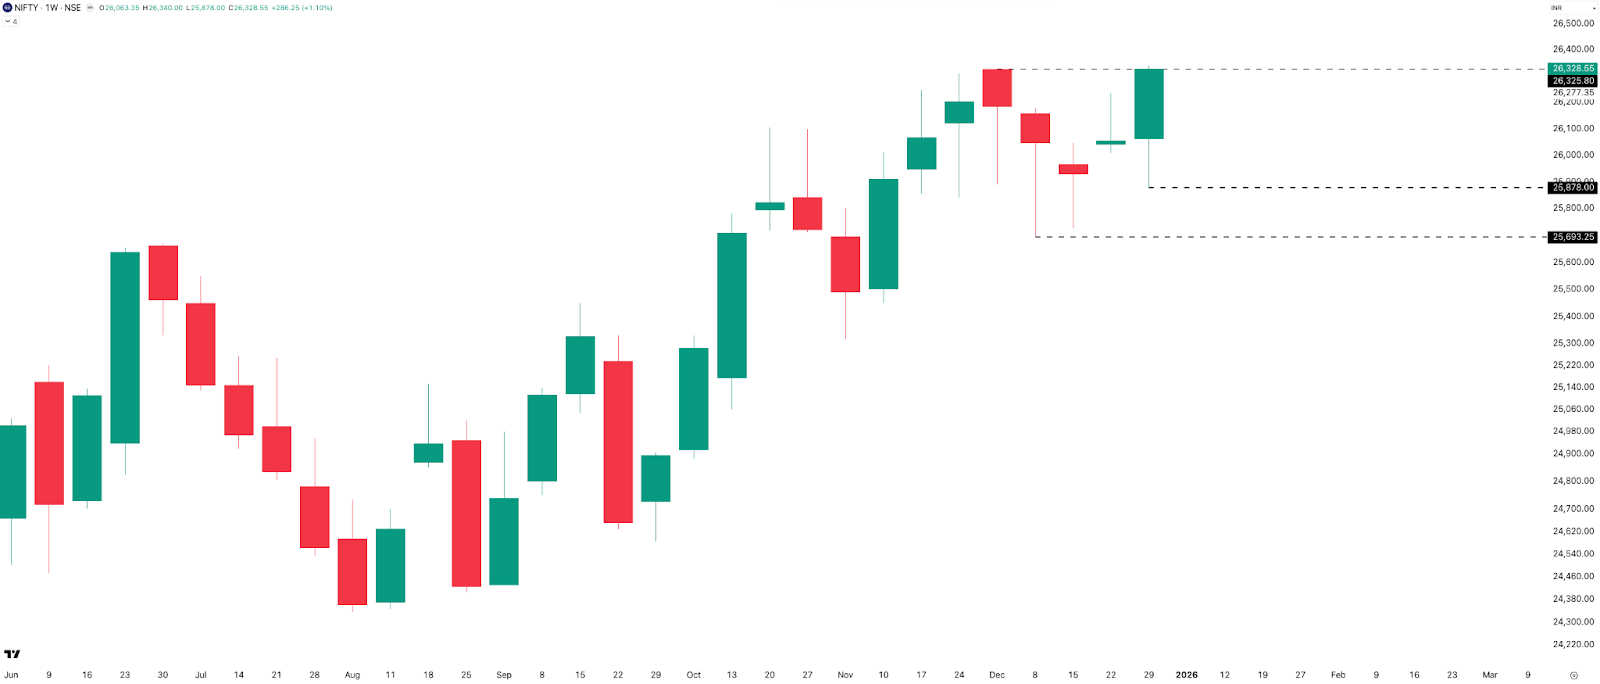
Looking at the NIFTY weekly chart, we finally saw a new all-time high this week. NIFTY broke out of the 25,700–26,200 range and closed at 26,329, decisively above the previous high of 26,325. For the week, it gained 286 points, up 1.1%.
With the price at a new ATH, there is no overhead resistance. On the downside, 26,300 is the immediate support, followed by this week’s low at 25,878, and a deeper support zone near 25,700.
Daily Timeframe
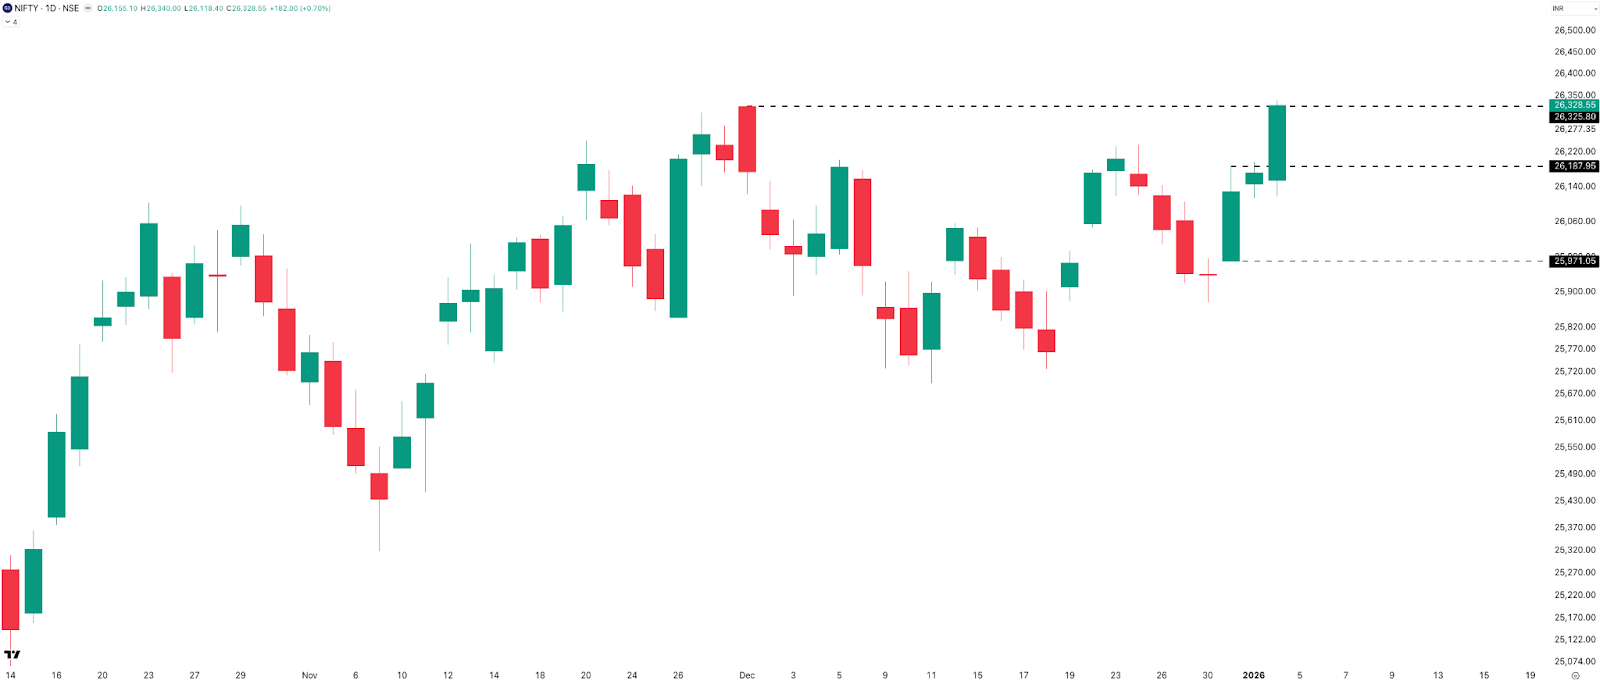
On the daily timeframe, NIFTY printed two red candles on Monday and Tuesday, followed by three green candles from Wednesday to Friday. Among them, Wednesday and Friday were strong, decisive candles.
On the downside, 26,300 is the first support, followed by 26,200, and then 26,000. With prices at fresh highs, there is no resistance on the daily chart as well.
Hourly Timeframe
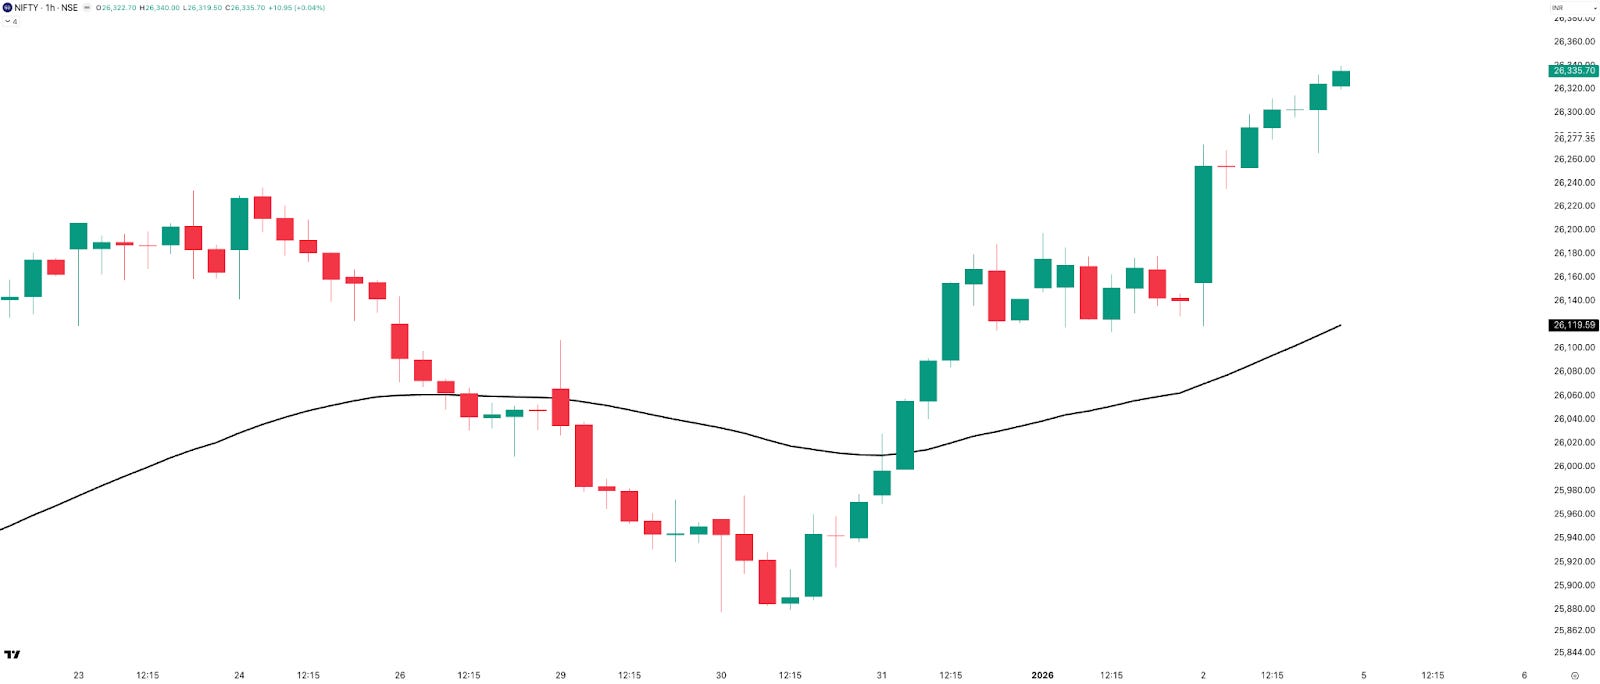
On the hourly chart, NIFTY stayed below the 50 EMA until Tuesday. After that, on Wednesday, the price moved decisively above it and stayed strong. Currently, the gap between price and the 50 EMA is 216 points, or 0.83%. The hourly chart bias remains strongly bullish, supported by Friday’s solid close and NIFTY ending the week at a fresh all-time high.
Expected Range Till Expiry
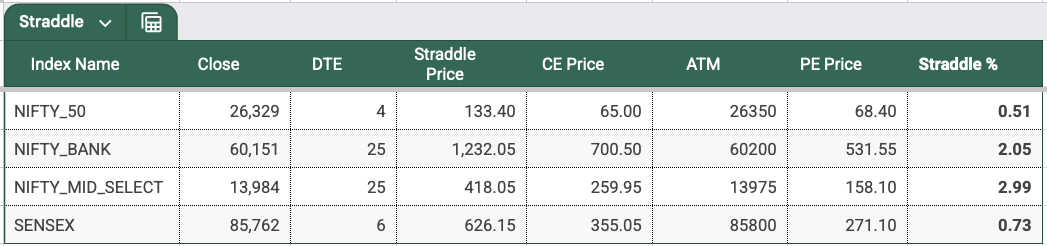
Talking about NIFTY’s expected range into the coming Tuesday, 6th January expiry: Based on options data, the ATM straddle closed around 133 points, slightly up from 128 points last week, indicating lower expected volatility.
With NIFTY spot closing near 26,329, the implied expiry range comes to:
- Upside: 26,329 + 133 = 26,462
- Downside: 26,329 − 133 = 26,196
Open Interest Analysis
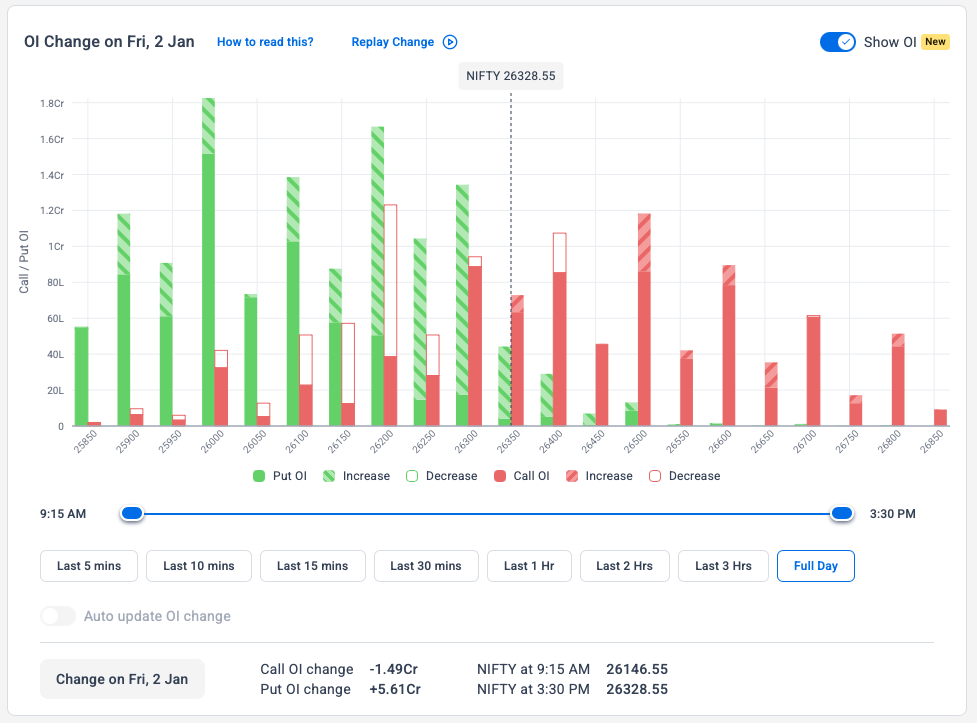
Looking at the open interest data, on the put side, 26,000 PE, 26,200 PE, and 26,300 PE hold the highest OI—indicating strong support in this zone. On the call side, 26,500 CE has the highest open interest. This level also aligns with the range projection, making it a key upside reference.
Notably, there has been heavy CE unwinding at 26,200 and 26,400, reducing immediate overhead pressure. The 26,200–26,500 zone is showing up repeatedly across multiple analyses, making it a critical area to track. That said, in highly liquid contracts like NIFTY, OI can shift rapidly. This data reflects current market positioning, not a guaranteed outcome.
SENSEX: NIFTY Takes the Lead
We looked at NIFTY’s yearly returns, so I compared NIFTY vs SENSEX to see which one actually outperforms. Even though all SENSEX stocks are part of NIFTY (with slightly different weights), NIFTY has 20 additional stocks.
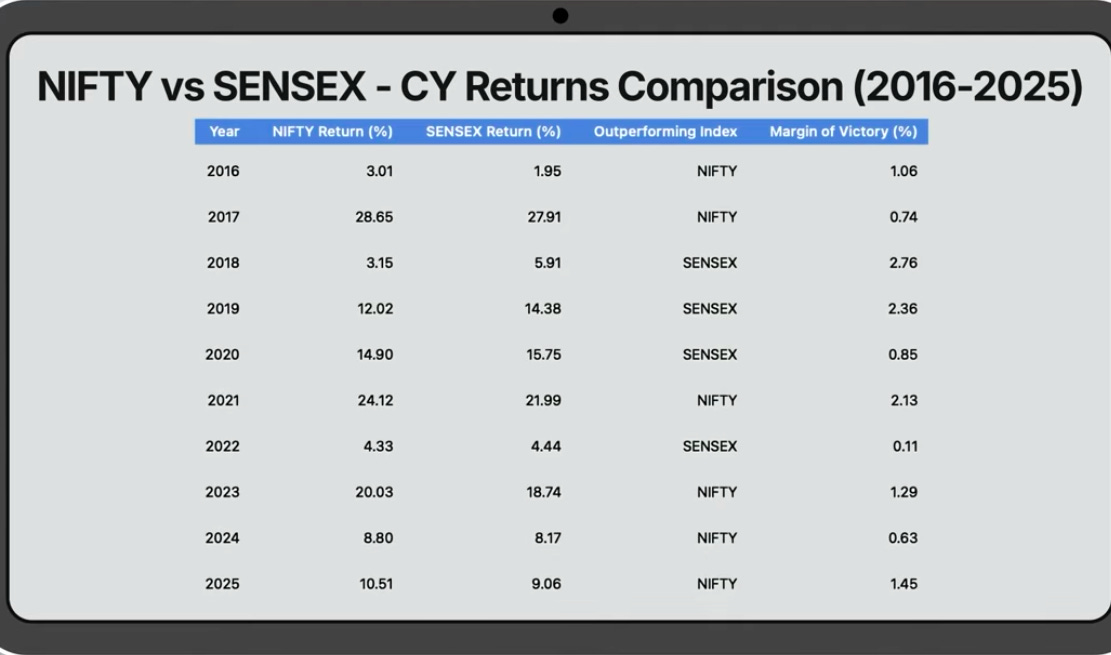
Over the last 10 years, NIFTY outperformed SENSEX 6 times. More importantly, in the last 3 consecutive years, NIFTY beat SENSEX with an average +1.12% higher yearly return.
What does this tell us? Most likely, the additional 20 stocks in NIFTY have contributed more to returns and driven the outperformance. If you know a more precise reason, do let me know in the comments—I would love to hear your take.
Weekly Timeframe
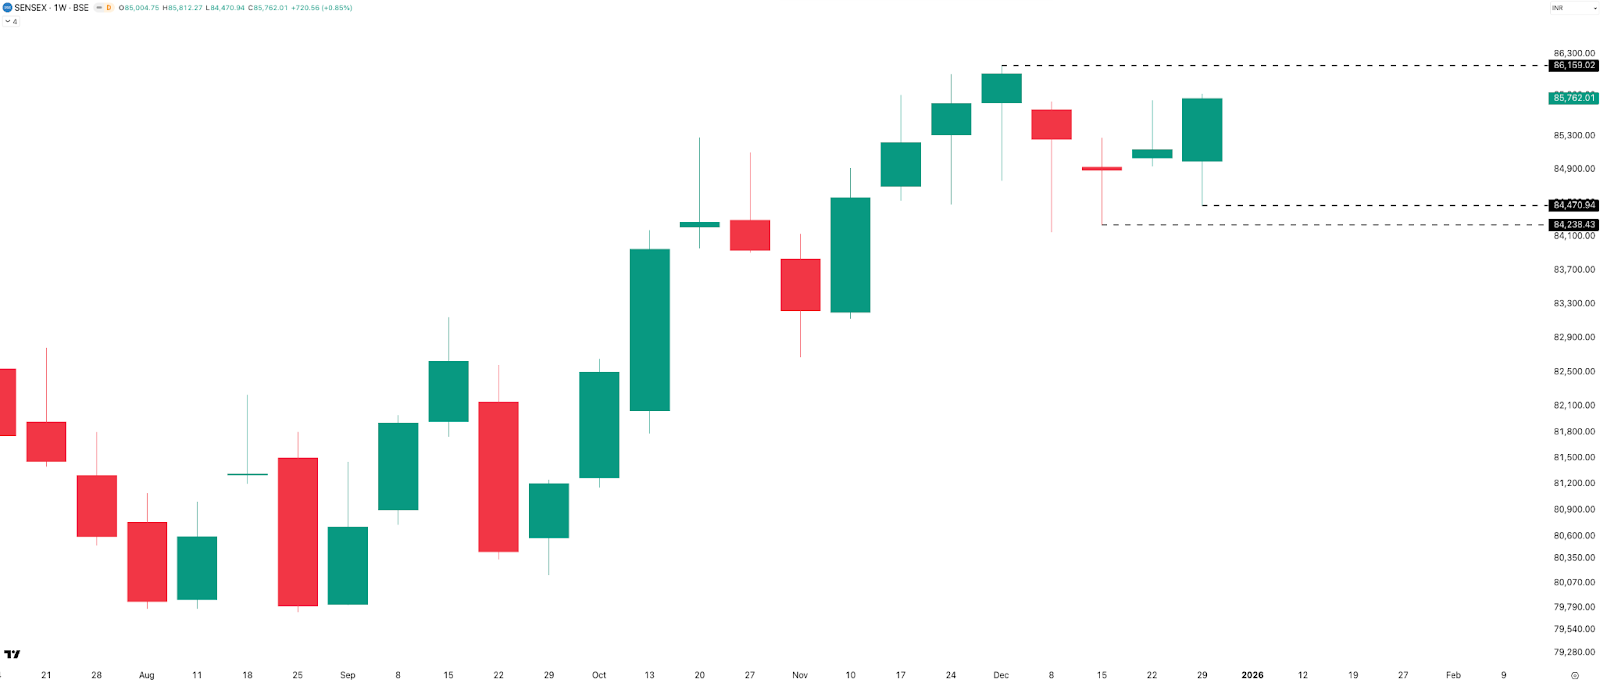
On the weekly timeframe, SENSEX added 721 points, or 0.85%, to close at 85,762. The weekly range expanded compared to the last two weeks, though SENSEX is still roughly 400 points, or 0.46%, away from its ATH. Resistance is at the ATH of 86,159, and support is at this week’s low in the 84,500 zone, followed by 84,200.
Expected Range Till Expiry

The next SENSEX weekly expiry is on Thursday, 8th Jan 2026. The ATM straddle closed around 626 points, almost unchanged from last week’s 621 points.
With the SENSEX spot near 85,762, the market is pricing in this expiry range:
- Upside: 86,388
- Downside: 85,136
That’s the expected move for the week as per options pricing.
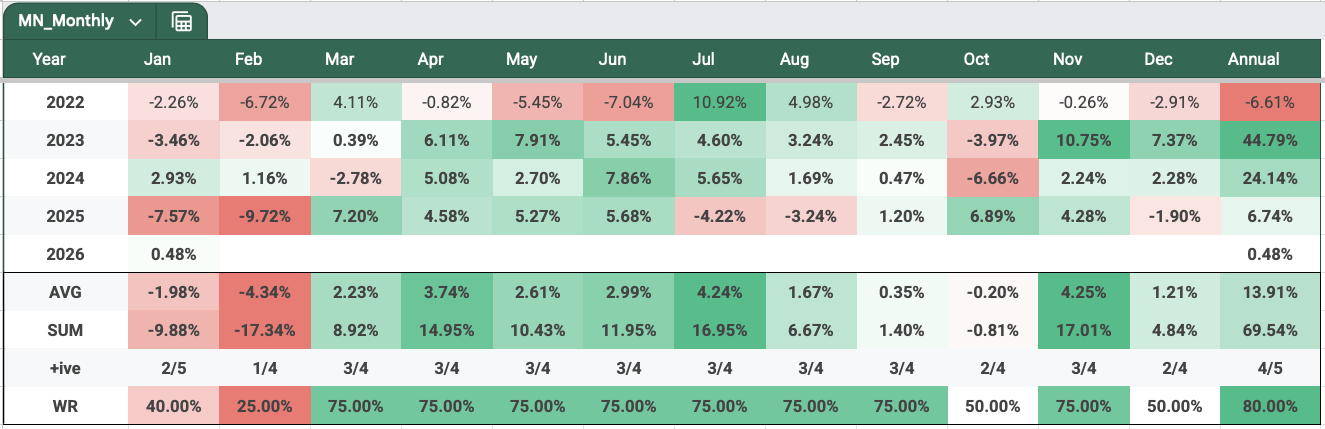
BANKNIFTY: Fresh All-Time Highs
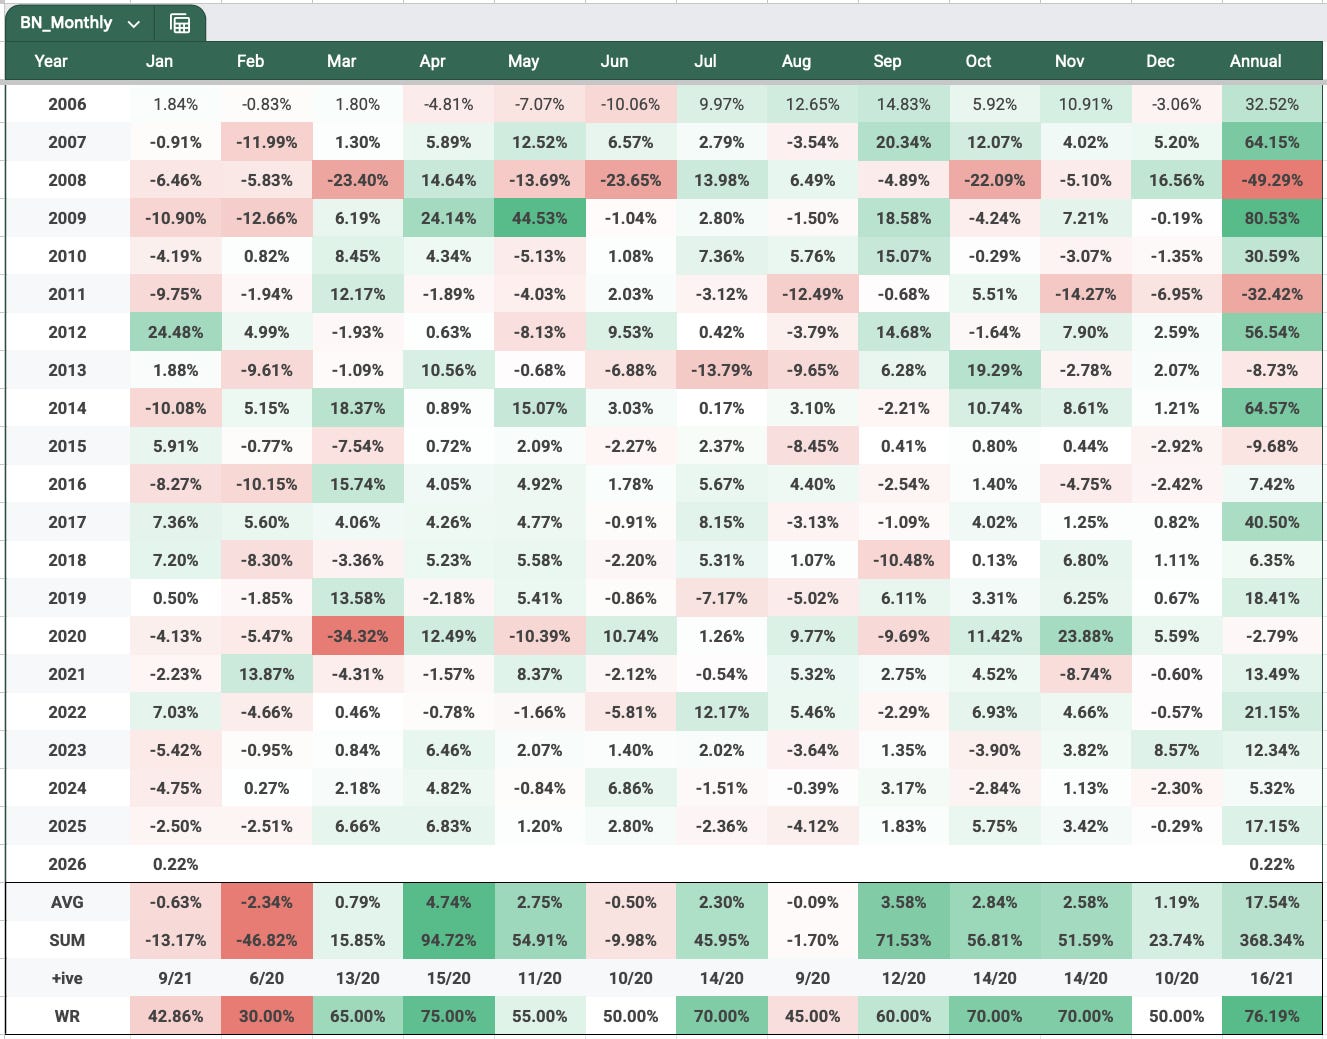
Looking at the monthly seasonality table, December closed red at -0.29%. January is historically a weak month—a 43% win rate and -0.63% average returns. After three consecutive red Januaries from 2023 to 2025, the big question is: Do we finally get a green January in 2026?
My bet is again on a green January close. With BANKNIFTY at a fresh all-time high, momentum is clearly strong, and that strength could carry forward into 2026.
Weekly Timeframe
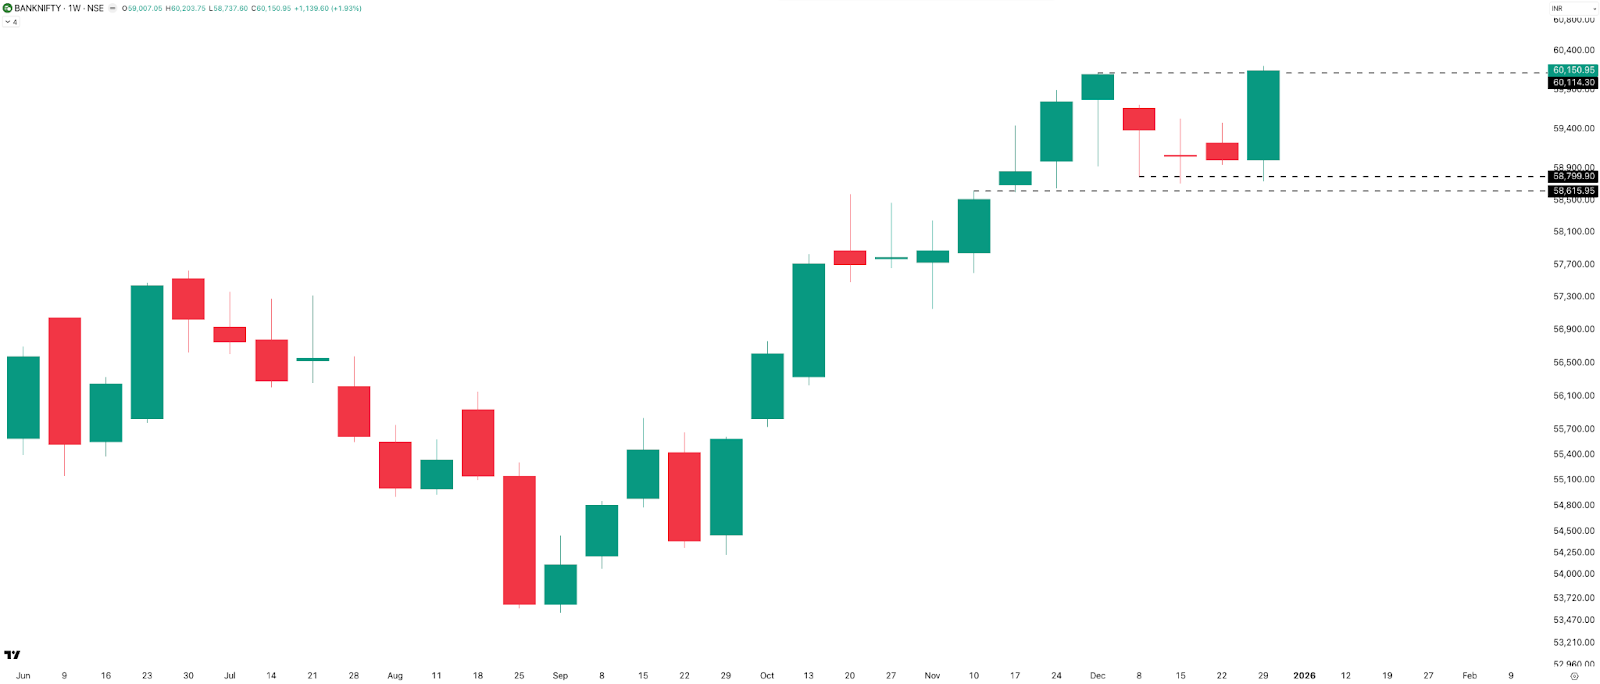
On the weekly timeframe, BANKNIFTY gained 1,140 points, up 1.93%, and closed at a fresh all-time high of 60,150. This week saw the highest range in the past 10 weeks. Key supports are placed at 59,000, followed by the 58,800–58,600 zone. With price at new highs, there is no immediate technical resistance.
Daily Timeframe
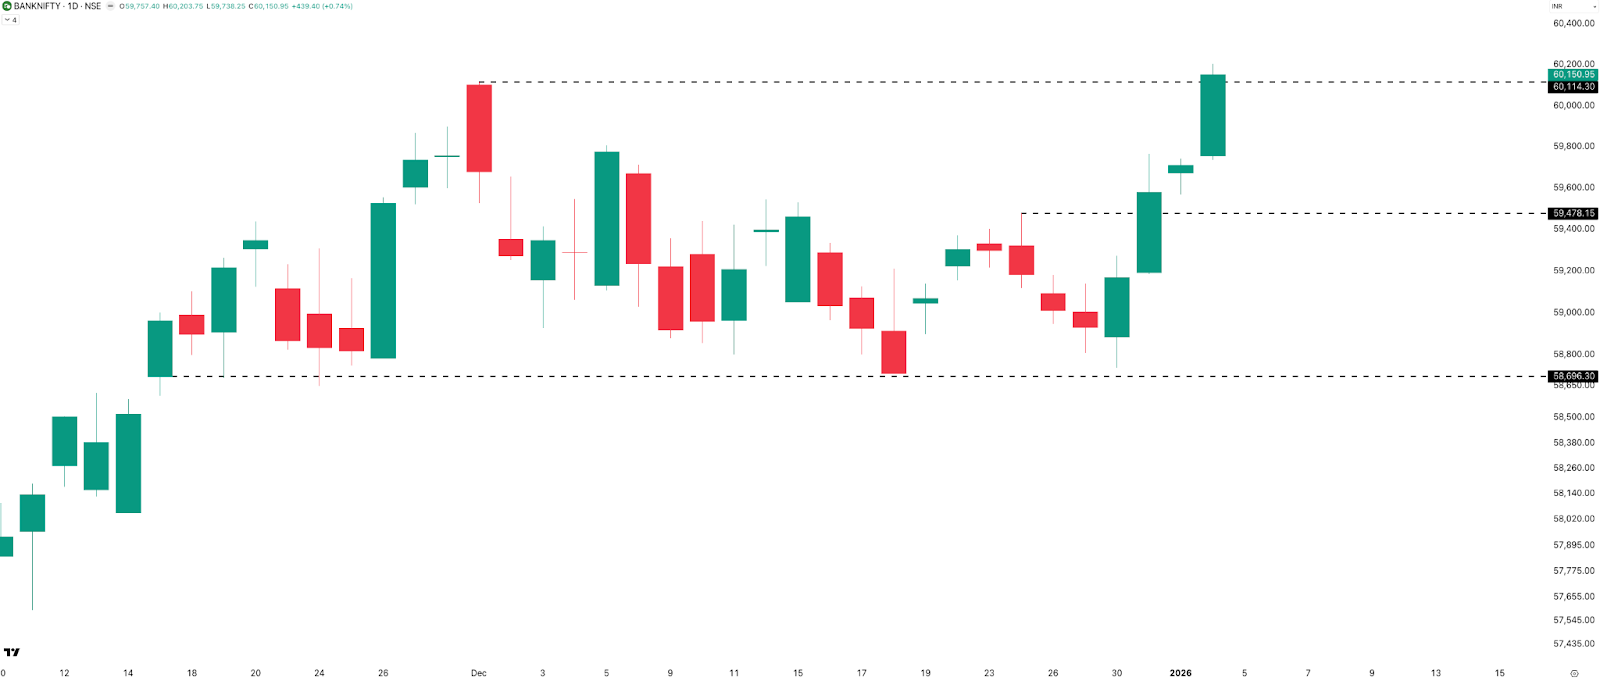
On the daily timeframe, four consecutive green candles and a strong Friday close at ATH keep the momentum bullish. Immediate support lies at 59,500, followed by a deeper support near 58,700.
Hourly Timeframe
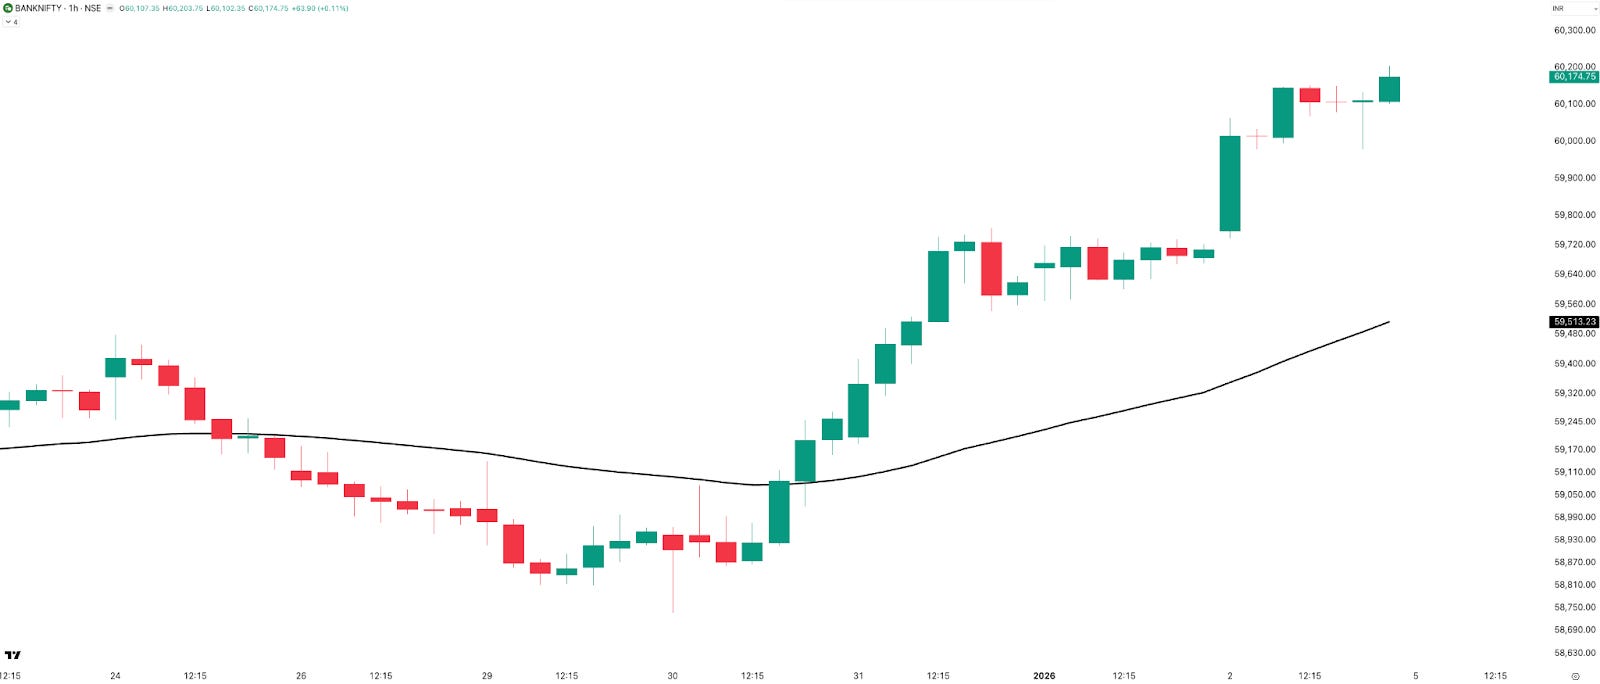
On the 1-hour chart, BANKNIFTY crossed above the 50 EMA in the second half of Tuesday and stayed above it till Friday’s close. The gap between price and the 50 EMA is 637 points, or 1.07%. This price action clearly points to a strong bullish sentiment.
MIDCPNIFTY: January Blues Ahead?
Looking at MIDCPNIFTY’s monthly seasonality, the picture is similar. January is the second-weakest month historically—just a 40% win rate and an average return of -2%. Let’s see what this year has in store.
Rate of Change: Green Across the Board
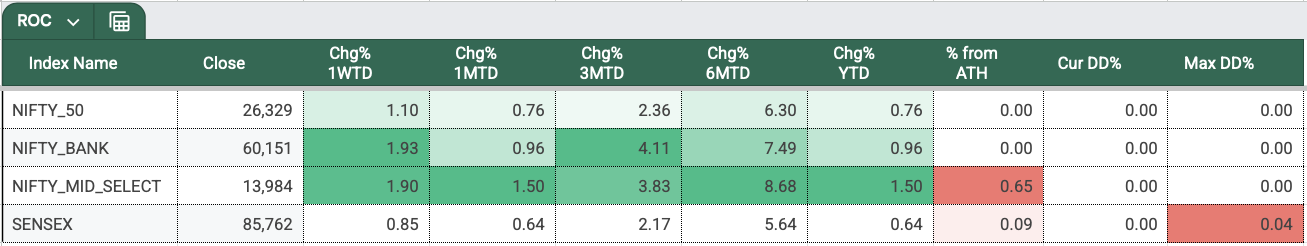
We are in the first week of 2026, and we are off to a great start with all indexes in green. BANKNIFTY gained about 1.93% for the week, followed by Nifty Mid Select at 1.9%, then Nifty at 1.13%, and Sensex trailed at 0.85%.
Sectoral Performance: Metals Continue to Shine
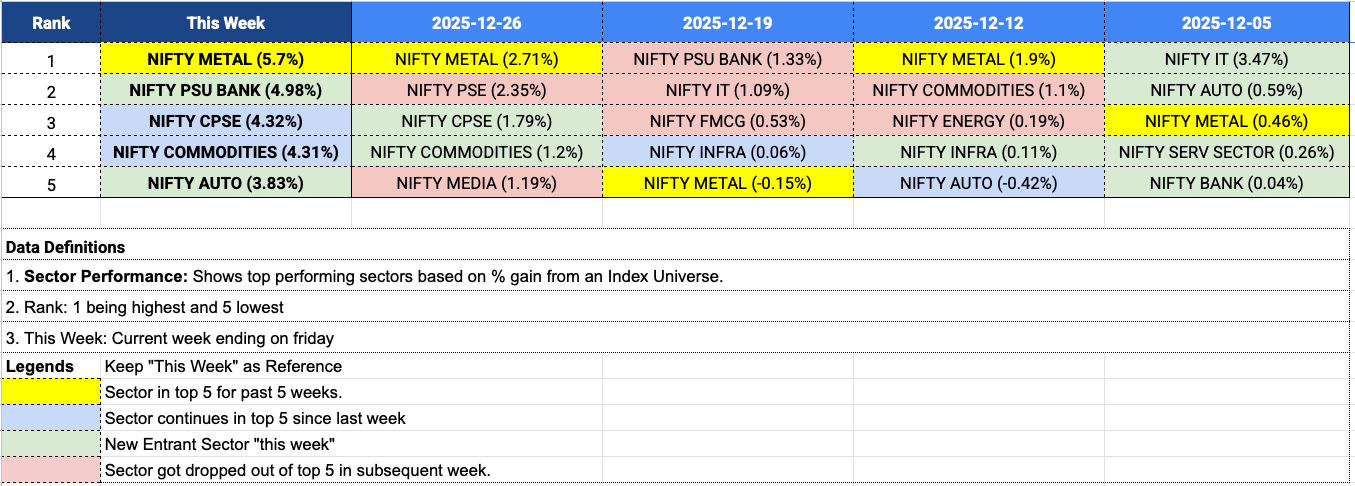
Talking about the top sectors this week, Metals continue to shine—it’s been six weeks now. It’s up 5.7% this week. Like I said last week, maybe 2026 is the year of metals—you never know.
NIFTY Commodities and Nifty CPSE continue from last week, both up about 4.3%. There are two new entrants this week, with PSU Bank up 5%, followed by Nifty Auto at 3.8%. That’s about it for the sectors.
Range Expansion and Expiry Review
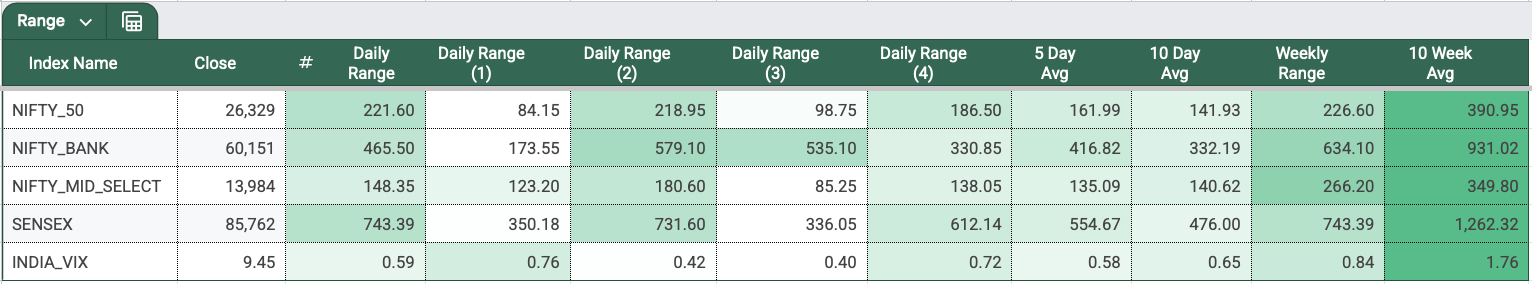
NIFTY printed its narrowest range day on Thursday, 1st Jan (Daily Range-1), followed by the widest range day on Friday. The same pattern showed up across BANKNIFTY, MIDCPNIFTY, and SENSEX—a tight Thursday followed by an expansion on Friday. As a result, NIFTY’s 5-day average range jumped to 162, up from 122 last week—clear range expansion after compression.
Now, let’s talk about the NIFTY expiry. Tuesday’s NIFTY monthly & quarterly expiry saw an extremely narrow 99-point range, with the ATM straddle opening around 80 points. The index chopped multiple times within the same range, making position management difficult for option writers. Despite the narrow move, the very low premium created an unfavorable risk-reward, making this expiry far from easy.
Thursday’s SENSEX expiry stayed in a narrow 350-point range. The ATM straddle opened near 242 points, making it look difficult for option writers. But the low premium reflected low volatility. Despite intraday chop, the expiry was smooth and manageable, turning into a good day for option writers and a strong start to the year.
INDIAVIX: Ticking Upward
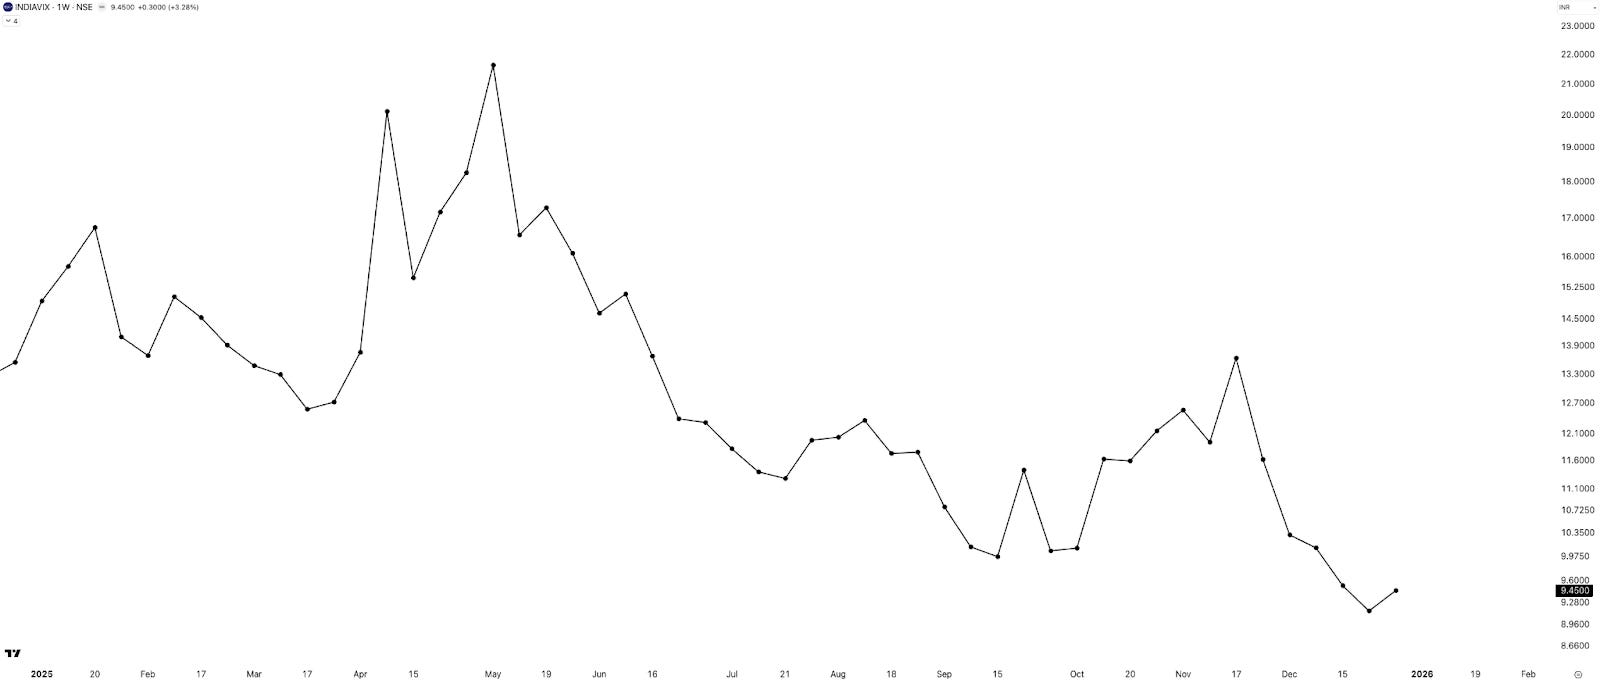
INDIAVIX ticked up 3% to close at 9.45. With the Union Budget just a month away, volatility is likely to pick up. I’m expecting VIX to rise in the coming weeks—let’s see how it plays out.
Commodities: Silver and Copper Lead the Pack
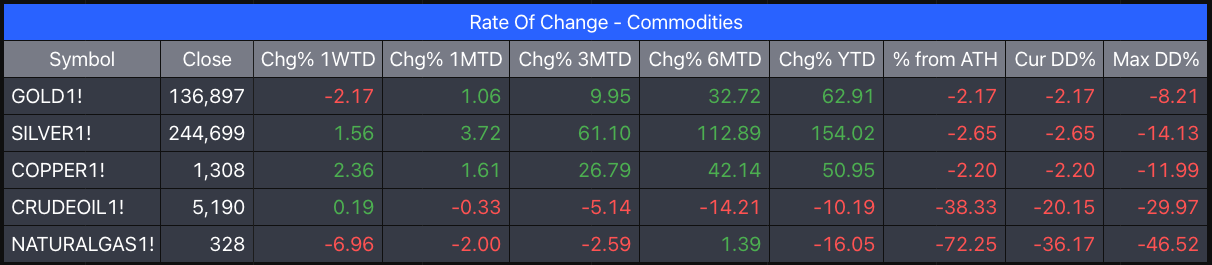
(Data: MCX Continuous Futures - Back Adjusted)
In the commodity space, on a YTD basis, Silver was on top at 154%, then we had Gold at 63%, and lastly Copper at 51%. Crude oil and Natural gas were negative at -10% and -16%, respectively.
Talking about the current week, Copper is leading at 2.3%, then we have Silver at 1.5%, and Crude at 0.2%. Gold and Natural Gas are in red at -2% and -7% respectively. I have been talking about keeping a short bias in Natural Gas for a while now. Talking about metals, I have an interesting read about Copper which I will share later. Maybe in the commodity supercycle, it’s Copper’s turn now.
In Summary
Markets kicked off 2026 on a strong note, with NIFTY and BANKNIFTY ending the week at fresh all-time highs, supported by expanding ranges and improving momentum.
Volatility picked up after mid-week compression, visible across all major indices, while option-implied ranges remained modest, keeping premiums low and risk-reward selective for option sellers.
BANKNIFTY and Metals led performance, signaling leadership from cyclicals, while broader participation stayed measured. VIX remains low but is ticking up, and with key events like the Union Budget approaching, conditions are slowly setting up for higher volatility ahead.
Overall, the tone is bullish but contained—momentum is strong. As always, risk management remains key as the year unfolds.
What Caught My Attention This Week
First , I came across this chart—2025 Cross-Asset Winners & Losers. Guess it’s from a report published by Merrill Lynch, now a part of Bank of America. It shows returns from across assets and across markets for the year 2025.
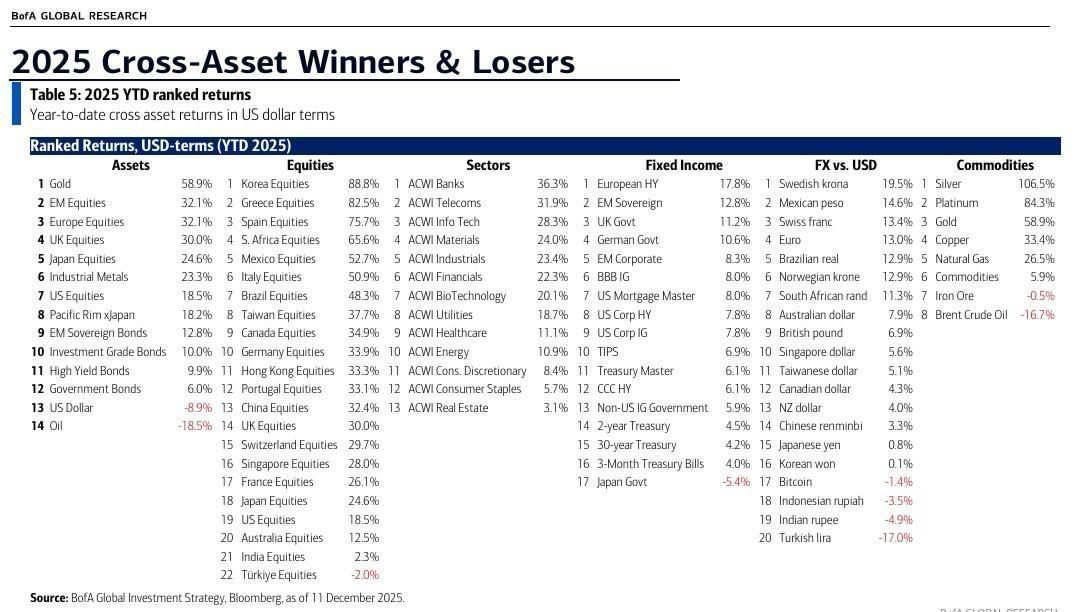
India lagged at 21st rank with Korea Equities leading this year. In Sectors from an ACWI (All Countries World Index), Banking was top, similar to what we saw in India. In Commodities, it was obviously Silver that stole the show.
Second , talking about metals, I came across this CNBC US article about Copper and its positive outlook for the year 2026. It’s AI-driven demand and supply constraints that’s leading the upmove. Must read if you want to take a bet on this metal or related stocks:
Lastly , a very relevant post by Nick Maggiulli from the Of Dollars and Data blog, who has this year-end post titled “Pray for Beta, Not Alpha.” As a strong believer in passive investing—to capture beta—I agree with Nick. Nick also says it’s better to focus on things in life like careers, savings, and health, where we have better control.
At the same time, as someone who has been active investing and trading for decades, while I agree with Nick broadly, I also think if markets interest you, there are indeed ways to create a layer of alpha while doing all that Nick asks you to do. So it boils down to what interests you.
What to Expect in the Coming Week
Next week is a full five-day trading week, and there are no major events lined up. Talking about the markets, the overall sentiment remains strongly bullish. On commodities, it’s worth keeping an eye on Copper and the Nifty Metals index.
And with that, we wrap up this week’s and the first Weekly Market Metrics for the year 2026.
If you find this series useful, don’t forget to subscribe to the channel.
Until then—stay curious, stay steady, and enjoy your weekend.