Hello and welcome to the Weekly Market Metrics! I am Sandeep Rao, and we’re in Week 02 of 2026.

It’s just one week in, and DJT has already kicked up a storm. Referring back to an article about the state of the India-US Tariff deal I had shared in the W51 episode, it seems the US is bent on having its way, and markets are feeling the heat.
As for price action, the year is off to a rocky start with all indexes breaking important support levels. A disappointing departure from the bullish outlook many, including us, had for the new year.
Anyways, let’s check the charts and see how the price action played out. We’ll also look at what is possible in the coming week.
NIFTY: Down the Elevator
Weekly Timeframe
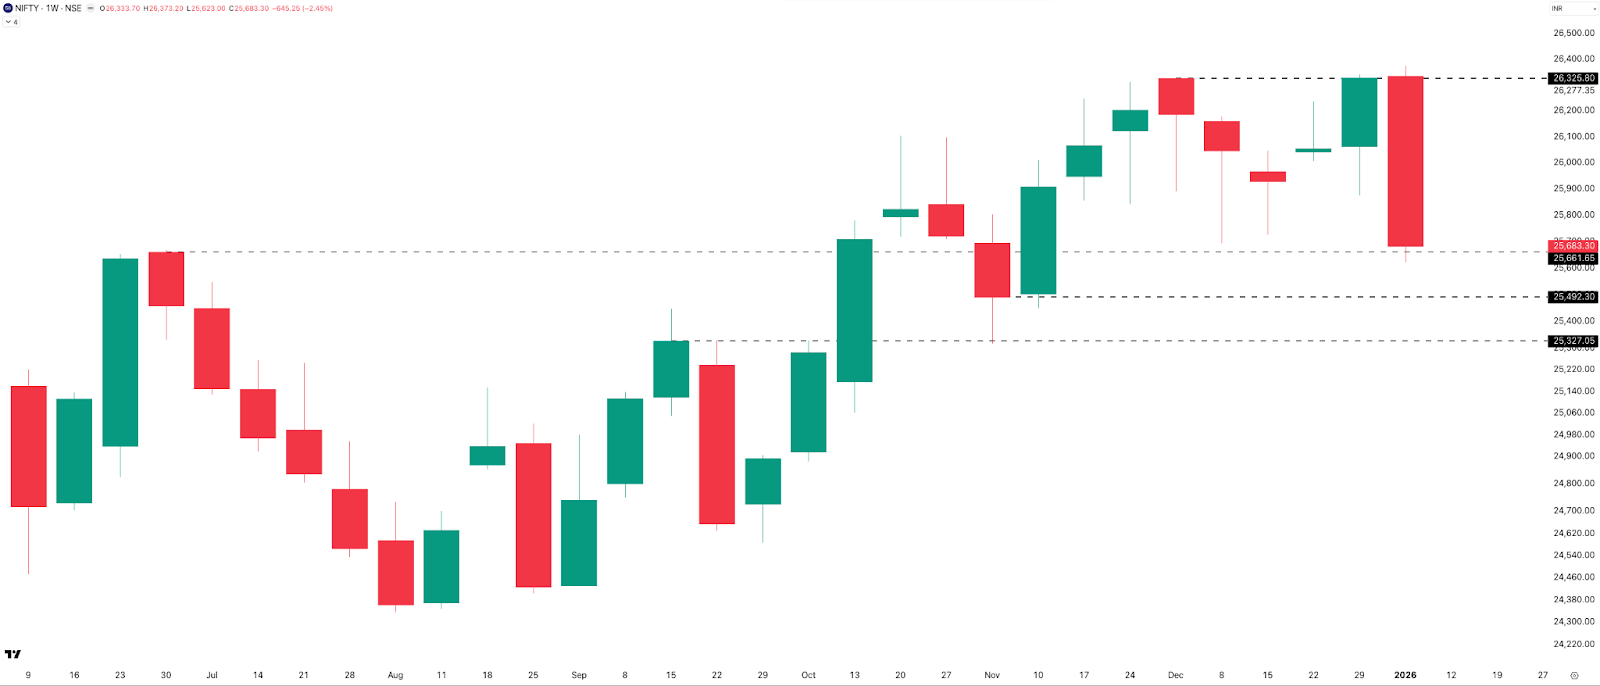
After making a new all-time high last week, NIFTY saw a strong downside expansion. Markets go up the stairs and come down the elevator. This week proved it. This week’s candle engulfed the last 7 weekly candles, signaling a clear shift in momentum.
For the week, NIFTY fell 645 points, down 2.45%. The weekly range was nearly 2x last week’s range. NIFTY took some support around the 25,650 level during the last hour on Friday and closed the week at 25,683.
Immediate downside support now lies in the 25,500–25,300 zone. When the price is moving lower rapidly, resistance levels are not relevant this week. Last week, there was no overhead resistance due to ATHs. This week, I am saying resistance doesn’t matter.
That’s how fast markets flip. The bias for the coming week is bearish till we at least cross the 26,000 levels.
Daily Timeframe
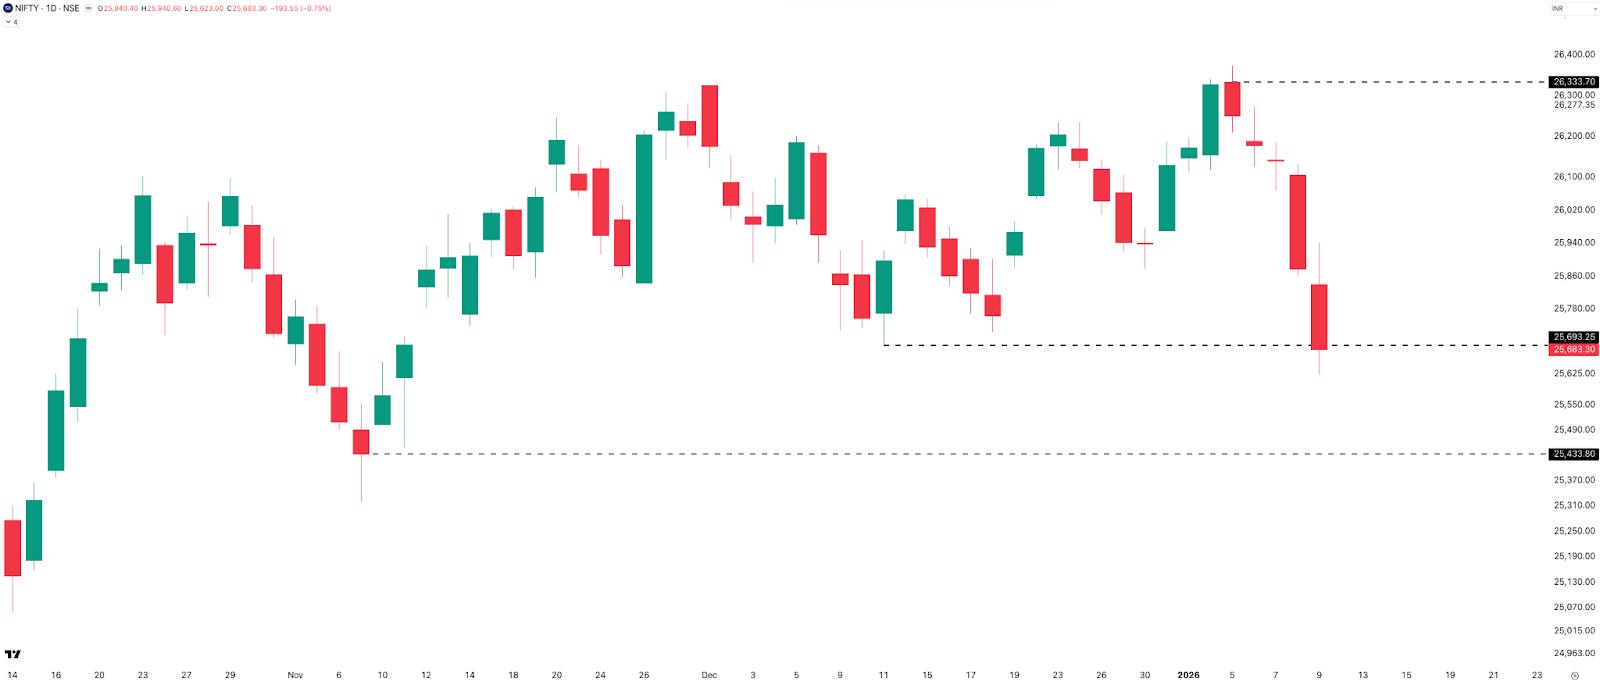
On the daily timeframe, NIFTY printed five consecutive red candles this week, with Thursday and Friday showing strong downside momentum. The index broke all the key daily supports discussed last week, including 26,200 and 26,000, confirming a clear breakdown in structure.
On Friday, NIFTY nearly closed at the 25,700-25,650 support level. It will be important to watch whether the price holds and reverses from this zone or breaks below and extends the decline. If 25,650 fails, the next major support lies around the 25,400 zone.
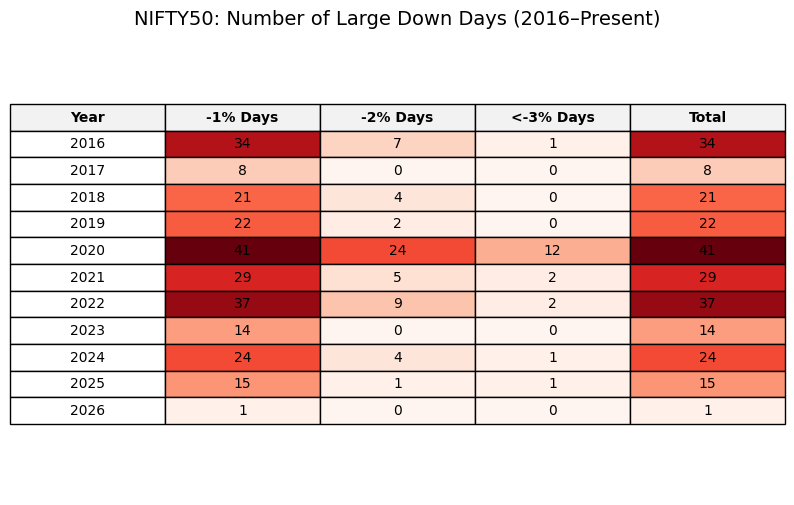
With markets being down for the past five days, I just looked up how common are 1% and greater than 1% drawdown days and here is what I figured: 2025 was not that bad, and I hope 2026 stays in that 15-20 day range.
Hourly Timeframe
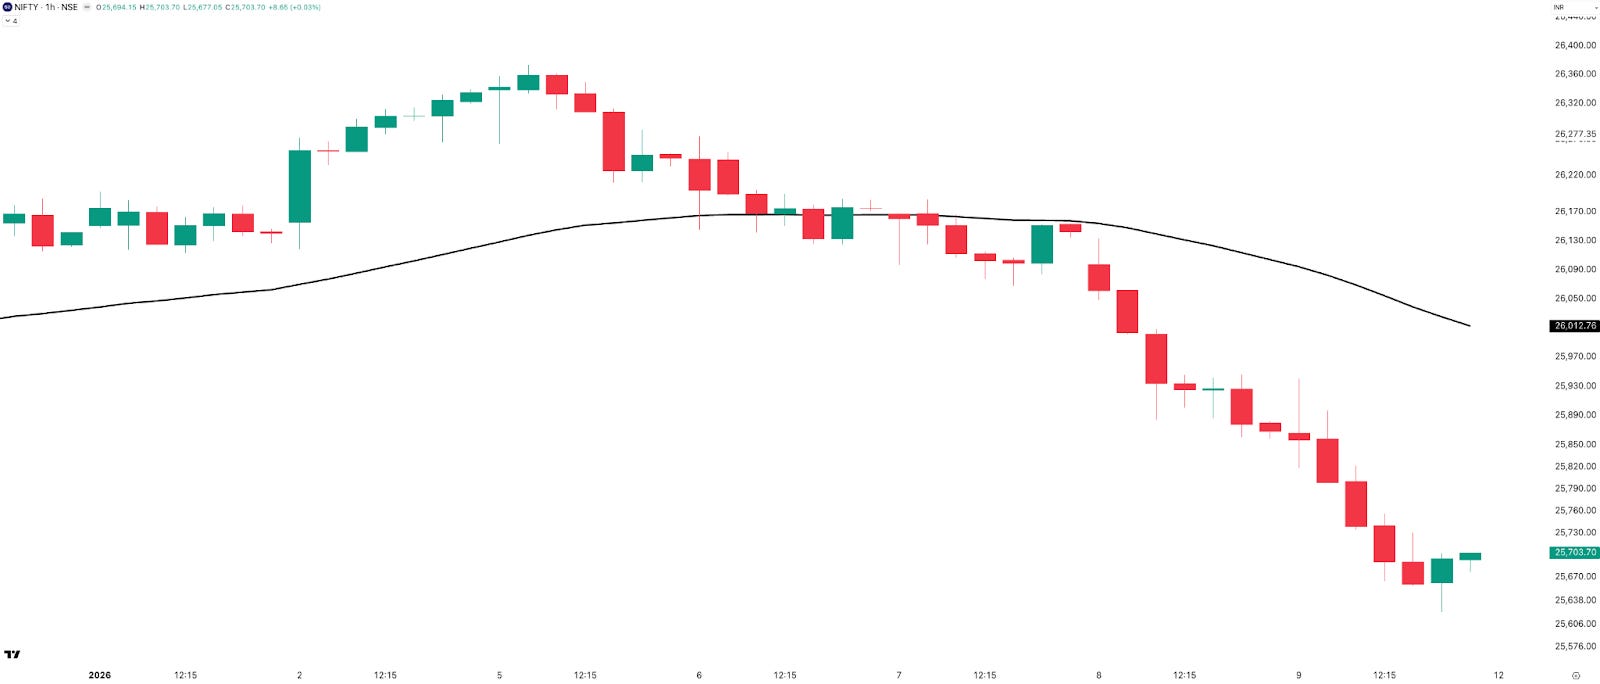
Moving on to the hourly timeframe, NIFTY held above the 50 EMA until Tuesday. Price then chopped around the EMA on Wednesday, before breaking decisively below it on Thursday and remaining below since.
At present, the gap between price and the 50 EMA is 310 points, or 1.21%, reflecting strong downside momentum. Will price catch up to the EMA, as it mostly happens in short-bias phases, or will this time be different? Your guess is as good as mine.
When the markets are going down the way they have been for the past week, long-only portfolios obviously bleed. I am reminded of something Neils Kaastrup Larsen said in a podcast with me, and to quote him: “Trend following is one of those truly non-correlated return streams. And that’s the beauty and the reason why trend following should be in all portfolios, in my opinion.”
I couldn’t agree more. By the way, the full episode comes out tomorrow on the channel. Do watch it.
Expected Range Till Expiry
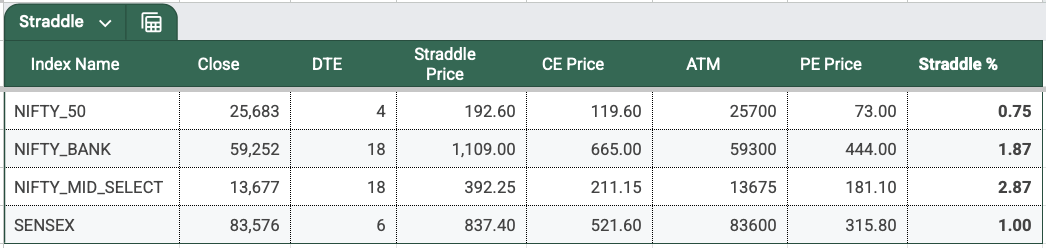
Moving to NIFTY’s expected range into the coming Tuesday, 13th January expiry: Based on options data, the ATM straddle closed around 193 points, up 60 points or 45% from last week. The sharp downmove spiked the straddle premium, and options writers will be happy to see better premiums after a long time.
With NIFTY spot closing near 25,683, the implied expiry range comes to:
- Upside: 25,876
- Downside: 25,490
That’s roughly 0.75% on either side.
Open Interest Analysis
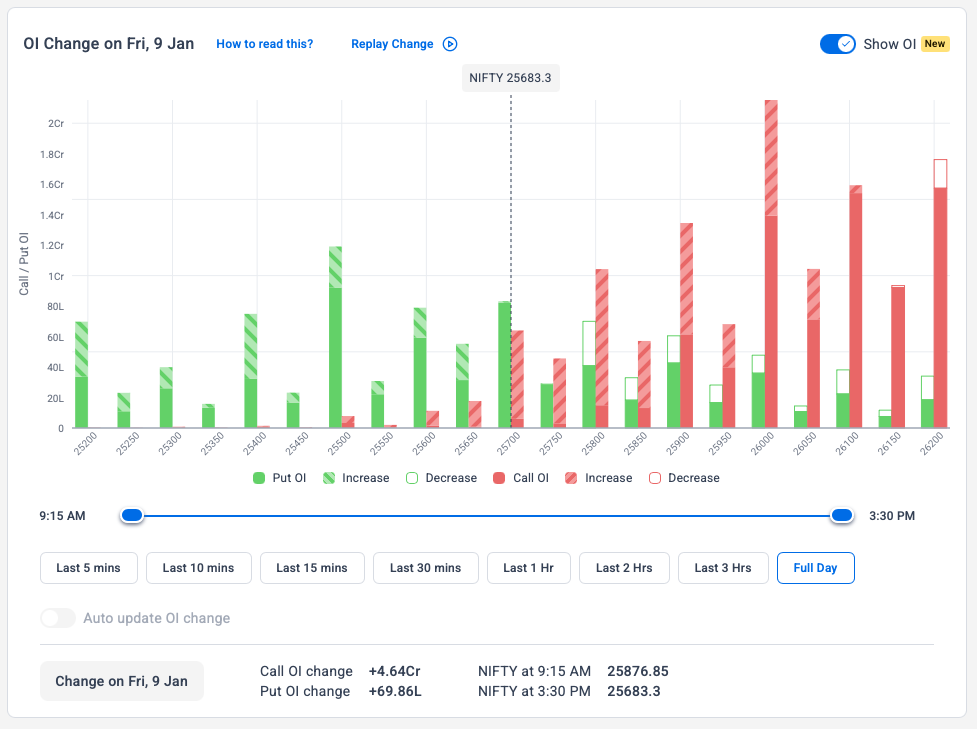
Looking at the open interest data, on the call side, 26,000 call, 26,200 call, and 25,900 call hold the highest open interest. On the put side, 25,500 put is the only strike showing meaningful open interest and has the highest OI.
Notably, there has been PE unwinding from 26,200 down to 25,800. The 25,900–25,500 zone is showing up repeatedly across multiple analyses, making it a critical area to track.
SENSEX: Breaking Support Levels
Weekly Timeframe
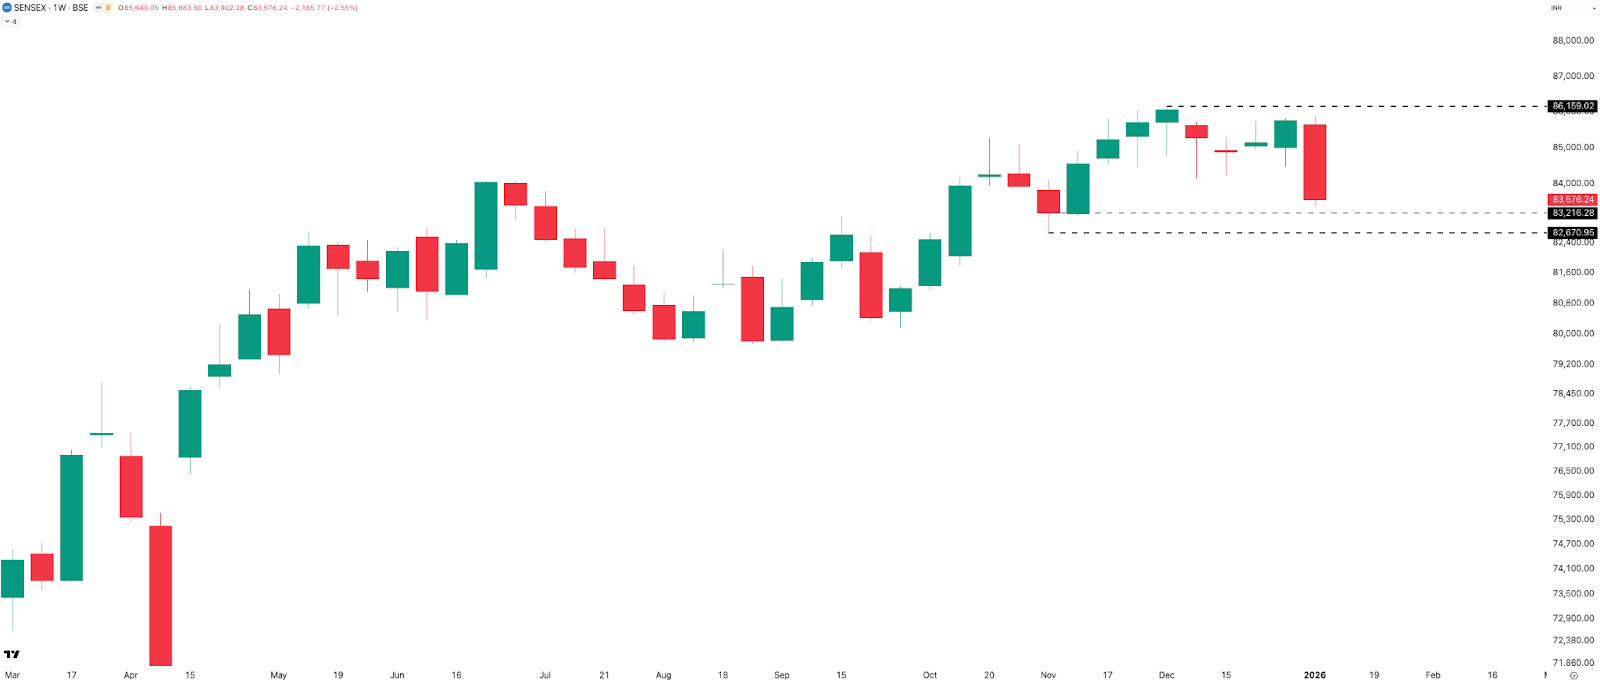
On the weekly timeframe, SENSEX fell 2,186 points, or 2.55%, to close at 83,576. The only silver lining is the 83,200–82,700 support zone, and the price is currently holding above it. Similar to NIFTY, the weekly range expanded sharply, with SENSEX covering close to 2,500 points, or about 3%.
Resistance is placed near the 85,750 zone, which is still some distance away. The bias remains bearish for the week unless we see a decisive close above this resistance level.
Daily Timeframe
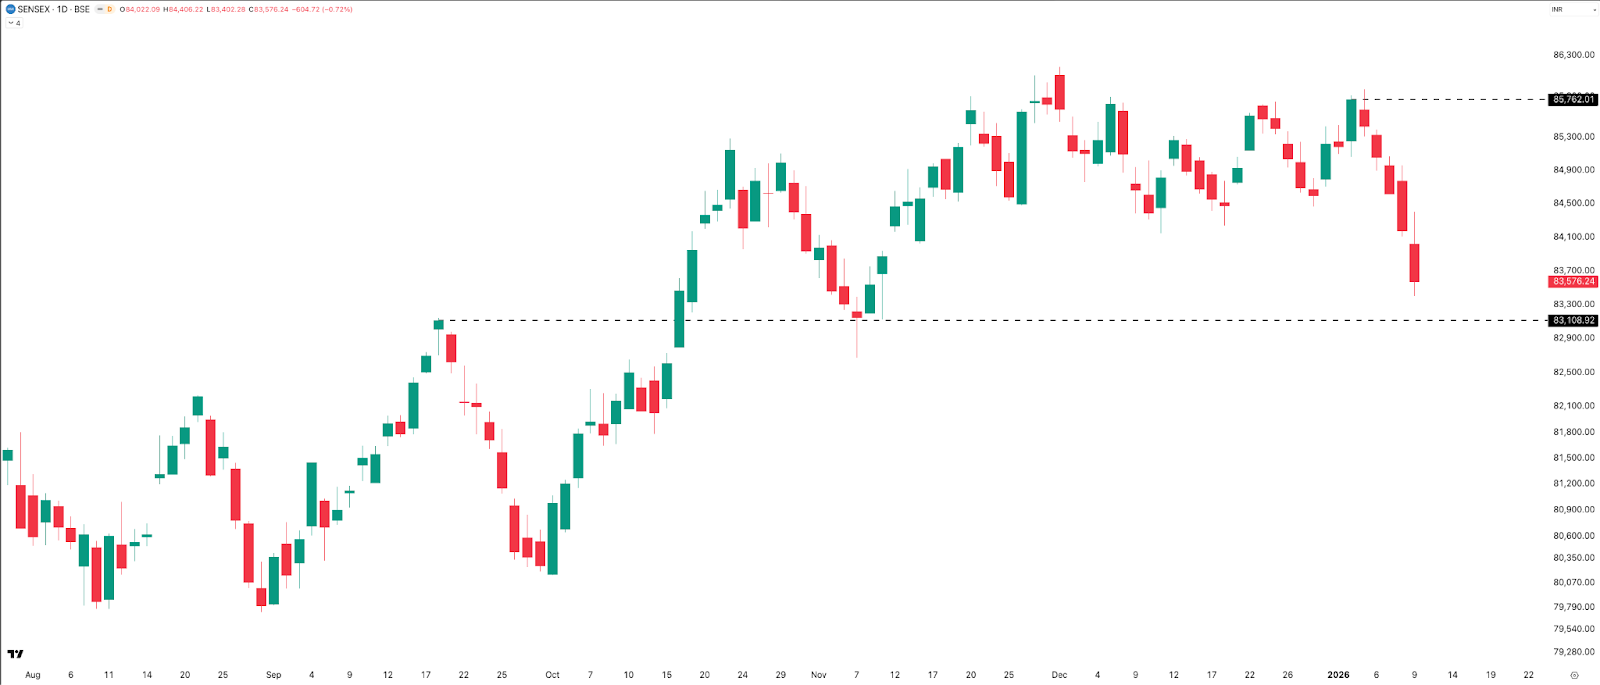
On the daily timeframe, SENSEX printed five consecutive red candles, similar to NIFTY, breaking all the key support levels discussed last week. The next support is placed near the 83,100 level, while resistance is at last week’s close around 85,750, from where the index sharply declined. The bias remains bearish. Let’s see how the coming week unfolds.
Expected Range Till Expiry
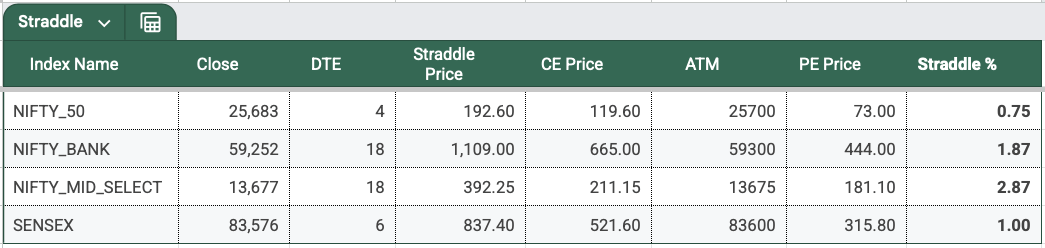
The next SENSEX weekly expiry is on Thursday, 15th Jan 2026. The ATM straddle closed around 837 points, almost 30% up from last week’s 627 points.
The expiry range based on the straddle price comes to:
- Upside: 84,413
- Downside: 82,739
That’s 1% expected move from the current close on either side till expiry.
BANKNIFTY: Relatively Stronger
Weekly Timeframe
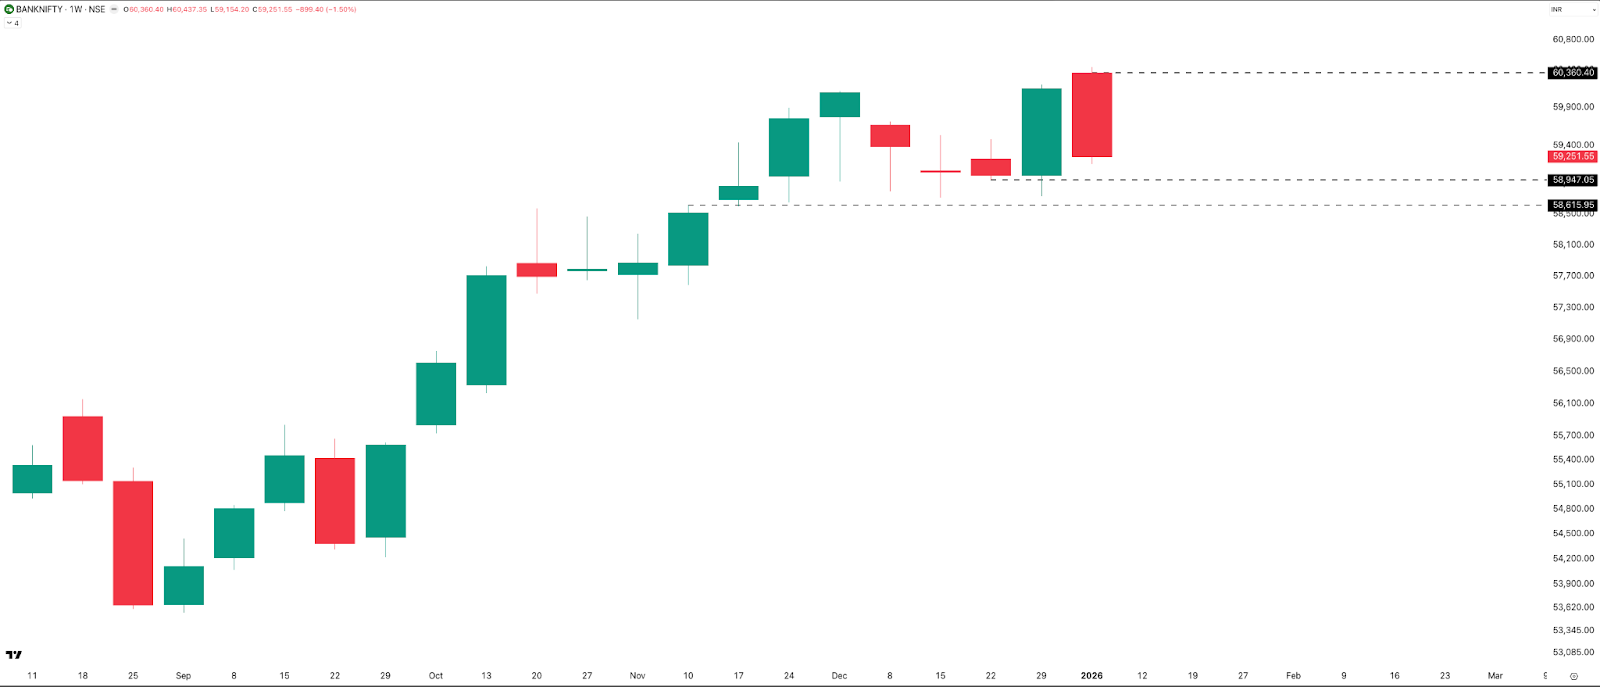
On the weekly timeframe, BANKNIFTY lost 899 points, or 1.5%, to close at 59,251. This week’s range was slightly lower than last week’s, but it still remained above 2%, indicating continued volatility. Key support levels are at 59,000 and 58,600, while resistance is placed near 60,360. The bias remains bearish, in line with NIFTY and SENSEX.
Daily Timeframe
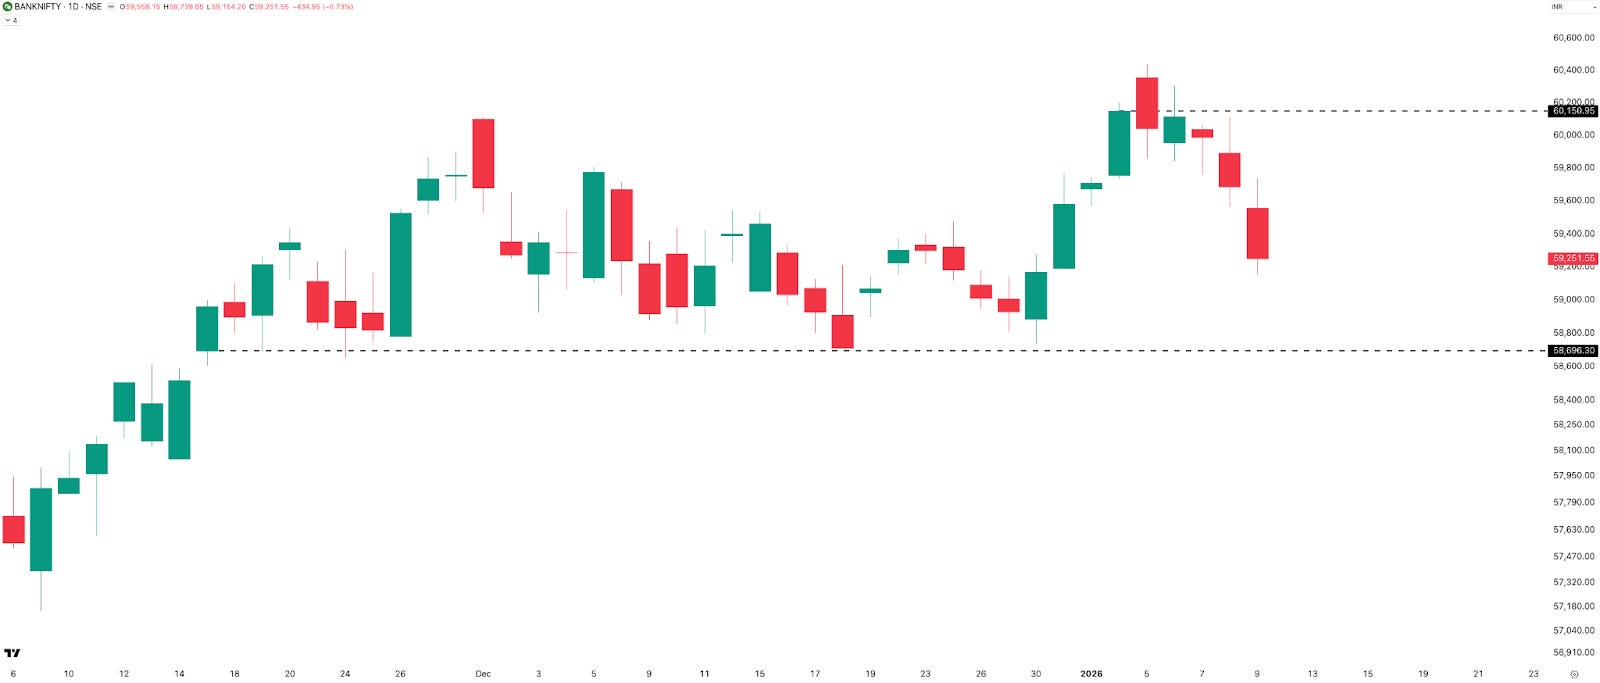
On the daily timeframe, BANKNIFTY printed one green candle this week on Tuesday, unlike NIFTY and SENSEX, where all five candles were red. However, Thursday and Friday saw fierce selling, with large red candles forming on both days.
The 58,700 level is an important area to watch. BANKNIFTY should attempt to find some support around this zone, as it has bounced from this level in the past.
Hourly Timeframe
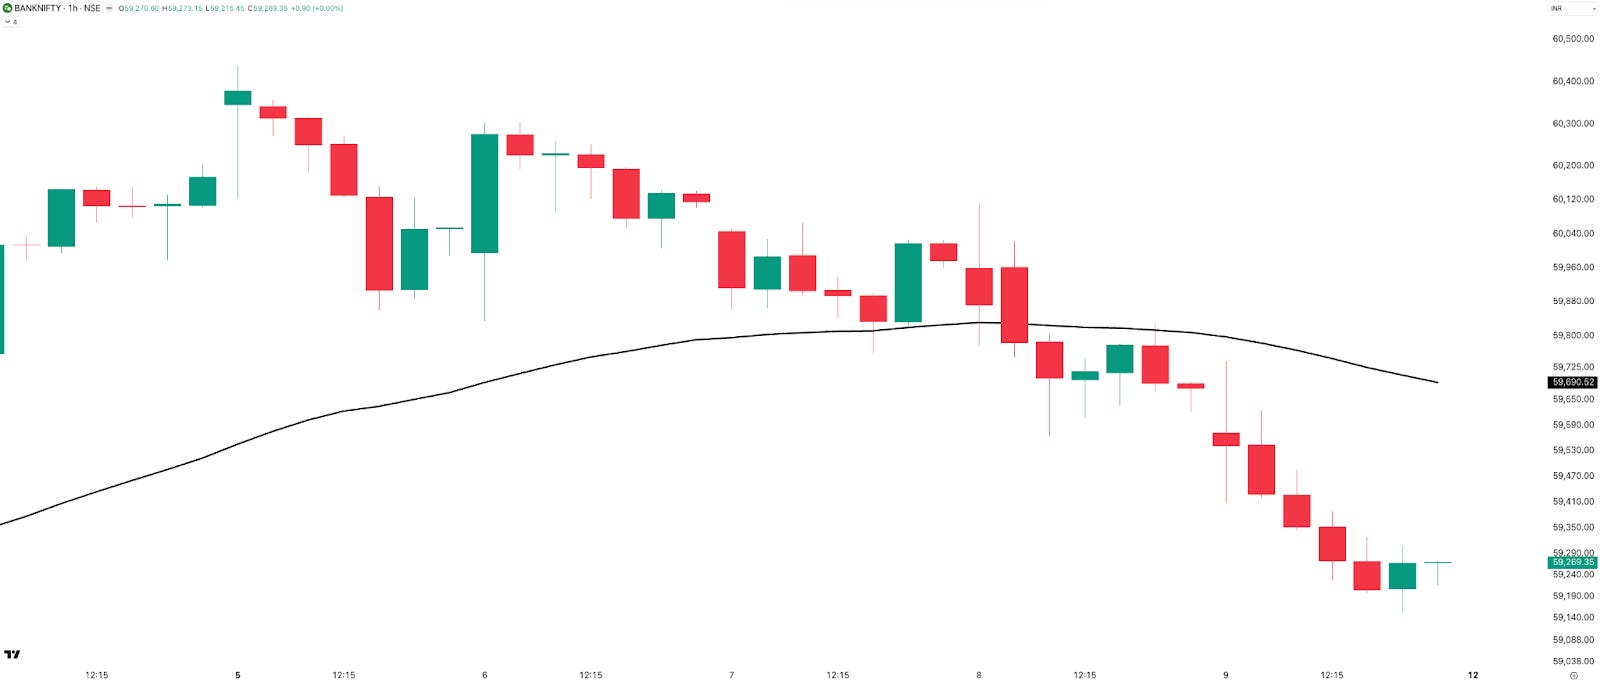
On the 1-hour chart, BANKNIFTY broke below the 50 EMA only on Thursday. Looking at the weekly, daily, and now the hourly charts, BANKNIFTY appears relatively stronger than NIFTY. However, the short-term bias remains negative until price moves back above the 50 EMA, which is currently roughly 400 points, or about 0.7%, away.
Rate of Change: Blood on the Street

We are in the second week of 2026, and all that we see is blood on the street. All indexes closed in red, ranging from 1.5% to 2.5%, with BANKNIFTY falling the least. Apart from that, there’s not much to see over here.
Sectoral Performance: Defensives Hold Up

Talking about the top sectors this week, all sectors are in negative, but among the most resilient are Pharma, IT, PSU Bank (which was in the list last week as well), and then we have FMCG and Banks. All defensive sectors have shown up this week. That’s about it for the sectors.
Range Expansion and Expiry Review

This week saw a clear range expansion across indices. NIFTY, BANKNIFTY, and SENSEX printed their widest daily range of the week on Friday, at 318 points, 585 points, and 1,004 points, respectively. As a result, NIFTY’s 5-day average range jumped to 205, up from 162 last week, marking a clear range expansion after a period of compression.
Now, let’s talk about the expiries. Tuesday’s NIFTY weekly expiry started with an extremely low ATM straddle premium of just 85 points. Despite this, the index saw a swing of nearly 130 points on the upside, followed by a 150-point move on the downside, before closing 71 points lower than the previous day. With such compressed premiums and relatively large intraday swings, it turned out to be a relatively tough expiry to manage for option writers.
SENSEX expiry on Thursday was a different story altogether. What began with an ultra-low ATM straddle premium of around 260 points quickly expanded to nearly 313 points after news of Trump’s proposed 500% tariff hit the markets around noon. This was one of those rare expiries where straddle premiums expanded intraday. Post the initial spike, the index remained range-bound from 12 PM to 3 PM, offering good opportunities for option writers.
Overall, SENSEX saw a directional move on the downside, but the midday volatility spike caught many non-directional option writers off guard. It was an easy expiry for directional sellers, tougher for non-directional sellers in the first half, but eventually rewarding for them as well in the second half.
INDIAVIX: Fear Returns
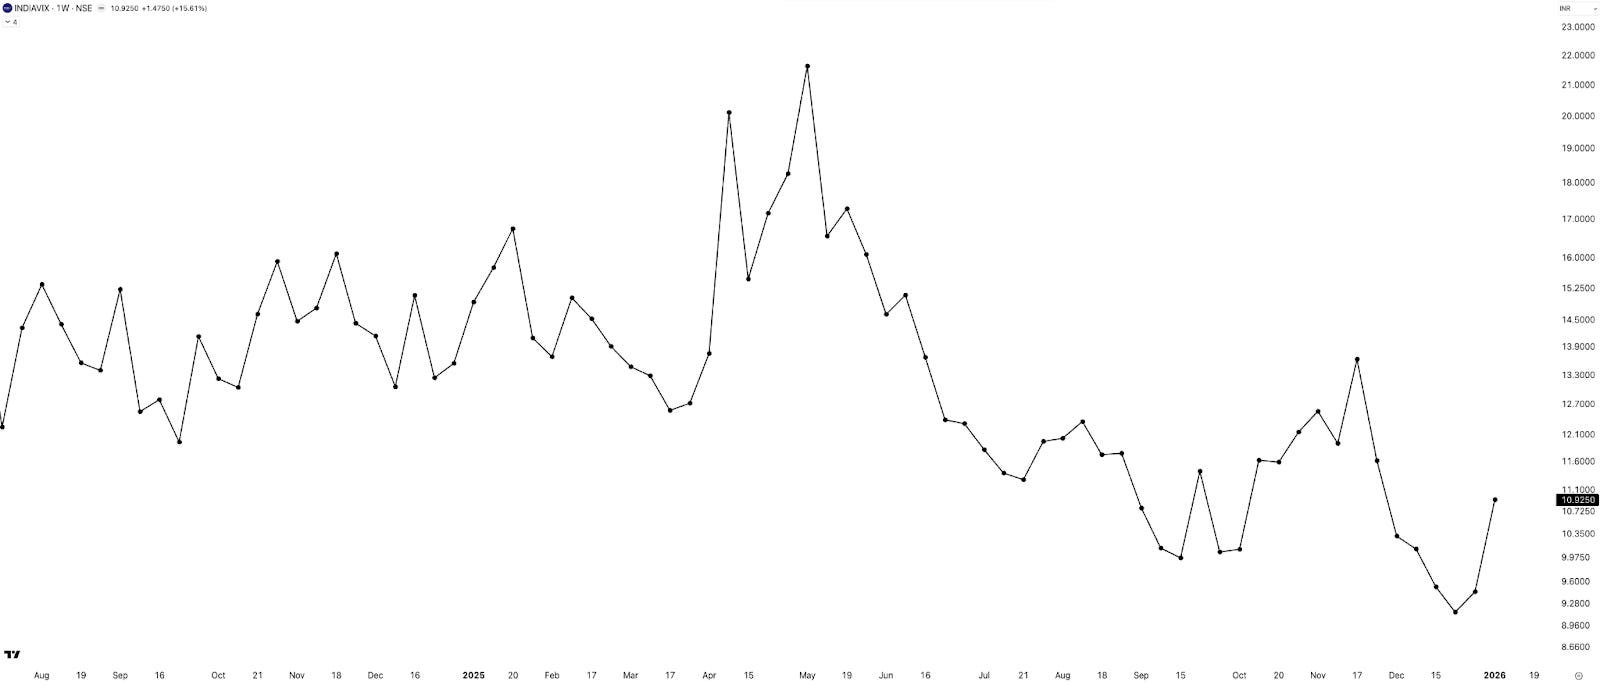
INDIAVIX saw a sharp uptick of 16%, closing just under 11. After staying low for a long period, a rise in VIX was expected—and for a change, that played out. Jokes aside, tariff-related uncertainty has clearly increased fear, which is now reflected in the higher INDIAVIX levels and elevated options premiums as well.
Commodities: Precious Metals Lead
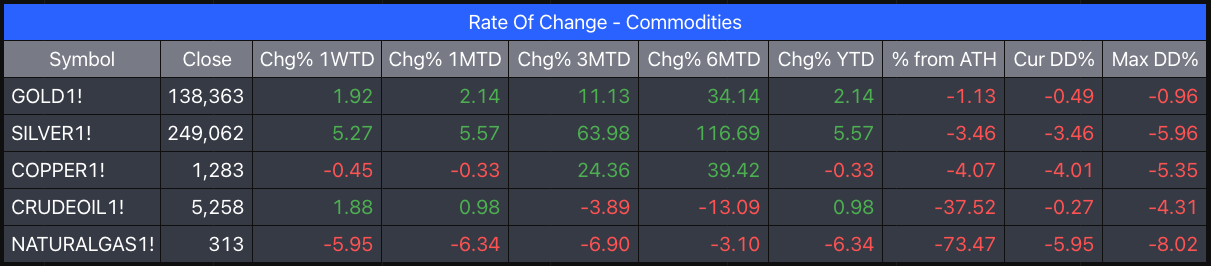
In the commodity space, this week, Silver was at the top at 5%, followed by Gold at approximately 2%, and lastly Crude at approximately 2%. Copper seems to have taken a breather this week after a massive rally in the last six months. Natural Gas, true to its nature and in line with my expectations, is down 6% this week.
In Summary
After making an ATH last week, markets saw a sharp reversal in Week 02, with NIFTY, BANKNIFTY, and SENSEX breaking key supports after starting the year at record highs.
Range expansion returned aggressively after a long phase of compression, triggering a spike in volatility and a meaningful rise in option premiums.
All sectors closed in the red, with defensives like Pharma, IT, and FMCG showing relative resilience, while broader markets weakened.
INDIAVIX jumped sharply, reflecting rising uncertainty driven by tariff-related concerns.
Overall, the tone has shifted to bearish and volatile—momentum is on the downside, ranges are expanding, and higher options premiums mean better risk reward for writers and with that, tight risk management as well.
What Caught My Attention This Week
First , I have been reading up on the US-Venezuela issue, and there are two articles that I liked. One is a simple explainer titled “What’s Happening With the U.S. and Venezuela”
Next, if you are keen on a critical view of the situation, the Al Jazeera opinion piece titled “Venezuela: American regime change with a Trumpian twist” is a good read.
Second , changing tracks, if you are a keen follower of the AI space, this WSJ article titled “How Google Got Its Groove Back and Edged Ahead of OpenAI” is a must-read. It talks about how, after an early domination by OpenAI’s ChatGPT, Google is staging a solid comeback.
Lastly , how can I miss talking about Morgan Housel’s latest post—”A few things I am pretty sure about.” No explainer needed for this one; it’s better read and re-read.
What to Expect in the Coming Week
Next week is a full five-day trading week, and there are no major events lined up; we cannot predict any geopolitical tensions anyways.
Talking about the markets, the overall sentiment seems bearish to range-bound. On commodities, metals, both precious and base should continue to be bullish.
And with that, we wrap up this week’s Market Metrics.