Hello and welcome to the Weekly Market Metrics! I am Sandeep Rao, and we’re in Week 03 of 2026.

We are two weeks into 2026, and the general uncertainty in the markets continues. Last week, it was Venezuela. This time it’s Iran. In all of this, we don’t know where our trade deal with the US is headed.
Anyways, let’s check the charts and see how the price action played out. We’ll also look at what is possible in the coming week.
NIFTY: Indecision Takes Center Stage
Weekly Timeframe
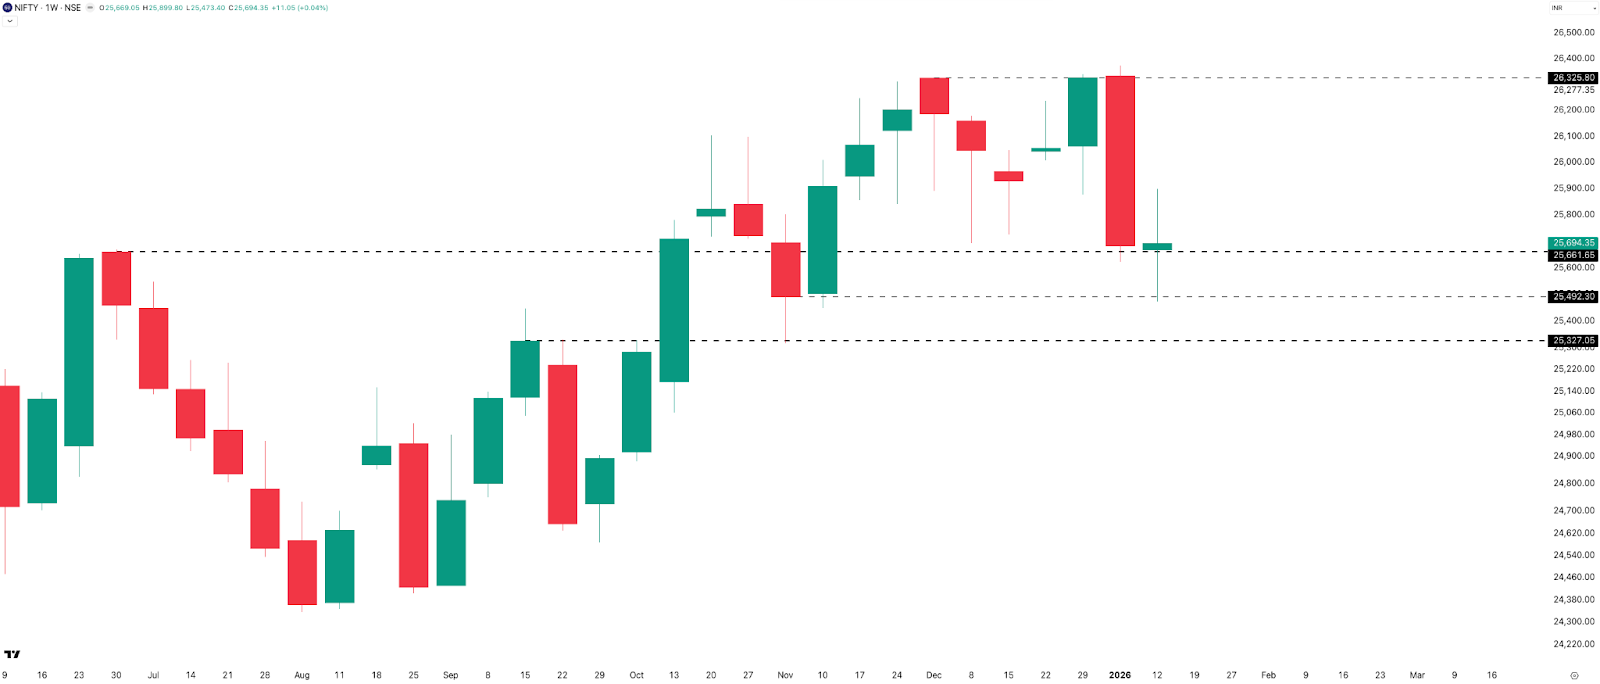
Last week, NIFTY formed a red marubozu candle. This week, it followed up with an indecisive doji. On a week-on-week basis, NIFTY gained just 11 points and closed at 25,694. This may look like no movement, but the weekly range was 426 points, or about 1.65%, with a low of 25,473 and a high of 25,900. Volatility was clearly present.
On the weekly chart, NIFTY is sitting near an important support zone around 25,650, which is also close to last week’s close. A break below this level opens the downside toward 25,500 and then 25,300. On the upside, with the US trade deal still uncertain, a move back to 26,300 looks difficult. This level remains a key weekly resistance.
Daily Timeframe
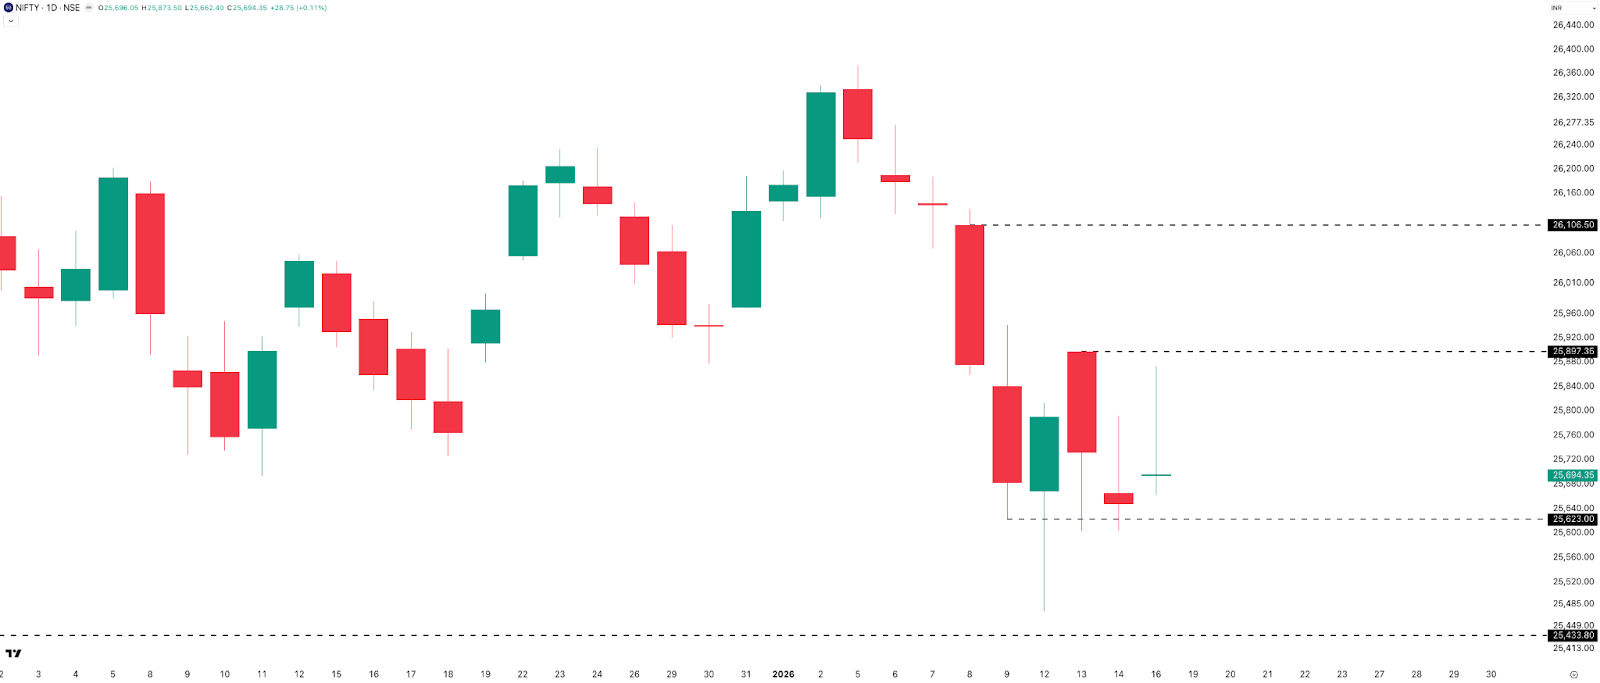
On the daily timeframe, NIFTY had only four trading sessions due to a late holiday announcement by the exchanges on Thursday, the 15th, for municipal elections in Mumbai.
The daily chart for the week is dominated by long wicks—Monday and Tuesday on the downside, and Wednesday and Thursday on the upside. This clearly shows a lack of direction and continued indecision.
For levels, 25,600 is the immediate support, and a deeper support sits around the 25,400 area. On the upside, 25,900 and 26,100 act as resistance zones.
Hourly Timeframe
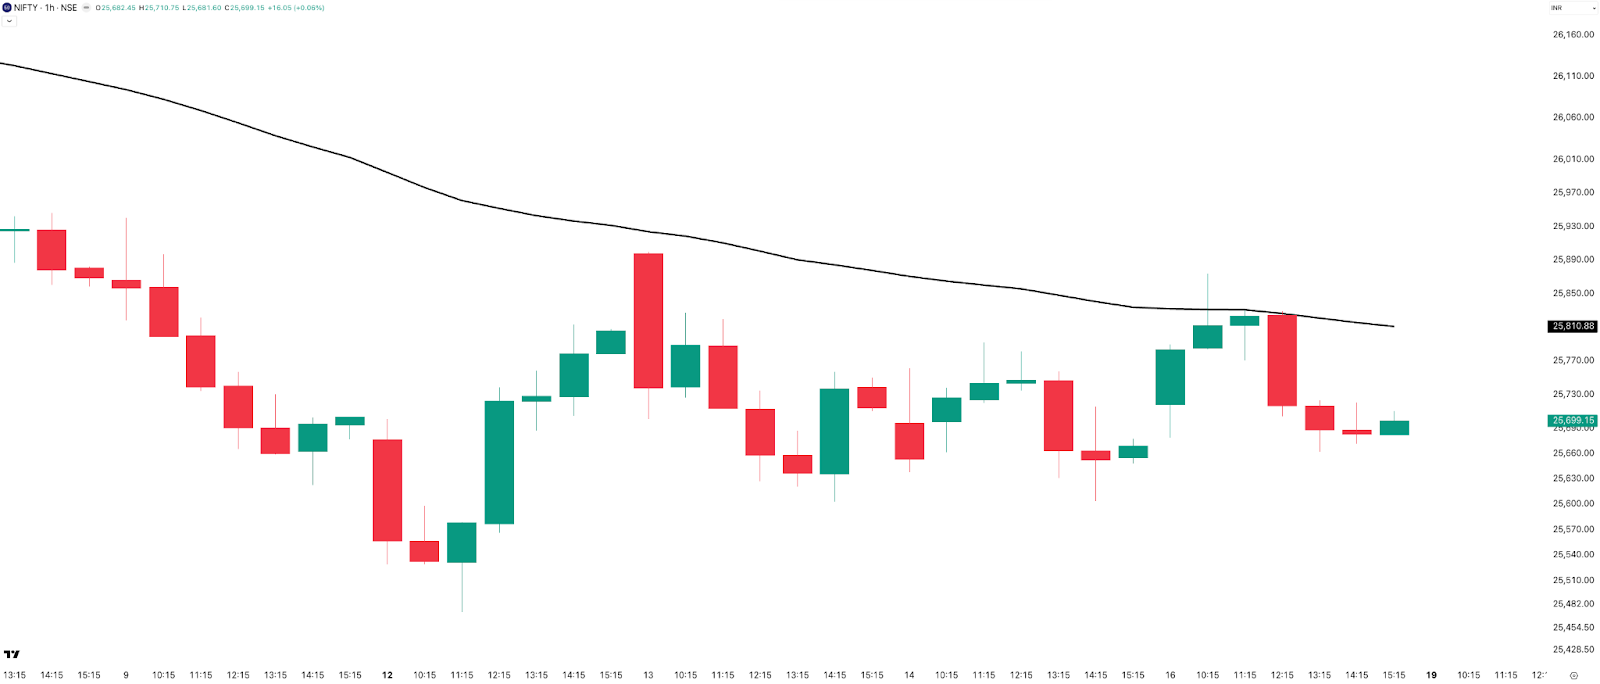
Moving to the hourly timeframe, NIFTY continued last week’s downtrend and stayed below the 50 EMA for most of the week, with only Friday attempting a move above it. Unlike many short-lived downtrends, this has sustained for nearly nine calendar days. The short-term bias remains bearish, with price still about 110 points, or roughly 0.45%, below the 50 EMA.
Expected Range Till Expiry
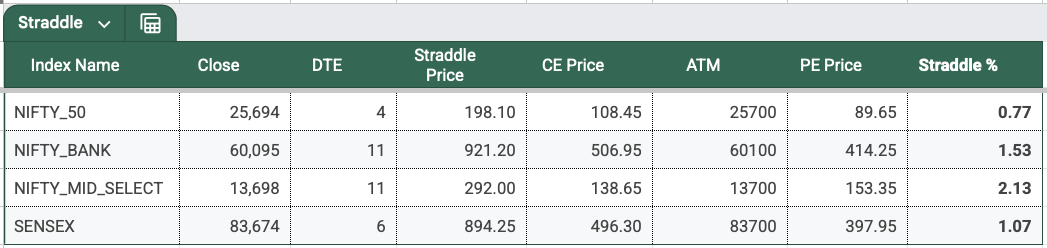
Moving to NIFTY’s expected range into the coming Tuesday, 20th January expiry: Based on options data, the ATM straddle closed around 198 points, up 5 points from last week’s 193. Even with no movement in NIFTY on a week-on-week basis, the straddle is pricing in close to a 200-point range for expiry that is 2 days away with a weekend in between.
With NIFTY spot closing near 25,694, the implied expiry range comes to:
- Upside: 25,900
- Downside: 25,500
That’s roughly 0.77% on either side.
Open Interest Analysis
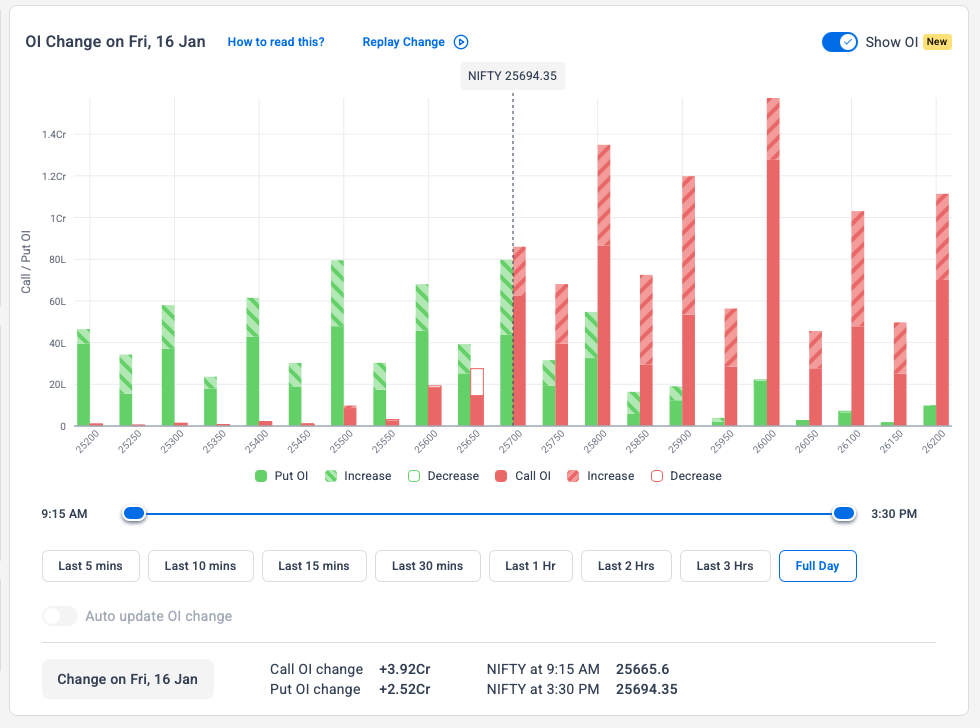
Looking at the open interest data, on the call side, the 26,000, 25,800, and 25,900 strikes have the highest open interest. On the put side, open interest is relatively weaker compared to calls, with 25,700 and 25,500 being the two highest OI strikes.
Overall, the 25,800–26,000 zone is acting as a clear resistance on the upside. On the downside, there is no strong build-up, except for some support around 25,500.
SENSEX: Holding Support
Weekly Timeframe
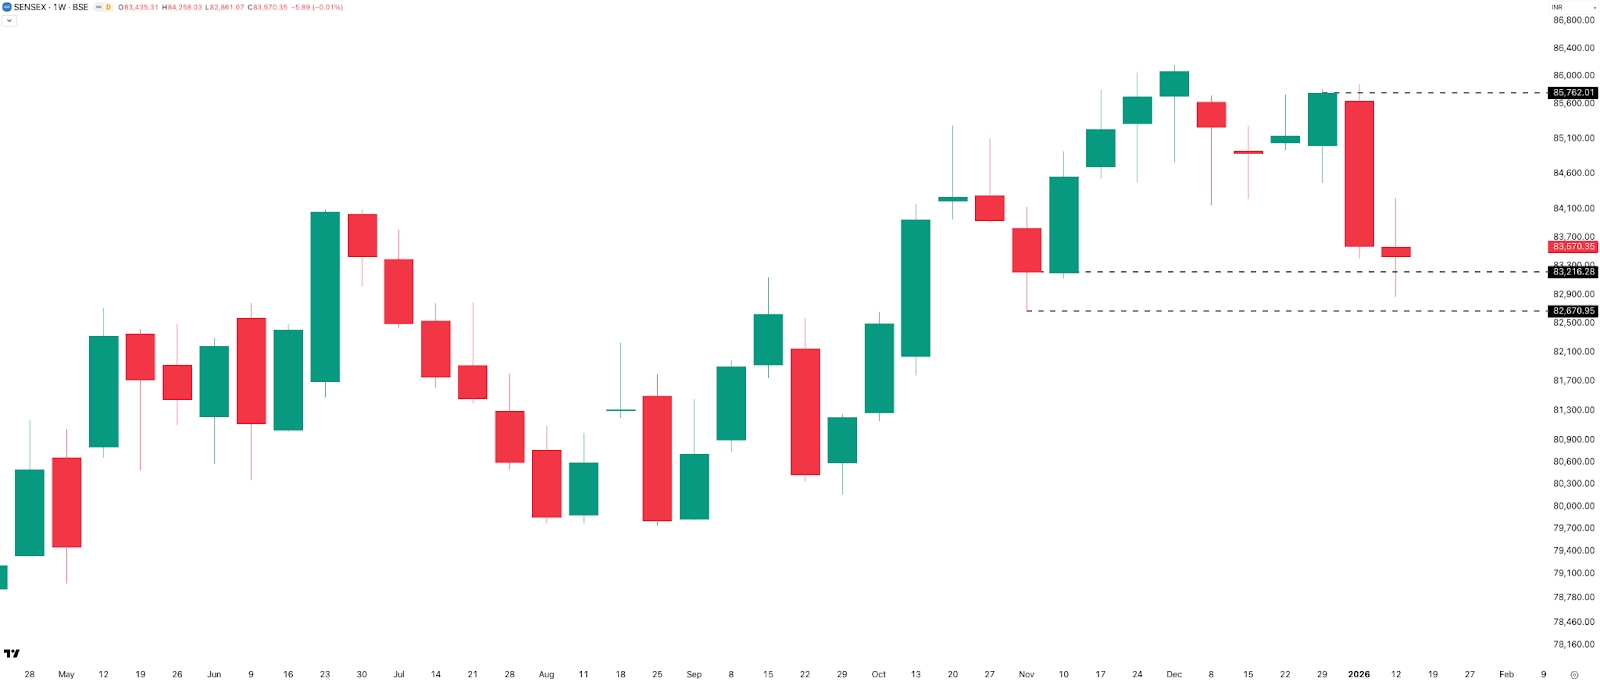
On the weekly timeframe, SENSEX also printed an indecisive doji candle. After falling nearly 2,200 points last week, the index declined just 6 points this week to close at 83,570. Once again, SENSEX held above the key support level of 83,200. The weekly range was about 1,400 points, or roughly 1.65%, indicating continued volatility despite the flat close.
Daily Timeframe
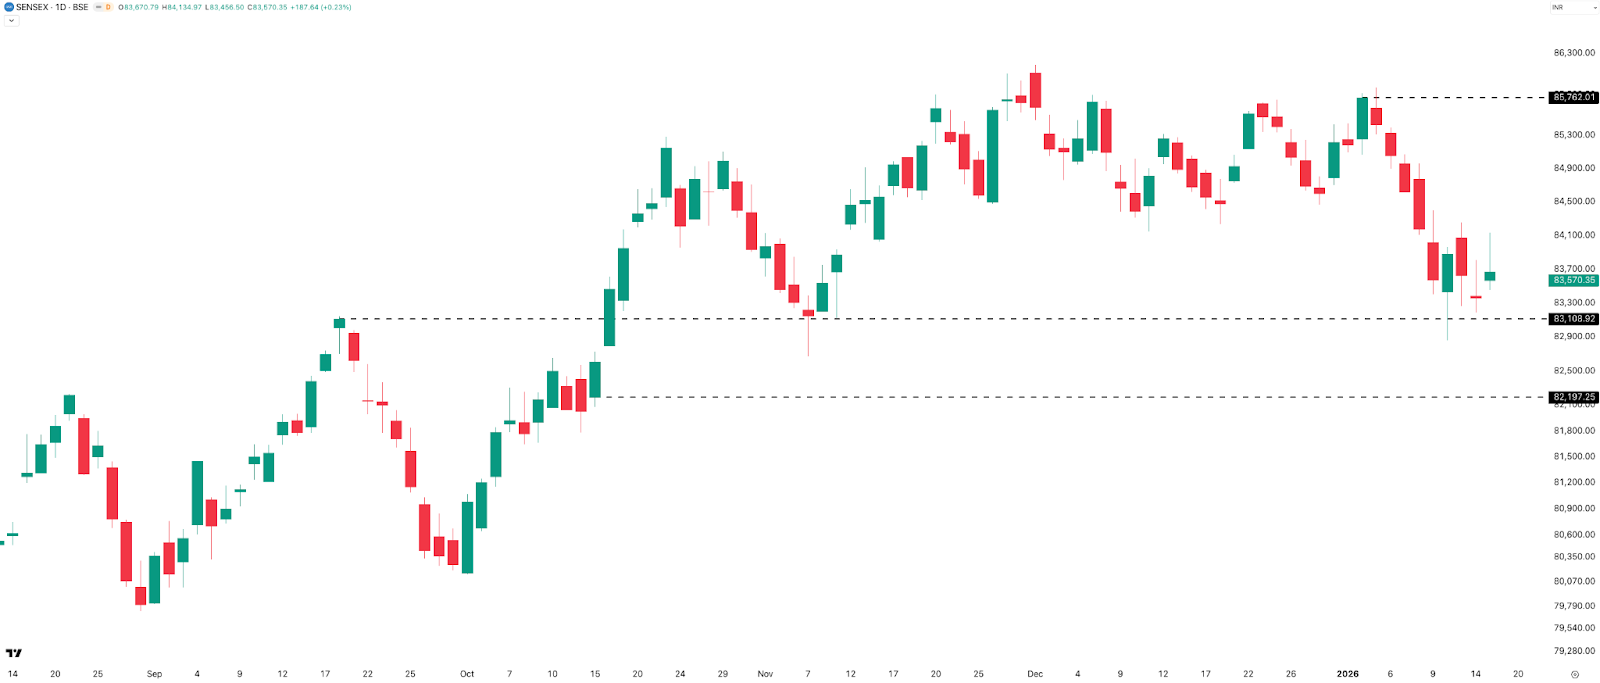
On the daily timeframe, the picture is similar to NIFTY. Every candle has visible wicks—lower wicks on Monday and Tuesday, and upper wicks on Wednesday and Friday—showing clear indecision. As long as the 83,100 zone holds, SENSEX is supported. A break below this level can open up downside toward 82,200.
Expected Range Till Expiry
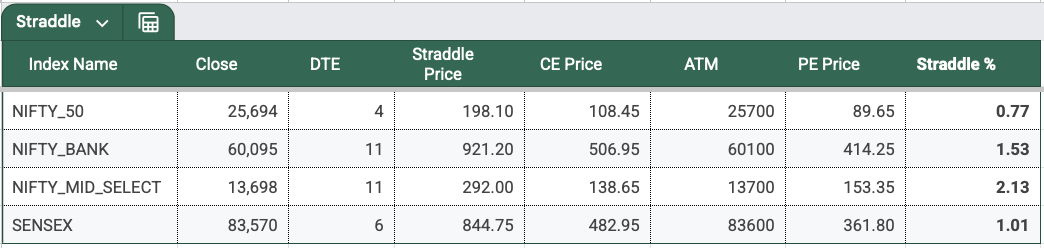
The next SENSEX weekly expiry is on Thursday, 22nd January 2026. The ATM straddle closed around 844 points, almost unchanged from last week. Based on this pricing, the implied expiry range is:
- Upside: 84,415
- Downside: 82,725
These are broadly the same levels we discussed last week.
BANKNIFTY: The Outperformer
Weekly Timeframe
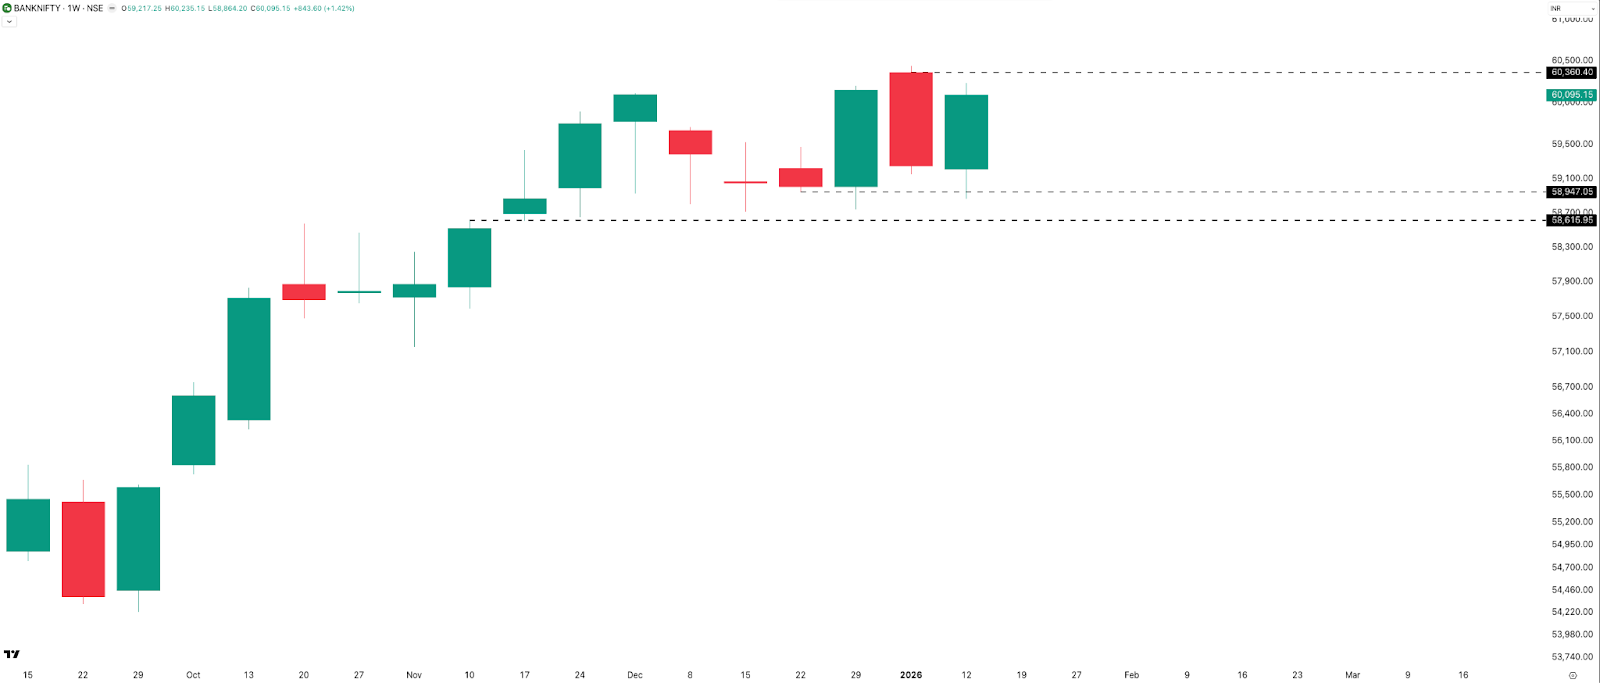
Unlike NIFTY and SENSEX, on the weekly timeframe, BANKNIFTY gained 844 points, or 1.42%, and closed above 60,000 at 60,095. BANKNIFTY has been relatively stronger than NIFTY for two weeks in a row. Last week it fell less than NIFTY, and this week it moved higher while NIFTY stayed flat.
This shows banking stocks are outperforming, while non-banking stocks are dragging NIFTY. With HDFC Bank results coming up, the next move in BANKNIFTY will be worth watching. Support and resistance levels remain the same as last week. Key supports are at 59,000 and 58,600, while resistance is near 60,360.
Daily Timeframe
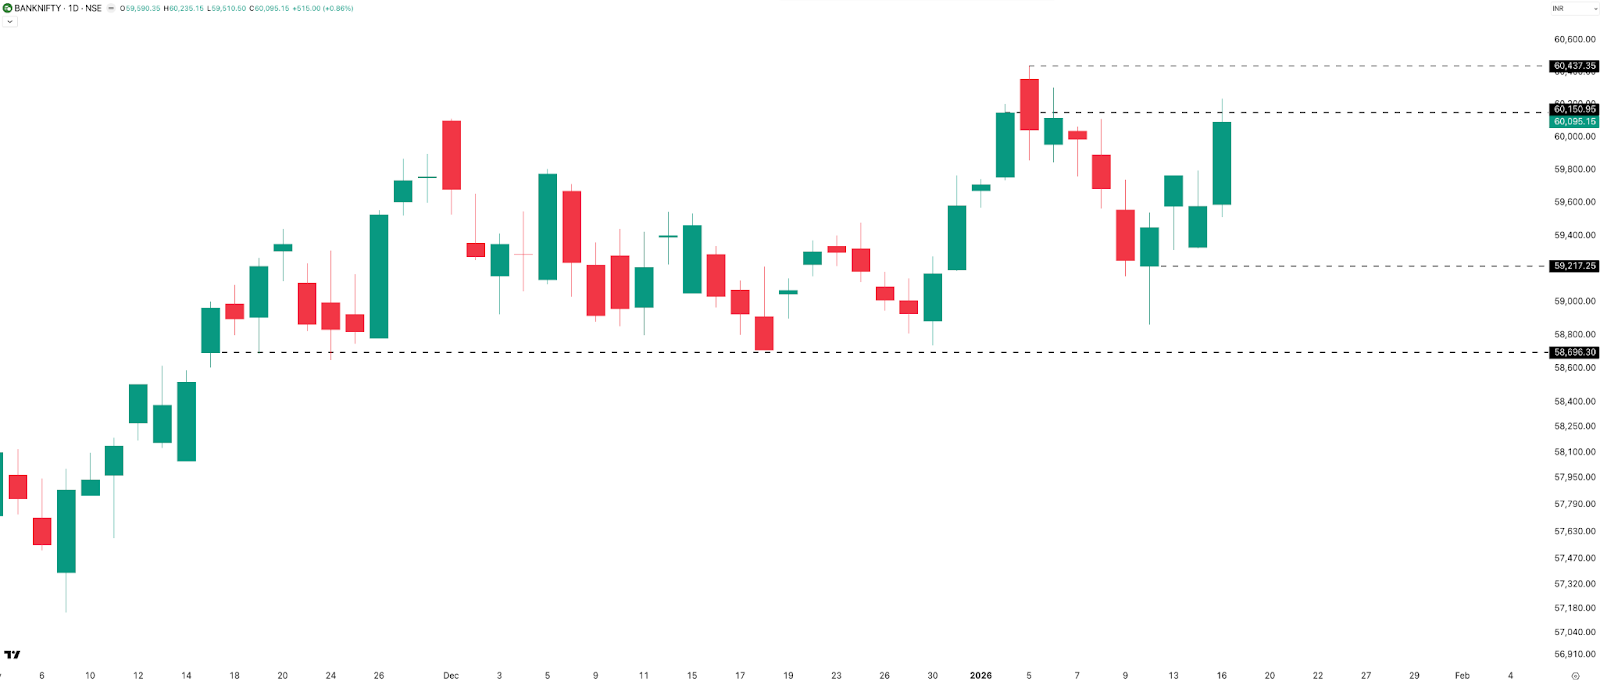
On the daily timeframe, BANKNIFTY printed four green candles this week. It closed near 60,150 but failed to close above it. A close above 60,151 would have marked the highest daily close for BANKNIFTY. On the downside, 59,200 is immediate support, with 58,700 below that. On the upside, 60,150 and then 60,437—the all-time high—act as the key resistances.
Hourly Timeframe
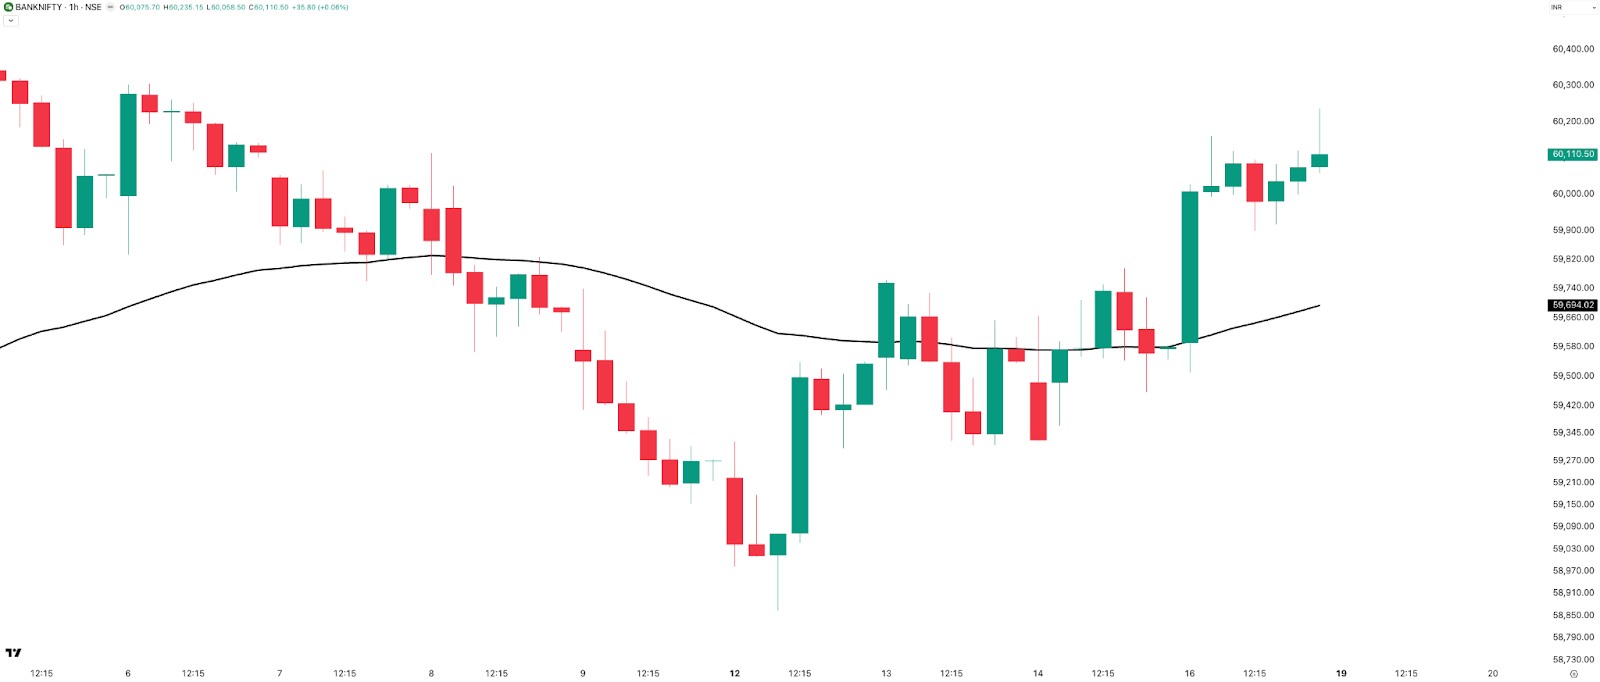
On the 1-hour chart, BANKNIFTY shifted from bearish to bullish last week. Monday, Tuesday, and Wednesday chopped around the 50 EMA, but Friday saw a clear breakout above the 50 EMA, and the index has stayed above it since. With the all-time high less than 0.6% away, the short-term bias remains bullish.
Rate of Change: BANKNIFTY Leads
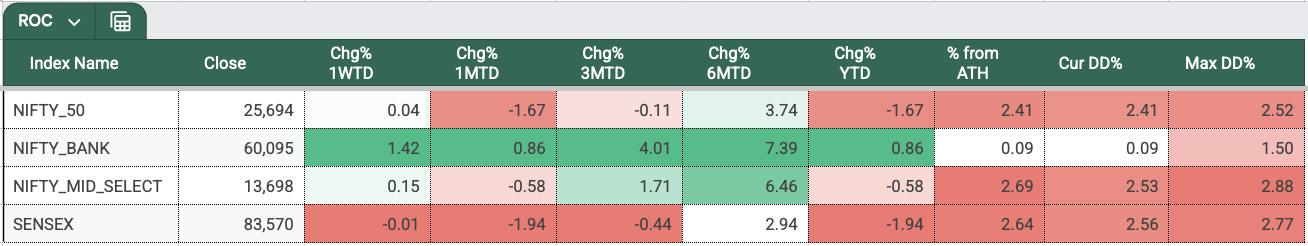
In the third week of 2026, NIFTY and SENSEX remained largely flat, while BANKNIFTY gained 1.42%. On a year-to-date basis, only BANKNIFTY is in positive territory, up 0.86%. NIFTY is down 1.67%, and SENSEX is lower by 1.94%.
Sectoral Performance: Metals and PSU Banks Lead
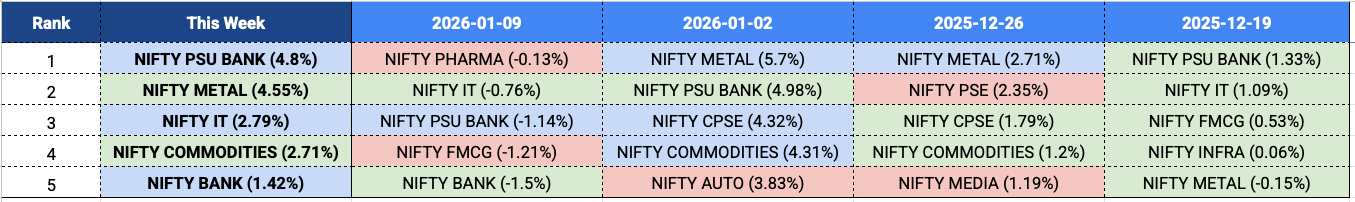
Talking about the top sectors this week, METAL was back in action with a 4.55% gain this week, just behind PSUBANK, which topped the chart with 4.8% gains. IT rose 2.79%, largely driven by Friday’s move. Commodities gained 2.71%, and BANK was up 1.42%. METAL and Commodities were the new entrants in the top five this week, while the remaining three sectors continued in the top five from last week.
Range Expansion and Challenging Expiries
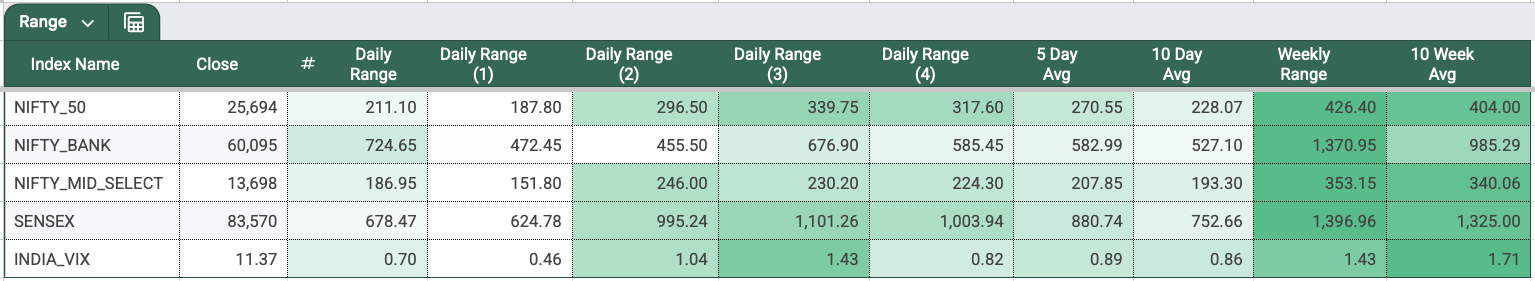
Monday had the highest daily range for both NIFTY and SENSEX (Daily Range 3). Tuesday saw the highest range for NIFTY MIDSELECT (Daily Range 2), while Friday recorded the highest range for BANKNIFTY (Daily Range). The 5-day average daily range in NIFTY jumped to 270 points from 205 points.
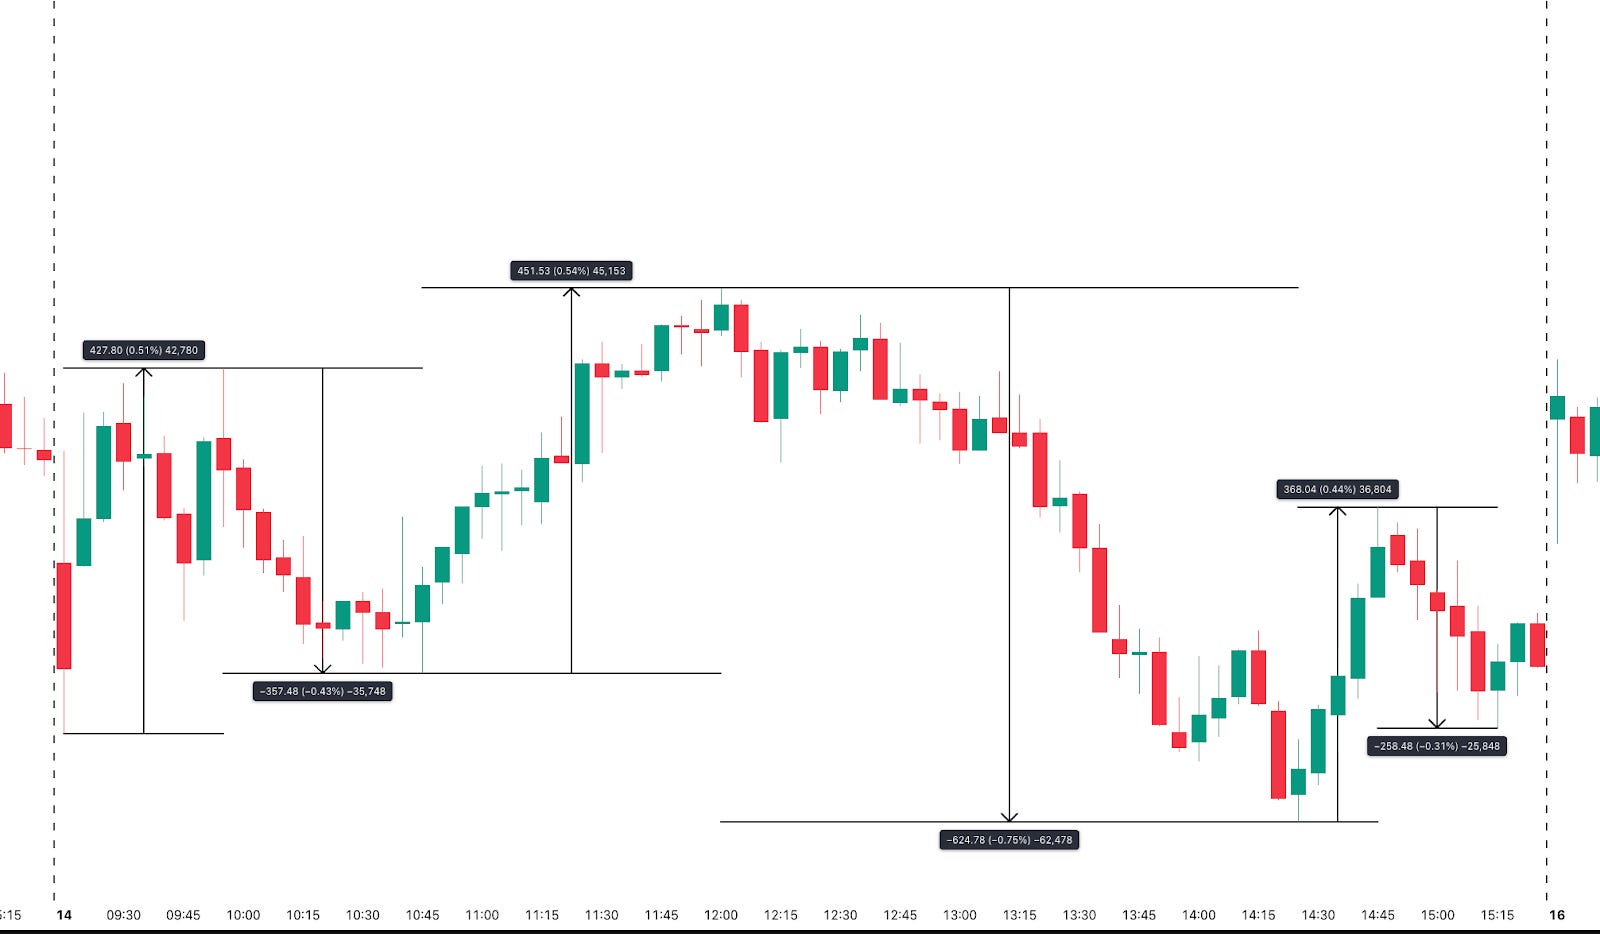
Now, let’s talk about the expiries. This week’s NIFTY expiry opened with a better premium at 118 points compared to last week’s 85. However, the index moved 200 points down, then 118 points up, again fell 216 points, and finally bounced 153 points, closing just 57 points lower than Monday. This clearly shows realised volatility running higher than implied volatility and how ranges are expanding in 2026. Overall, it was a relatively tough expiry for option sellers.
SENSEX expiry was moved to Wednesday from Thursday due to a late trading holiday announcement by the exchanges. And it was anything but calm. Just look at the 5-minute chart of 13th Jan—the index moved more than half a percent 5–6 times during the day, even though the ATM straddle was priced at just 375 points, or about 0.45%, at the open.
So this week, both expiries were extremely challenging, especially for option sellers. Let me know if you managed to get through these two expiries without taking a big hit to the capital.
INDIAVIX: Building Ahead of Budget
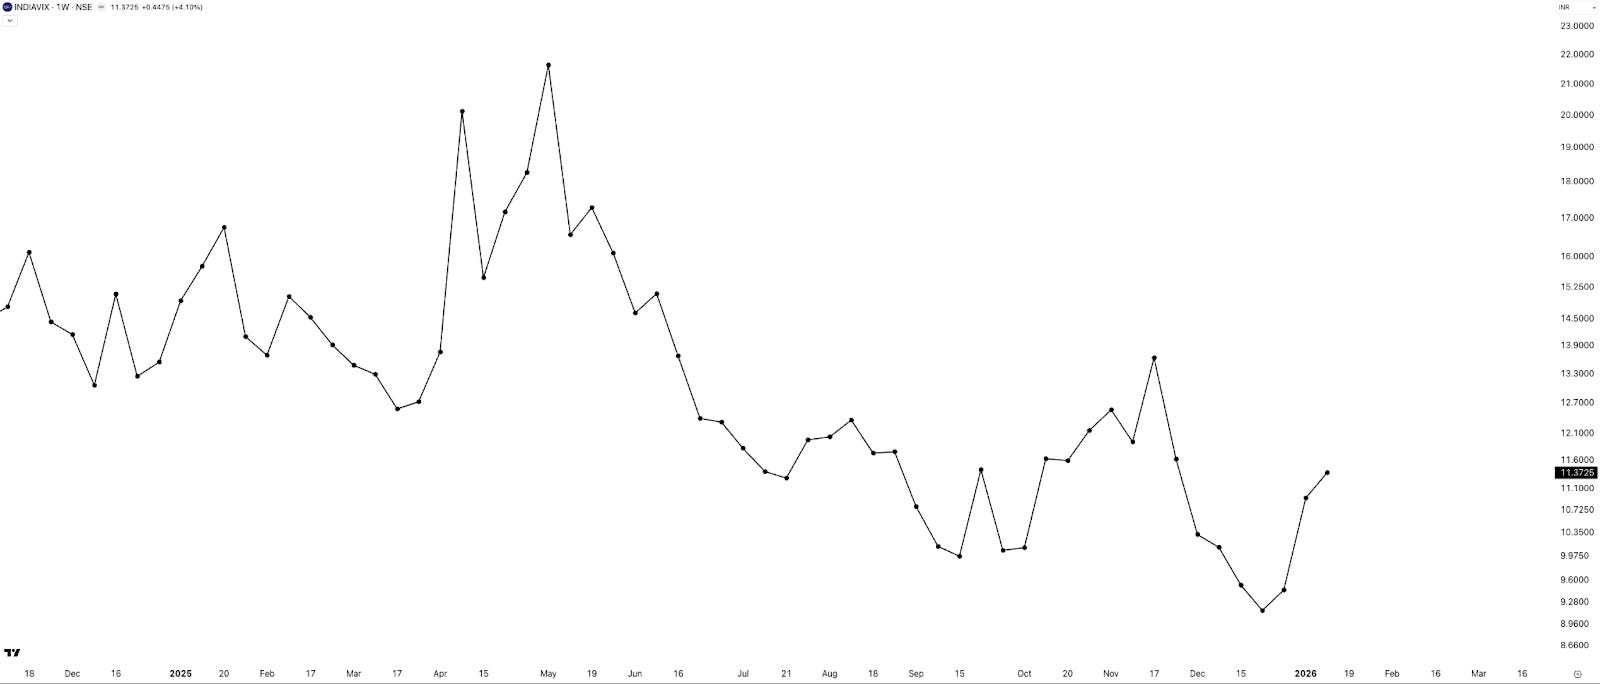
INDIAVIX rose another 4% this week to close at 11.37. Is this volatility building up ahead of the budget? I would like to think so.
Commodities: Silver Steals the Show
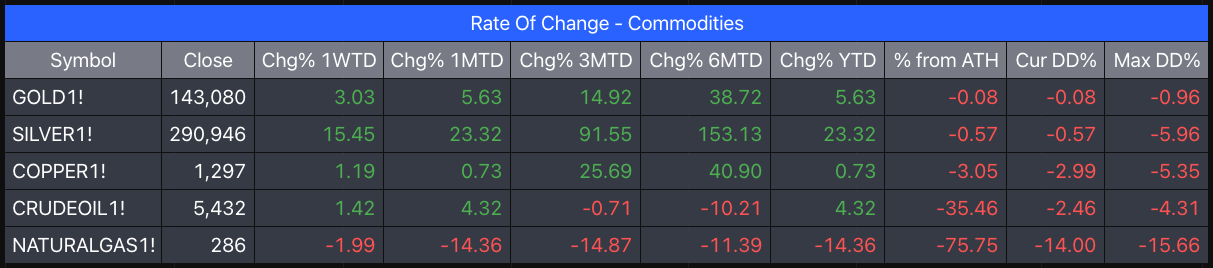
(Data: MCX Continuous Futures - Back Adjusted)
In the commodity space this week, Silver clearly led the pack with a strong ~15% move. Gold followed with a steady ~3% gain, while Crude Oil added around ~1.5%. Copper appears to be taking a pause this week after a sharp rally over the last six months. Natural Gas, true to its nature and in line with expectations, corrected again and was down roughly 2% this week.
In Summary
Markets remained largely range-bound this week, with NIFTY and SENSEX closing flat while BANKNIFTY continued to outperform and moved higher.
Volatility picked up meaningfully despite muted index closes, with wider daily and weekly ranges and a steady rise in option premiums, pointing to active two-way trading.
Sector performance was mixed, with METAL and Commodities emerging as fresh leaders, while Banking remained strong, and broader market participation stayed selective.
INDIAVIX rose again, suggesting volatility is building ahead of the upcoming budget, even as price direction remains unclear.
Overall, the market tone is sideways with rising volatility—direction is missing, and ranges are expanding. It’s a tough market to trade, but Januarys are rarely easy.
What Caught Our Attention This Week
First , India is moving towards formal crypto regulation, with SEBI likely to emerge as the primary regulator for crypto exchanges, ending years of ambiguity and bringing clearer oversight.
Second , a Mint article highlighting how FPIs sharply rotated in 2025—pulling out ₹1.67 trillion overall, but selectively allocating capital to cyclical and commodity sectors while aggressively exiting IT and consumer stocks.
Last , if you are interested in reading about what’s happening in Iran and how it all started, I would recommend this New York Times piece titled “Inside Iran’s Protests: How a plunging currency set off wide unrest.”
What to Expect in the Coming Week
Next week is a full five-day trading week. There are no major events lined up, but any update on the trade deal—or something unexpected—could still emerge over the weekend or during the week. Also, with this being the second-last week ahead of the budget, volatility may continue to rise.
Talking about the markets, the overall sentiment remains range-bound. In commodities, Silver is the big question mark. Whether it mean-reverts from here or continues to run higher is still an open guess.
And with that, we wrap up this week’s Market Metrics.
If you find this series useful, don’t forget to subscribe to the channel.
Until then—stay curious, stay steady, and enjoy your weekend.