Hello and welcome to the Weekly Market Metrics! I am Sandeep Rao, and we’re in Week 4 of 2026.

We are three weeks into 2026, and this week saw complete mayhem in the equity markets. Except, of course, for precious metals and commodities.
I got curious about what’s happening to markets. Is there any index in positive? What I did was to check all Indexes—Market Cap weighted, Sectoral, and Factor based—to see if any of them are in green!
The Damage Across Market Caps
Let’s start with market-cap-weighted indexes. NIFTY Total Market, or NIFTY 750, is down about 6% from its 52-week high.
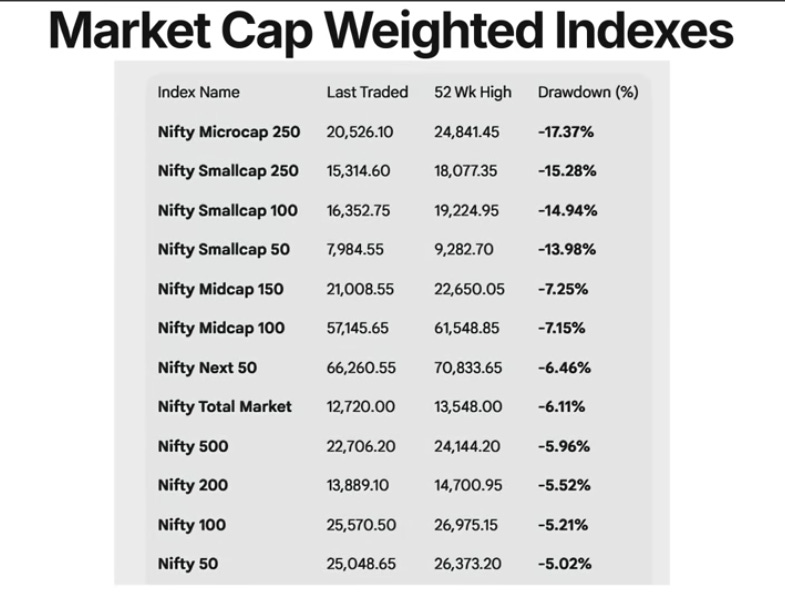
Microcap 250 is the worst hit, down nearly 17%, followed by Smallcap 250. Midcap 150 has been relatively stable, down around 7%, while NIFTY 50 has corrected the least at about 5%.
This clearly shows that small and microcaps have taken the maximum damage, while large caps—especially the NIFTY 100—are holding up relatively well with a drawdown close to 5%.
Sectoral Carnage: High-Beta Takes the Hit
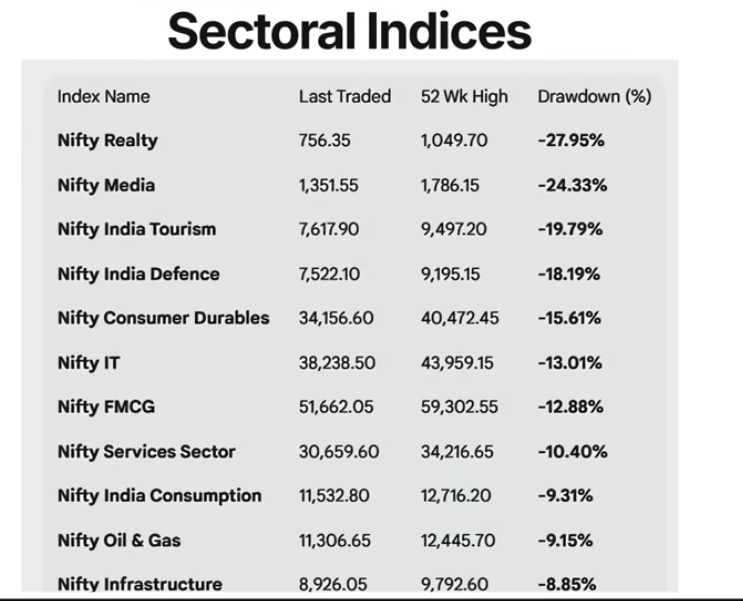
Looking at sectoral drawdowns from 52-week highs, the maximum damage is in high-beta sectors. NIFTY Realty and Media are the worst hit, down over 25%, followed by Tourism and Defence with close to 20% corrections. Consumer Durables, IT, and FMCG are down in the low to mid-teens.
On the other hand, defensives and financials remain relatively resilient. Pharma, Financial Services, Banks, and Metals have seen limited drawdowns, mostly under 5%.
Factor Indices: Momentum and Quality Under Pressure
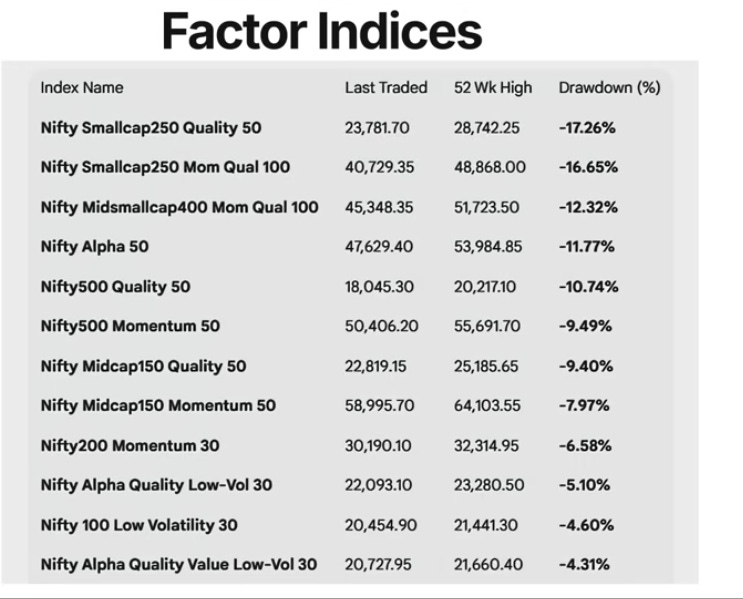
Moving to factor indices, the maximum drawdowns are again visible in small-cap and high-beta strategies. Smallcap quality and momentum-based indices are down 16–17%, while mid and smallcap momentum–quality indices are down in the low double digits. Alpha and pure momentum strategies have corrected around 8–12%.
On the defensive side, low volatility, value, and quality-value-low-volatility factors have held up relatively well, with drawdowns largely limited to 3–5%. NIFTY 50 Value 20 remains the most resilient, down just about 2.5%.
That’s how bad things are.
Anyways, let’s check the charts and see how the price action played out this week. We’ll also look at what is possible in the coming week.
NIFTY: Extended Downtrend
Weekly Timeframe
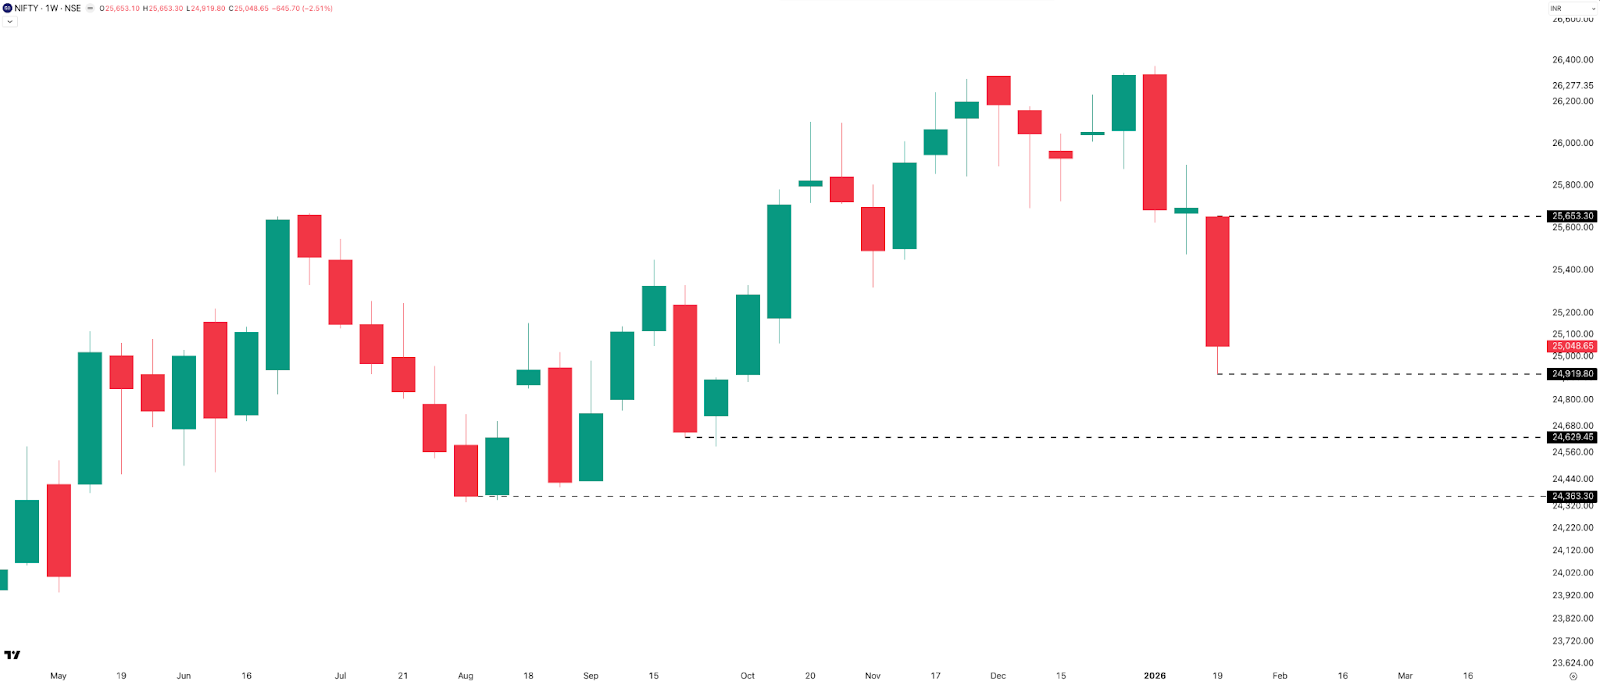
After forming a doji on the weekly chart last week, NIFTY extended its downtrend this week, falling 2.51% or 646 points. This marks NIFTY’s largest absolute weekly close-to-close move, up or down, in the last 17 weeks. The last time we saw a similar move was in the final week of September 2025, when NIFTY declined 2.65%. Almost four months later, such high volatility has returned.
NIFTY closed at 25,048 after making a low of 24,920 during the week. The weekly range stood at 733 points, or 2.86%. Notably, the weekly open was equal to the high, indicating a clear bearish bias.
Despite the weakness, NIFTY continues to hold the 25,000 level on a closing basis. The key question now is whether we see a bounce from here or a deeper correction in the pre-budget week. My view is that NIFTY is likely to remain range-bound until the budget is presented, after which a clear directional move could emerge on either side.
On the upside, this week’s high of 25,650 acts as a resistance. Immediate support is placed at 24,900, followed by 24,600 and 24,350.
Daily Timeframe
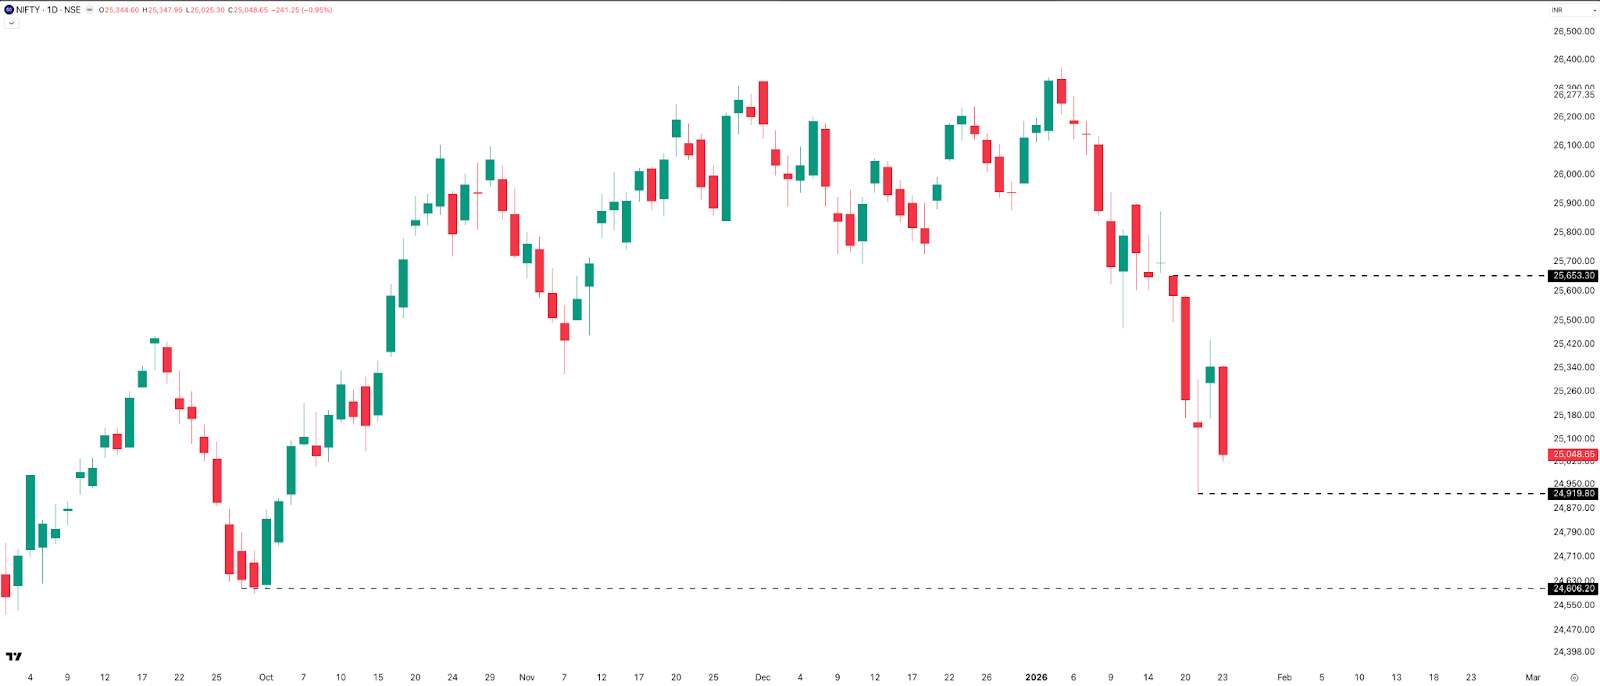
On the daily timeframe, NIFTY printed four red candles and one green candle. Out of the four red sessions, two were nearly 1% down days, highlighting elevated volatility.
There is visible buying interest in the 24,900–25,000 zone, and the index has managed to close above 25,000. This big round number now acts as a key psychological support.
The remaining support and resistance levels remain unchanged from the weekly chart. On the upside, resistance stands at 25,650, while immediate support is at 24,900, followed by 24,600.
Hourly Timeframe
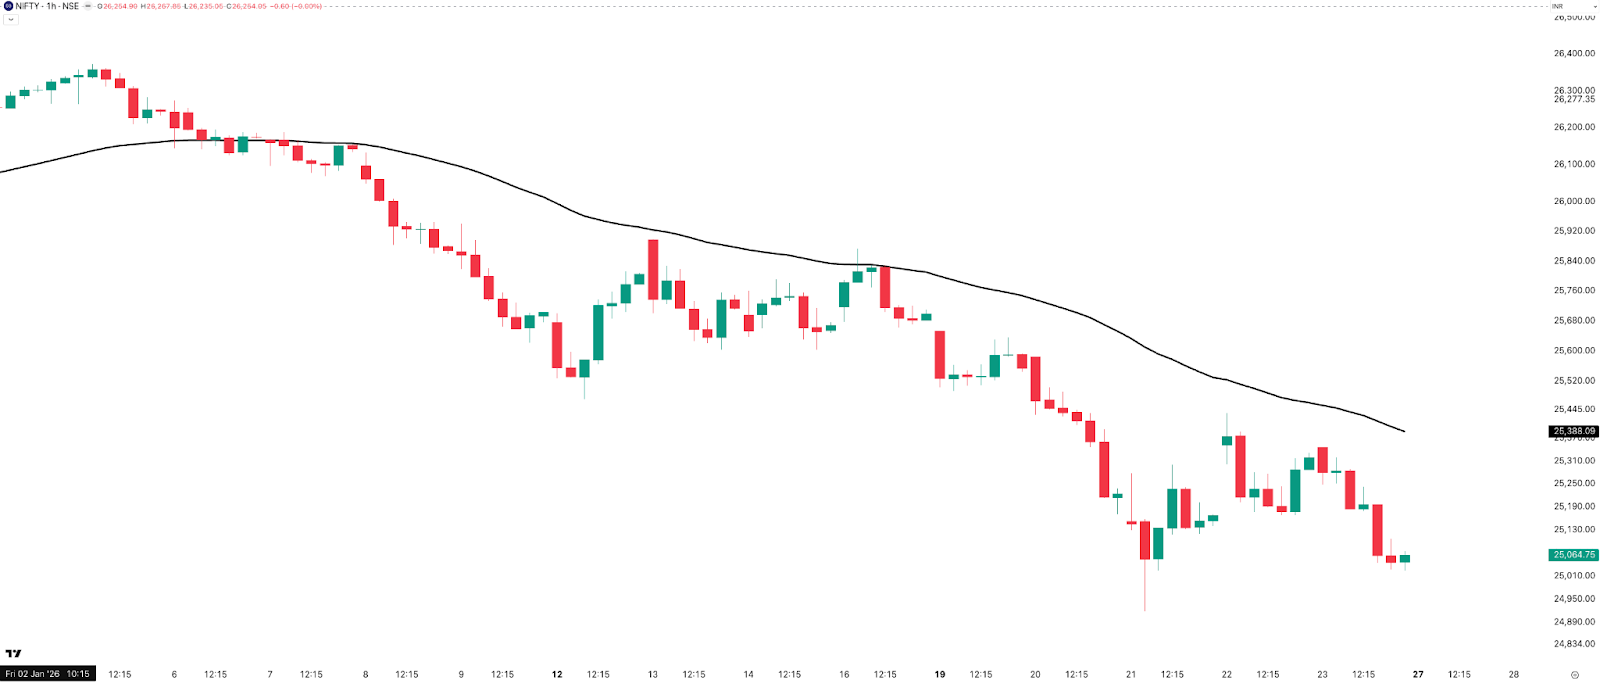
On the hourly chart, NIFTY continues to trade below the 50 EMA. We have now seen a clean short-term trend for nearly two weeks, and it has been firmly on the downside. Let’s not jinx it for the trend followers.
Expected Range Till Expiry
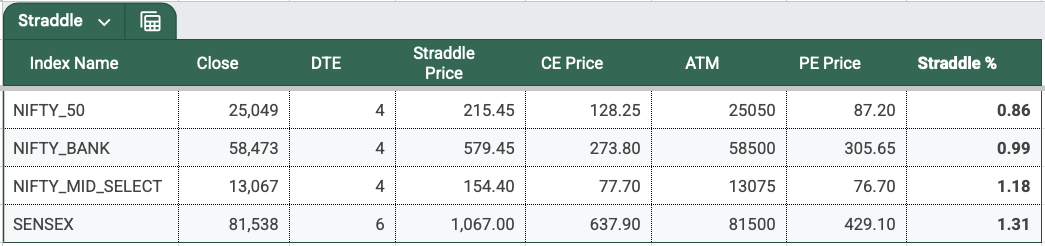
Moving to NIFTY’s expected range into the upcoming monthly expiry on Tuesday, 27th January. Based on options data, the ATM straddle closed around 215 points. This is NIFTY’s one-day-to-expiry (1DTE) premium, with Monday being a holiday due to Republic Day. A long weekend, ongoing geopolitical uncertainty, the upcoming union budget, and the ever-pending India–US trade deal have all contributed to elevated risk. This is clearly reflected in the high straddle premium.
With NIFTY spot closing near 25,049, the implied expiry range stands at:
- Upside: 25,264
- Downside: 24,834
This translates to an implied move of roughly 0.86% on either side.
Open Interest Analysis
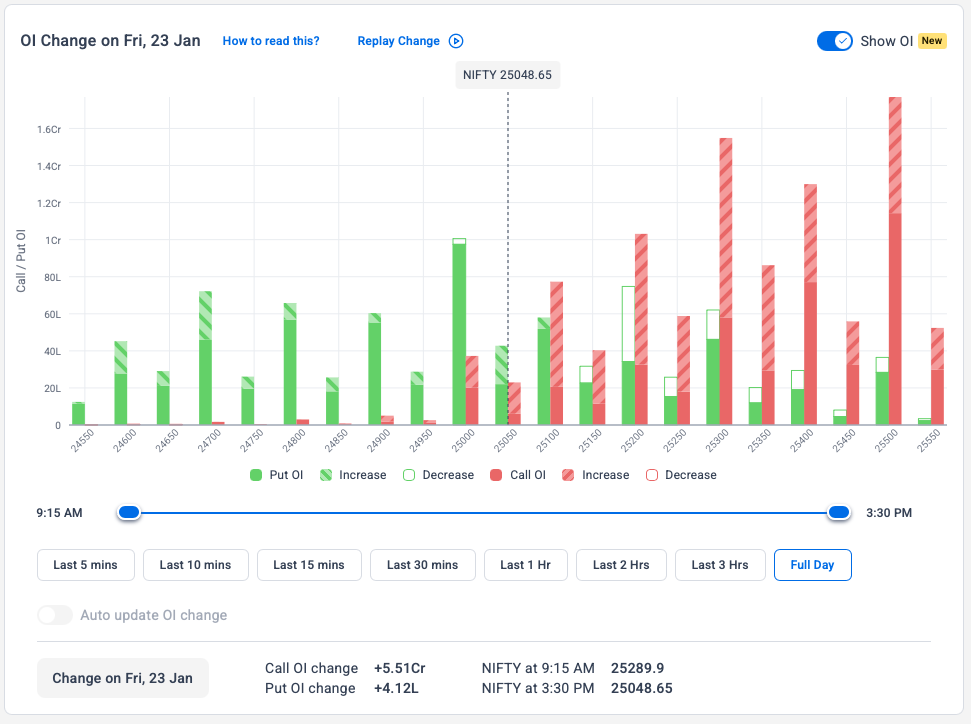
Looking at the open interest data, on the call side, the 25,500 and 25,300 strikes carry the highest open interest. On the put side, open interest remains weaker compared to calls. The 25,000 put saw unwinding through Friday’s session, but still holds the highest open interest on the put side.
Given the current high volatility, it is difficult to clearly gauge support and resistance levels using open interest data. With that, I’ll wrap up the OI analysis for the week.
SENSEX: Breaking All Supports
Weekly Timeframe
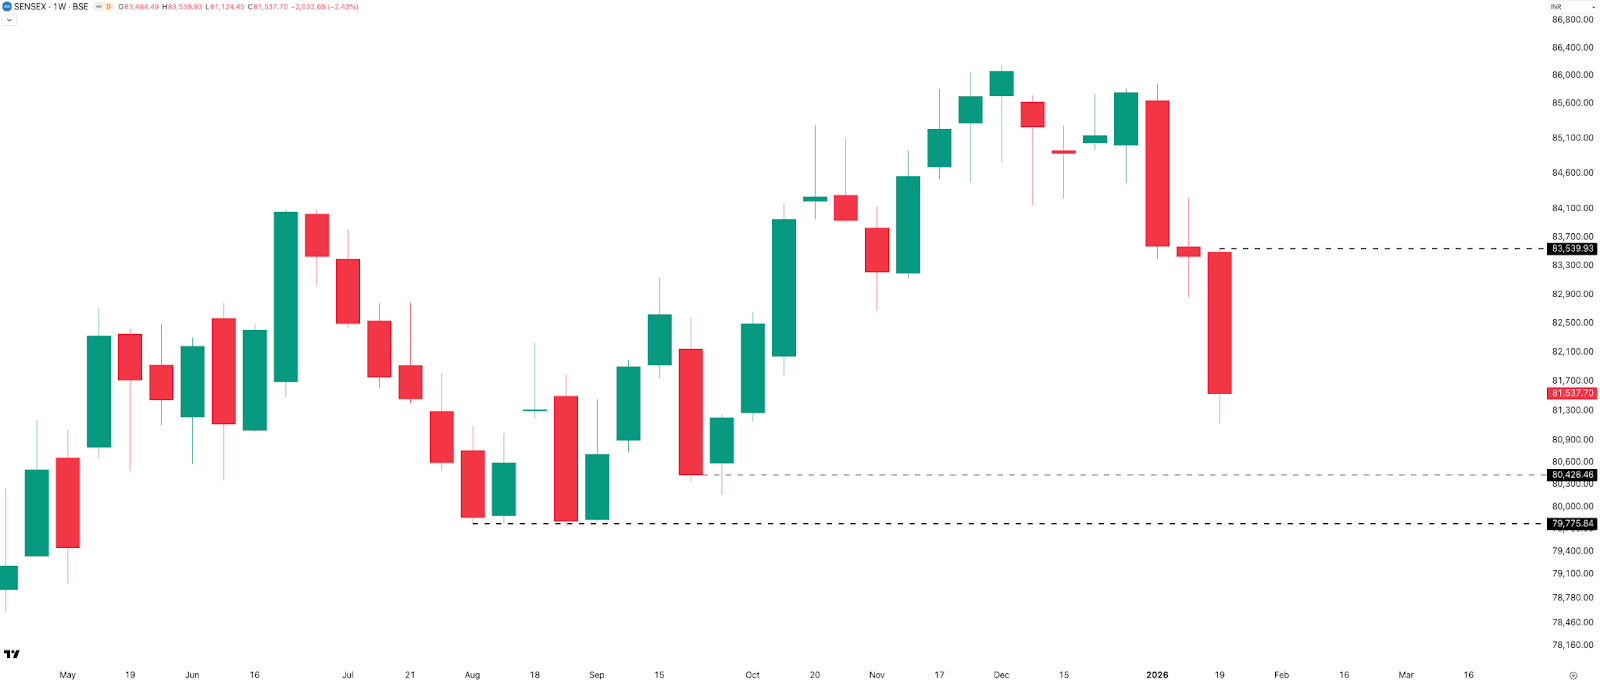
On the weekly timeframe, similar to NIFTY, SENSEX also resumed its downward move after last week’s pause. SENSEX fell another 2,032 points, or 2.43%, this week to close at 81,537. It has broken all the support levels discussed last week. The next key weekly supports are now placed at 80,400 and 79,800.
The bias remains bearish unless SENSEX manages a close above this week’s high of 83,540, which now acts as a resistance.
Daily Timeframe
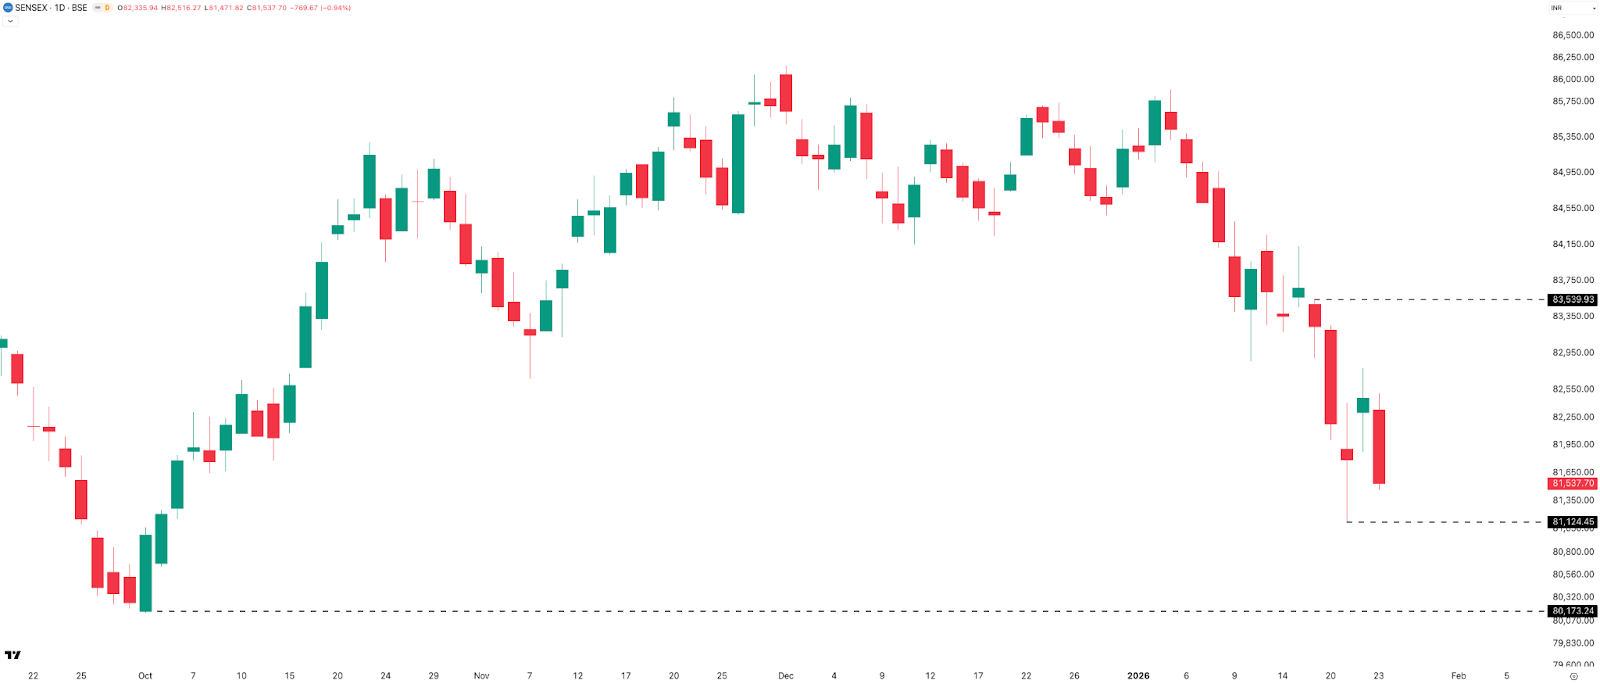
On the daily timeframe, the week’s high at 83,550 and low at 81,100 remain the immediate resistance and support, respectively. The structure remains a clear downtrend, with the index continuing to form lower highs and lower lows on the daily chart.
Expected Range Till Expiry
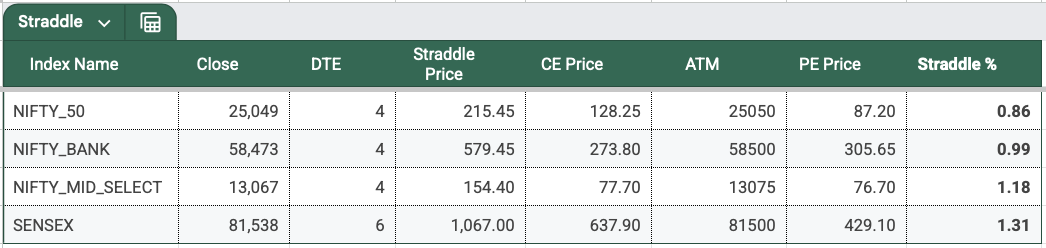
The next SENSEX expiry falls on Thursday, 29th January 2026, and it is a monthly expiry. With just three days to expiry, the ATM straddle closed in four digits at 1,067, marking a sharp increase in volatility compared to previous weeks. Based on this pricing, the implied expiry range comes to:
- Upside: 82,605
- Downside: 80,471
This broadly places SENSEX in an 82,600 to 80,500 range.
This is the last expiry before the budget, so elevated premiums are expected. However, this premium is likely to melt ahead of the actual event. While this presents opportunities in both NIFTY and SENSEX from an options premium perspective, the risk remains high. Let me know in the comments what strategies you’re using to harvest this premium.
BANKNIFTY: Finally Gives Up
Weekly Timeframe
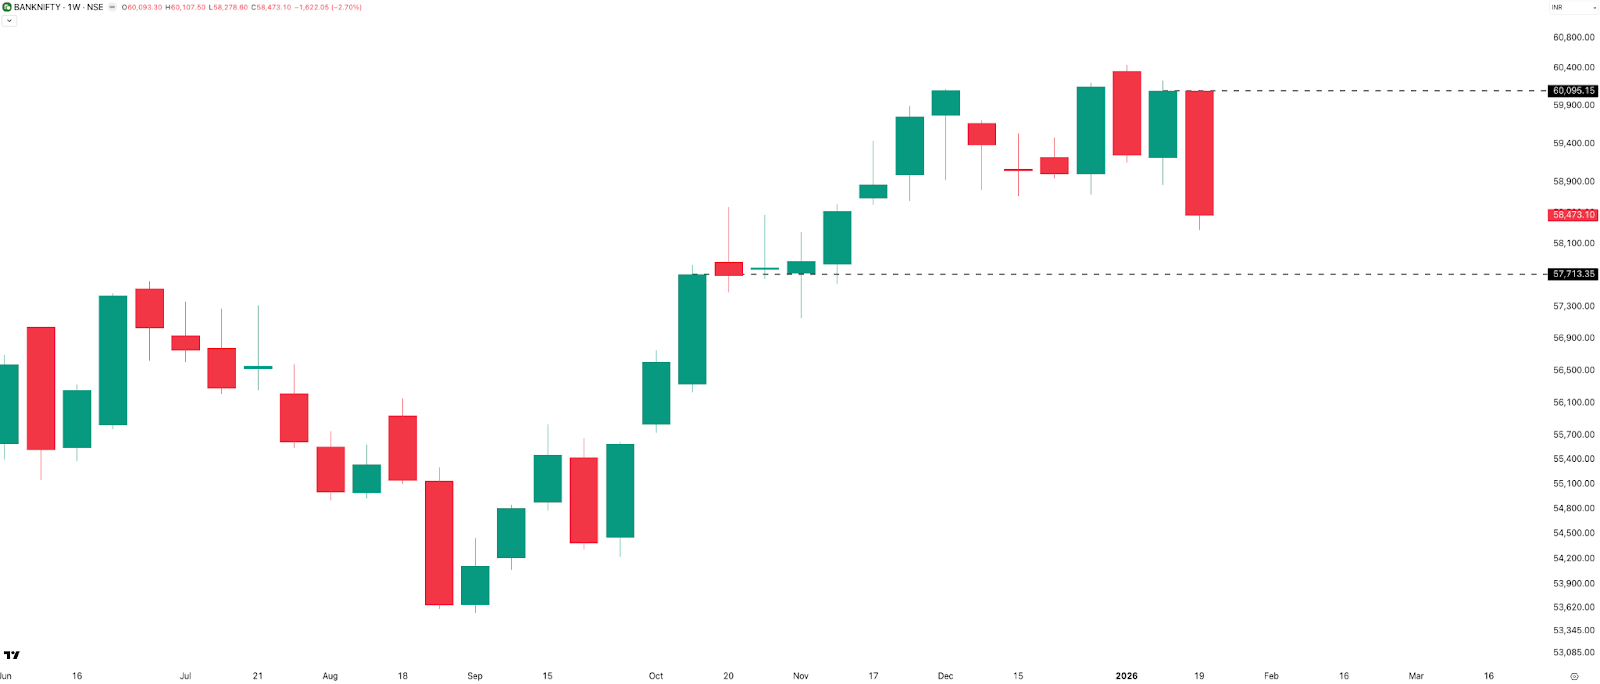
After holding up for several weeks, BANKNIFTY finally gave up this week, falling 2.7% or 1,622 points to close at 58,473. This marks the highest absolute weekly move in the last 20 weeks. The previous one was in the last week of August 2025. The index also came close to forming an open-equals-high candle, highlighting strong selling pressure.
Resistance is placed at this week’s high of 60,100, while support is seen near 57,700. This creates a very wide trading range of nearly 2,400 points, driven by the recent surge in volatility and range expansion.
Daily Timeframe
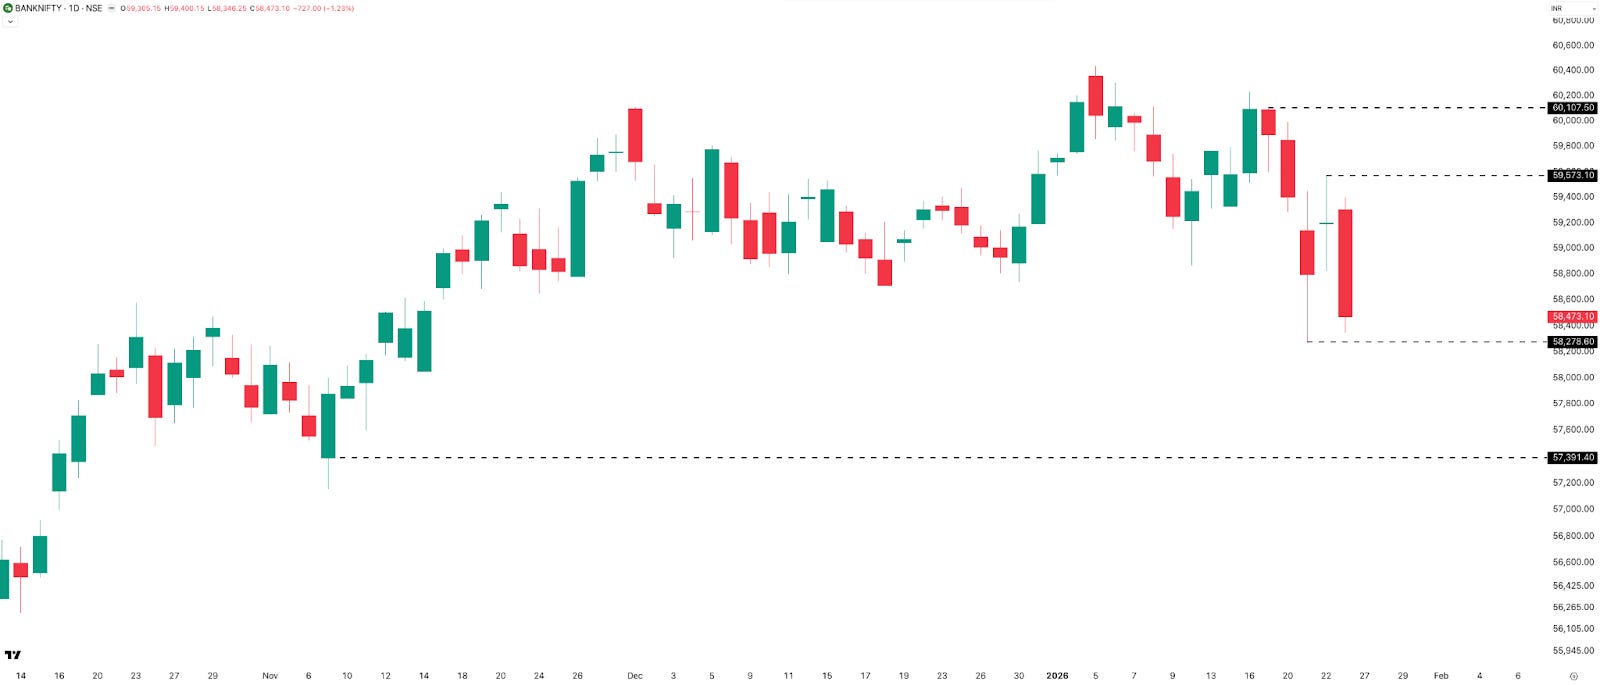
On the daily timeframe, BANKNIFTY printed four red candles and one green candle this week. The immediate support to watch is the recent low at 58,276. If this level breaks, the next support comes in around 57,400. On the upside, resistance remains at 59,600, followed by 60,100.
Hourly Timeframe
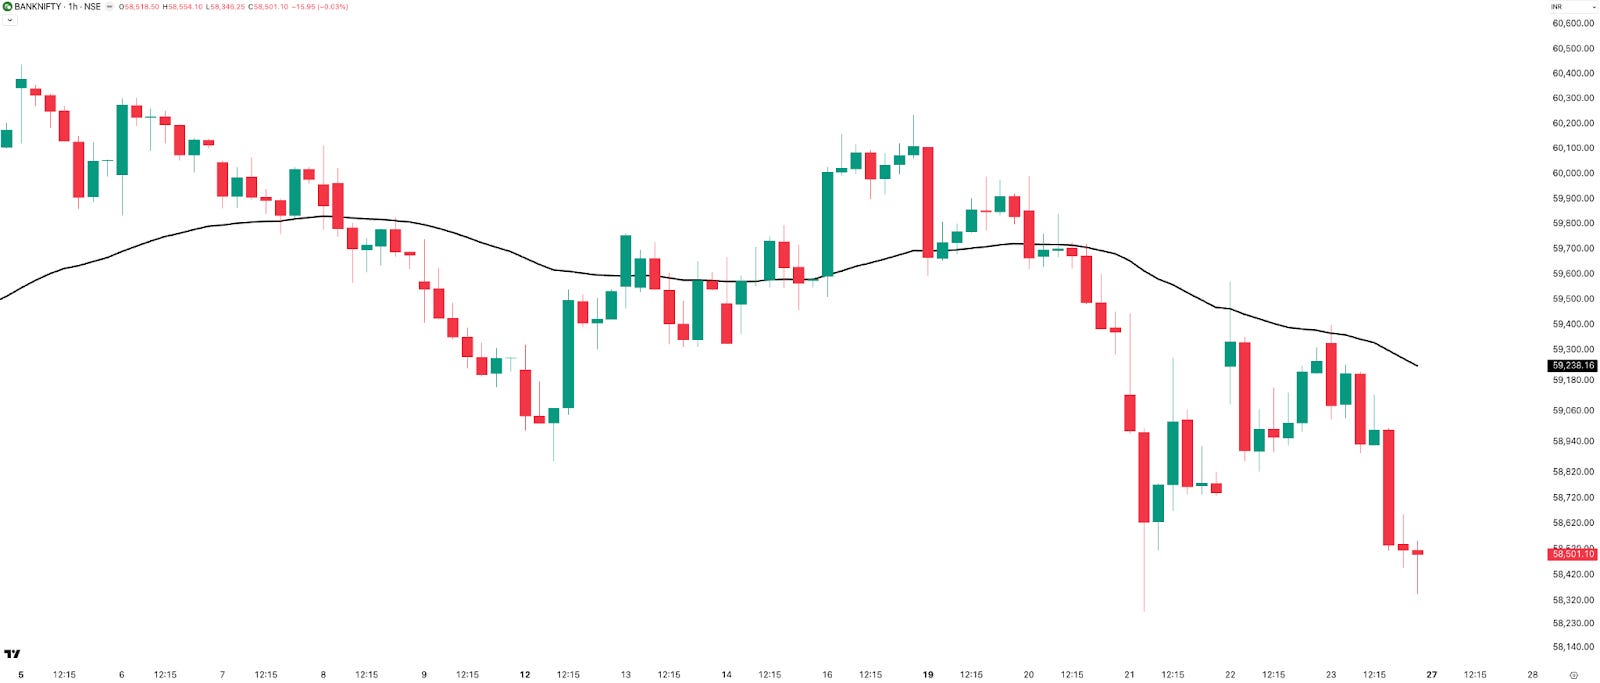
Unlike NIFTY, BANKNIFTY on the one-hour chart is chopping around the 50 EMA and is not offering a smooth downtrend. Hourly candle ranges remain wild, making it difficult for short-term trend followers. Trend following in sectoral indices like BANKNIFTY is generally harder compared to broader indices like NIFTY. However, when BANKNIFTY does trend, the rewards can be significant.
Rate of Change: Deep Red Everywhere
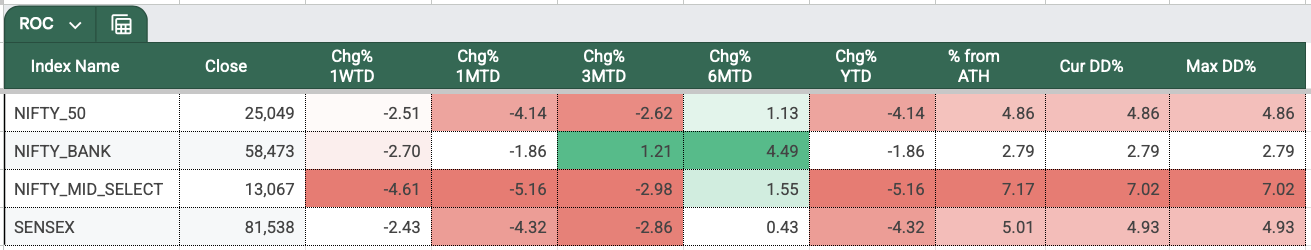
In the fourth week of 2026, it was deep red across indices. NIFTY, SENSEX, and BANKNIFTY all fell over 2.5%, while MIDCPNIFTY underperformed, losing 4.61%. January is historically a negative month, and this year is turning out to be no different.
Sectoral Performance: Defensives Hold Up
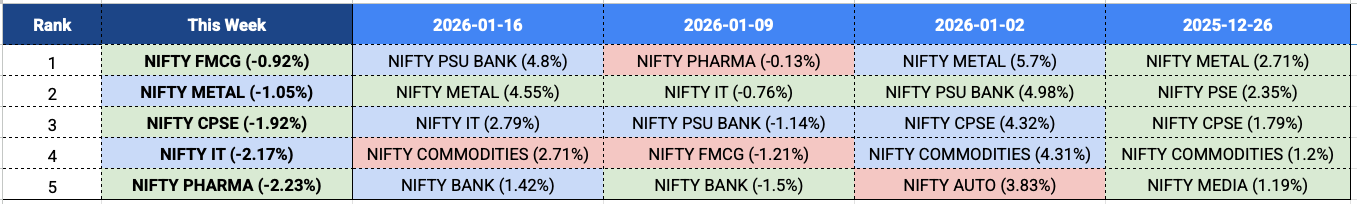
Moving on to the top-performing sectors this week—or rather, the sectors that fell the least. FMCG declined the least at 0.92%, followed by Metal, CPSE, IT, and Pharma. Metal and IT continue from last week, while the other three are new entrants this week. The presence of defensive sectors during a market decline reflects classic market behaviour.
Range Expansion and Wild Expiries
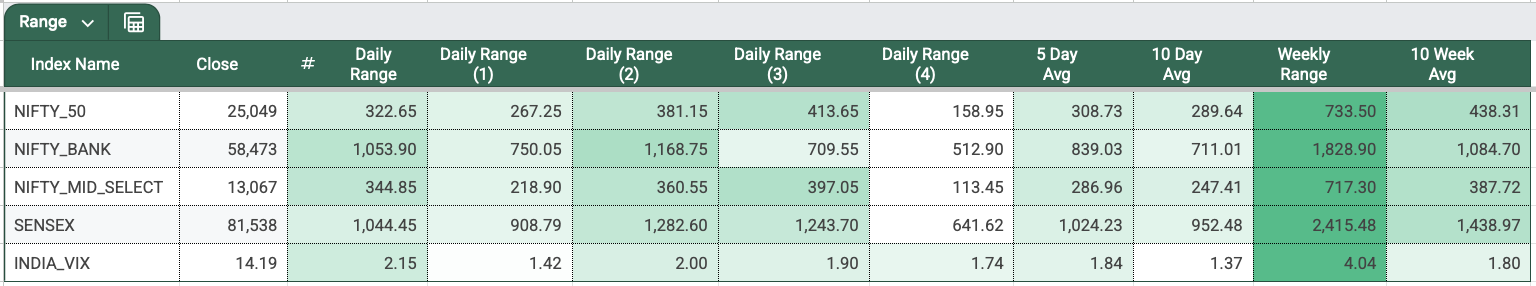
This week saw a 15% expansion in range compared to last week, with the five-day average daily range rising to 309 points from 271. Weekly ranges also expanded across indices. Wednesday recorded the highest daily range for BANKNIFTY and SENSEX (daily range (2)), while Tuesday saw the highest range for NIFTY and MIDCPNIFTY (daily range (3)).
SENSEX Expiry: Absolute Insanity
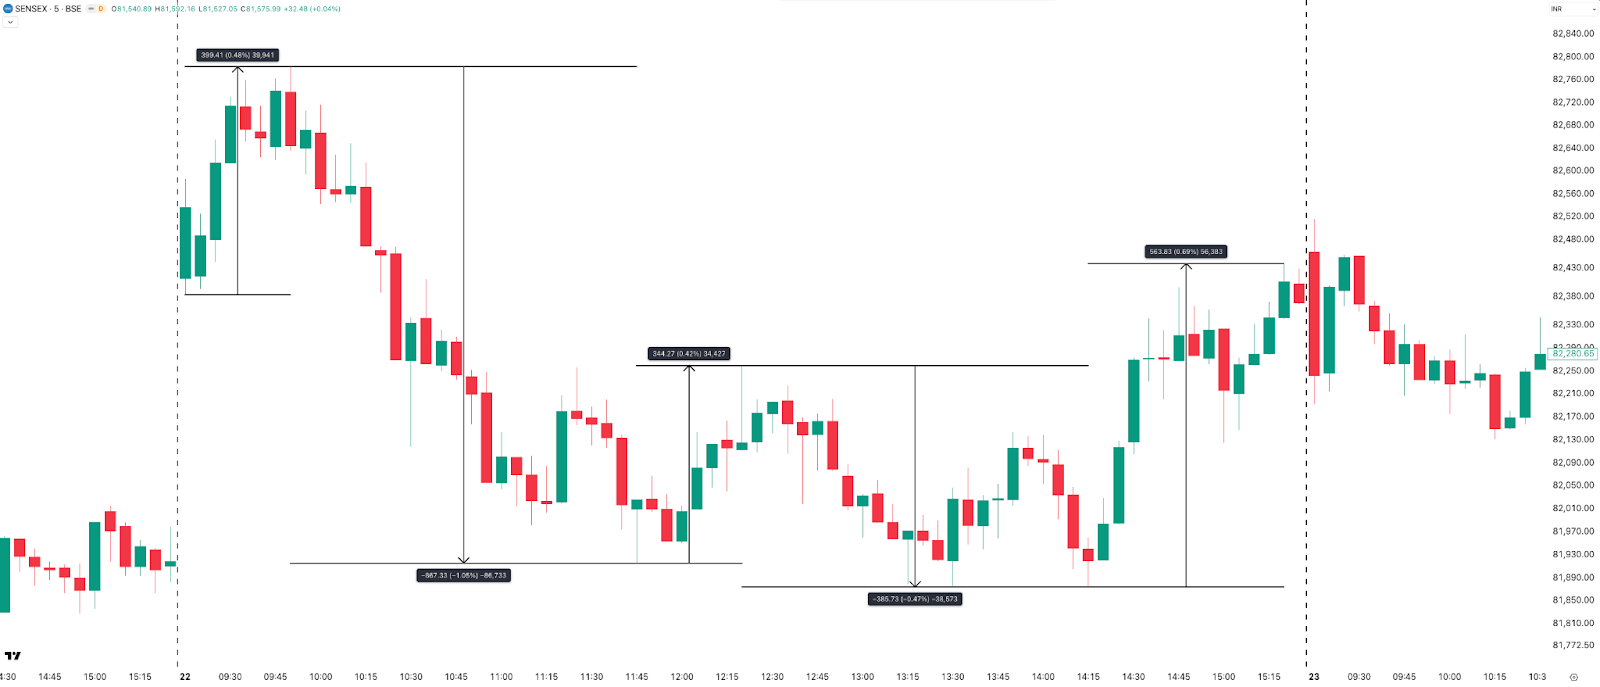
Let’s talk about SENSEX expiry first. Just look at the wild intraday swings on this five-minute chart: plus 400, minus 867, plus 345, minus 385, then plus 563. Absolute insane volatility. Easily one of the toughest trading days in many months.
What hurt options writers the most was the combination of sharp moves and elevated premiums, leading to large absolute losses. This is exactly why stop-losses should be managed at a portfolio level, and not just based on individual option premiums.
NIFTY Expiry: Relatively Easier
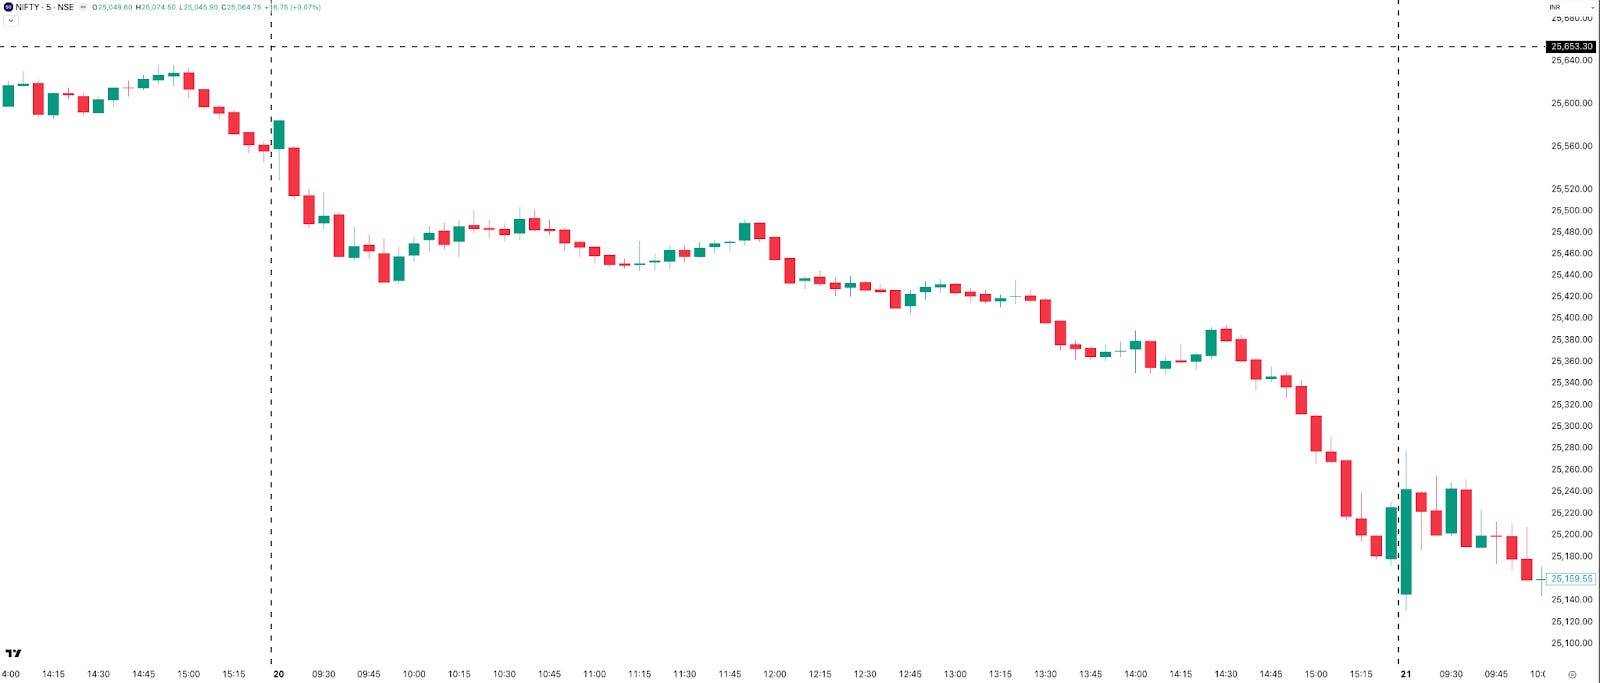
NIFTY expiry, on the other hand, was relatively easier, as it offered a clean directional move. However, coming straight from a low-volatility environment, the same strategies and risk management approaches don’t work anymore. Different market regimes demand different strategies.
That said, it’s always easier said than done, and everything looks obvious in hindsight. With two monthly expiries lined up next week amid heightened uncertainty, it’s going to be anything but easy. Let’s see what the market has in store.
INDIAVIX: Surging Higher
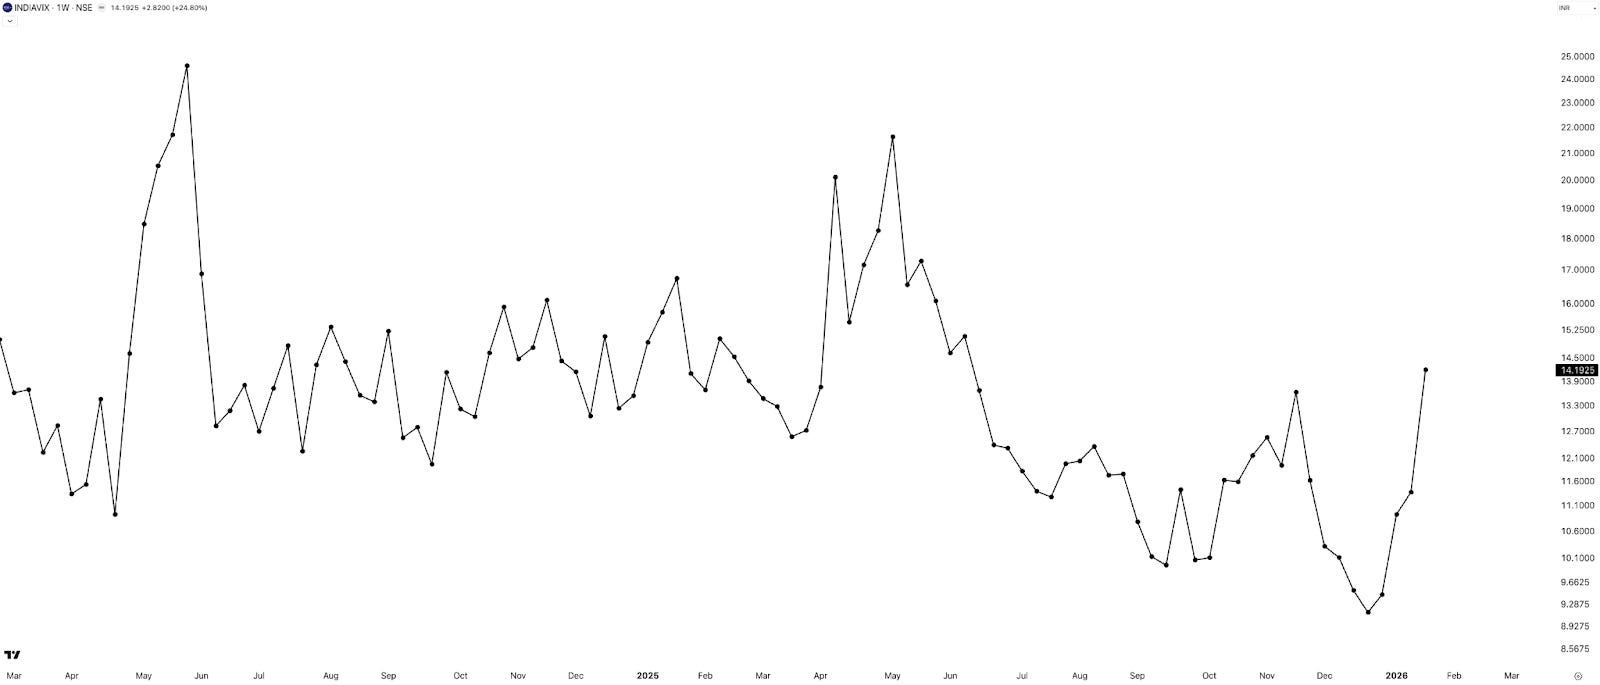
INDIA VIX surged 25% this week to close at 14.19. With the coming week being the pre-budget week, the key question is where VIX heads next. My view is that VIX could move towards the 17–18 zone before cooling off after the budget announcement.
Commodities: Natural Gas Goes Parabolic
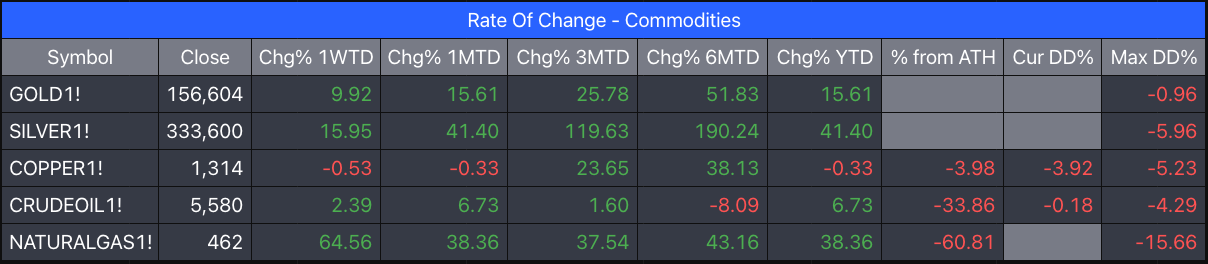
(Data: MCX Continuous Futures - Back Adjusted)
If you thought equities were volatile this week, commodities took it to another level. Gold surged 10%, Silver jumped 16%, and Natural Gas exploded 65% in a single week. Yes, 65%.
On a year-to-date basis, Silver is already up 41% in less than a month, while Gold is up 16%.
In both Gold and Silver, we saw extremely sharp ranges of around 10% and 18% on Thursday, despite USD prices not falling to the same extent. Some speculate this could be due to MTF positions built into these ETFs. Let me know what you think.
In Summary
Markets remained largely bearish this week, with NIFTY, SENSEX, and BANKNIFTY all closing in red. Volatility obviously has picked up both due to geopolitical tensions and the upcoming budget.
Sector performance was weak, with METAL and FMCG managing to hold up a bit.
Overall, the market tone is bearish with rising volatility. They used to say Januarys are tough, but I didn’t expect it to be this tough.
What Caught My Attention This Week
First , I came across an interesting article on when we do sell. Given this mad rally in metals, especially in Gold and Silver, a friend of mine asked me if he should sell out. I pointed him to the above article
Second , I have been following this whole prediction markets space in the US for a while. Last week, I read this interesting NYT piece titled “Betting on Prediction Markets Is Their Job. They Make Millions.” It talks about how the winners devise strategies to make better predictions, also touches on the fact that since these markets are not regulated, there is a possibility of insider trading as well.
Lastly , how can I not share this Guardian piece on Greenland’s Sovereignty issue—it talks about why Trump is interested in Greenland after all.
What to Expect in the Coming Week
Next week is a four-day trading week, thanks to Monday being a holiday on the eve of Republic Day. There are no events lined up during the week, but we have a union budget on 1st Feb, which is a Sunday and a working day. Volatility may continue to rise up to the budget day, as I had shared in my previous Budget Day strategy video.
Talking about the markets, the overall sentiment remains bearish. But given that we’ve been down for a couple of weeks, I do expect some bounce from these levels. Commodities are still not showing any signs of slowing, so that may continue as is.
And with that, we wrap up this week’s Market Metrics.
If you find this series useful, don’t forget to subscribe to the channel.
Until then—stay curious, stay steady, and enjoy your weekend.