Hello and welcome to the Weekly Market Metrics! We’re in Week 6 of 2026.
This was both a good and a bad week. Good in many ways as the uncertainty around tariffs got resolved, bad because, for traders, from what we know, it has not been easy at all—we are being very conservative when we say that.

Markets have indeed moved in a positive direction, but are still consolidating with no further directional progress.
Anyways, let’s check the charts and see how the price action played out this week. We’ll also look at what is possible in the coming week.
Quick note before we start: this was a six-day trading week. All data covers Sunday, February 1st, through Friday, February 6th.
NIFTY: Wide Range, Long Wicks
Weekly Timeframe
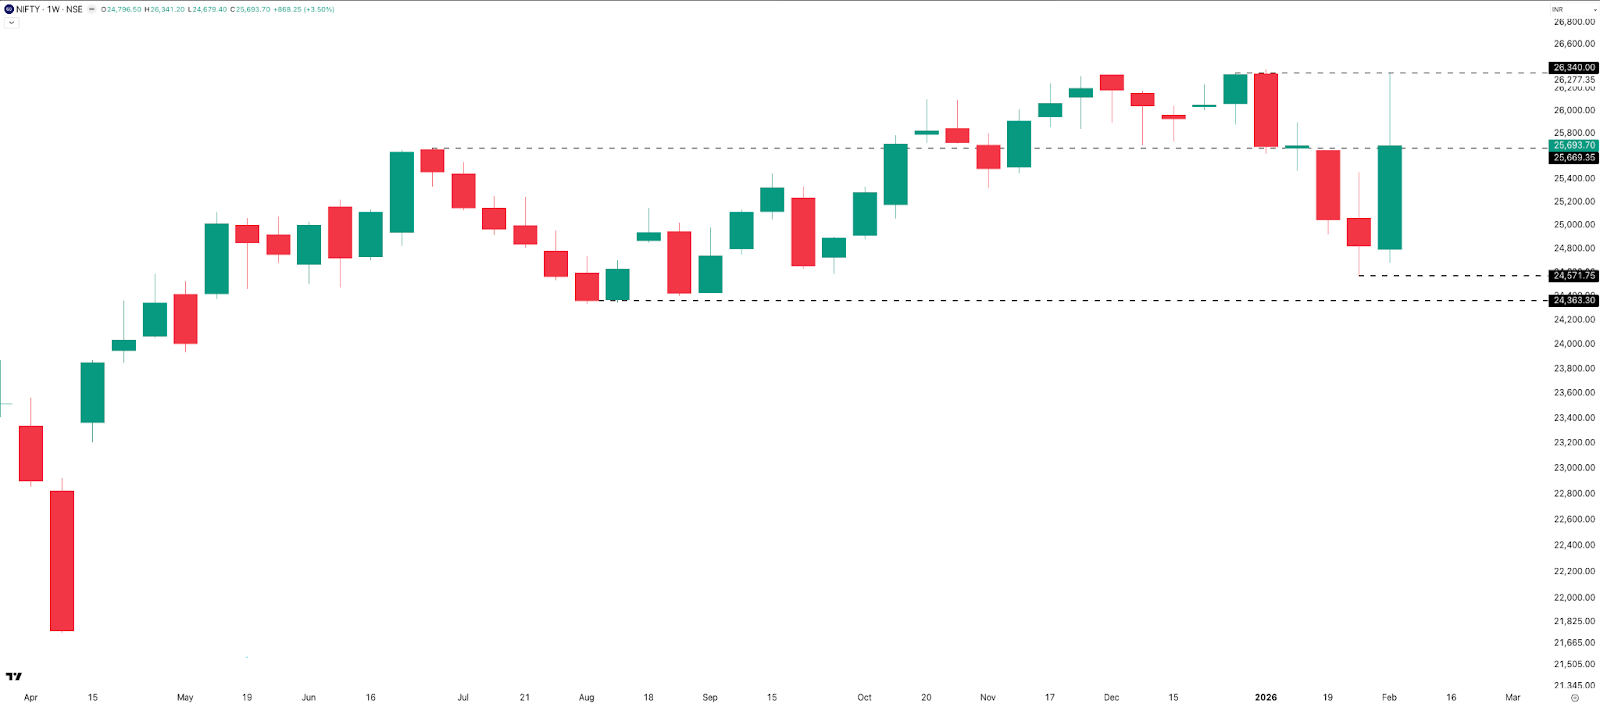
For the week, NIFTY gained 446 points, up 1.77% from last Friday’s close.
The weekly candle shows a long upper and lower wick, with a wide range of 1,769 points, or 7.2%, all within six trading sessions. The upper wick reflects the sharp gap-up following the US–India trade deal announcement and the subsequent selloff from the first tick on Tuesday, while the lower wick marks the low made on Budget Day, which was on Sunday.
The week’s high, which is close to the all-time high of 26,350, acts as resistance. On the downside, 24,571—the Budget Day low—will act as support on the weekly timeframe.
Daily Timeframe
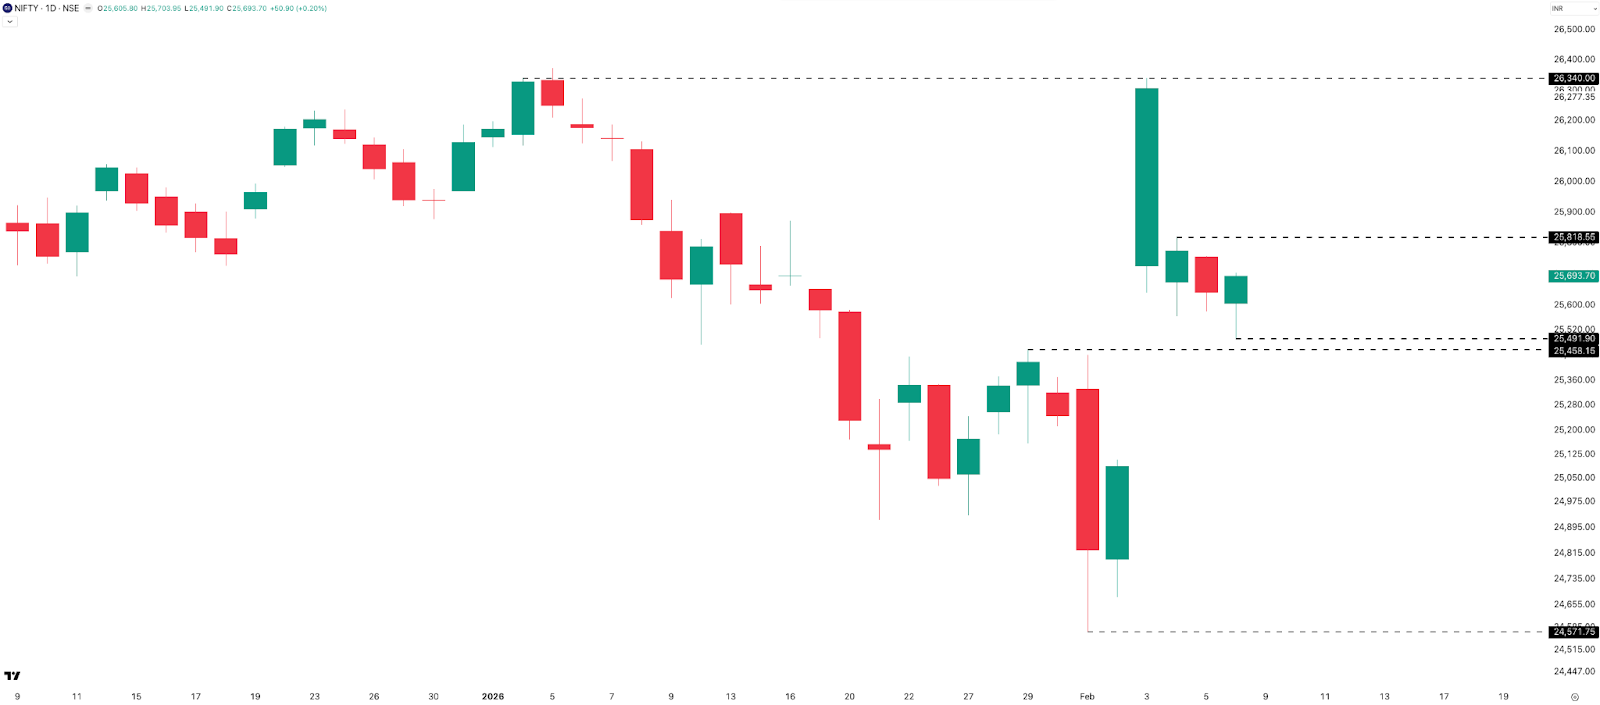
On the daily timeframe, NIFTY printed four green candles and two red candles in this six-day trading week. The index fell around 650 points from the high made on Tuesday, 3rd February, to close at 25,693.
Support lies at the 25,500-25,450 zone and resistance at 25,800. The 384-point gap between 25,108 and 25,492 is yet to be filled. Will NIFTY come back to fill this gap, or will it remain unfilled? Your guess is as good as mine.
Tuesday’s wide candle made the price action very difficult to read, and the chart looks all over the place with respect to price action. It is better to let the price action form over the next week before looking at it again.
Hourly Timeframe
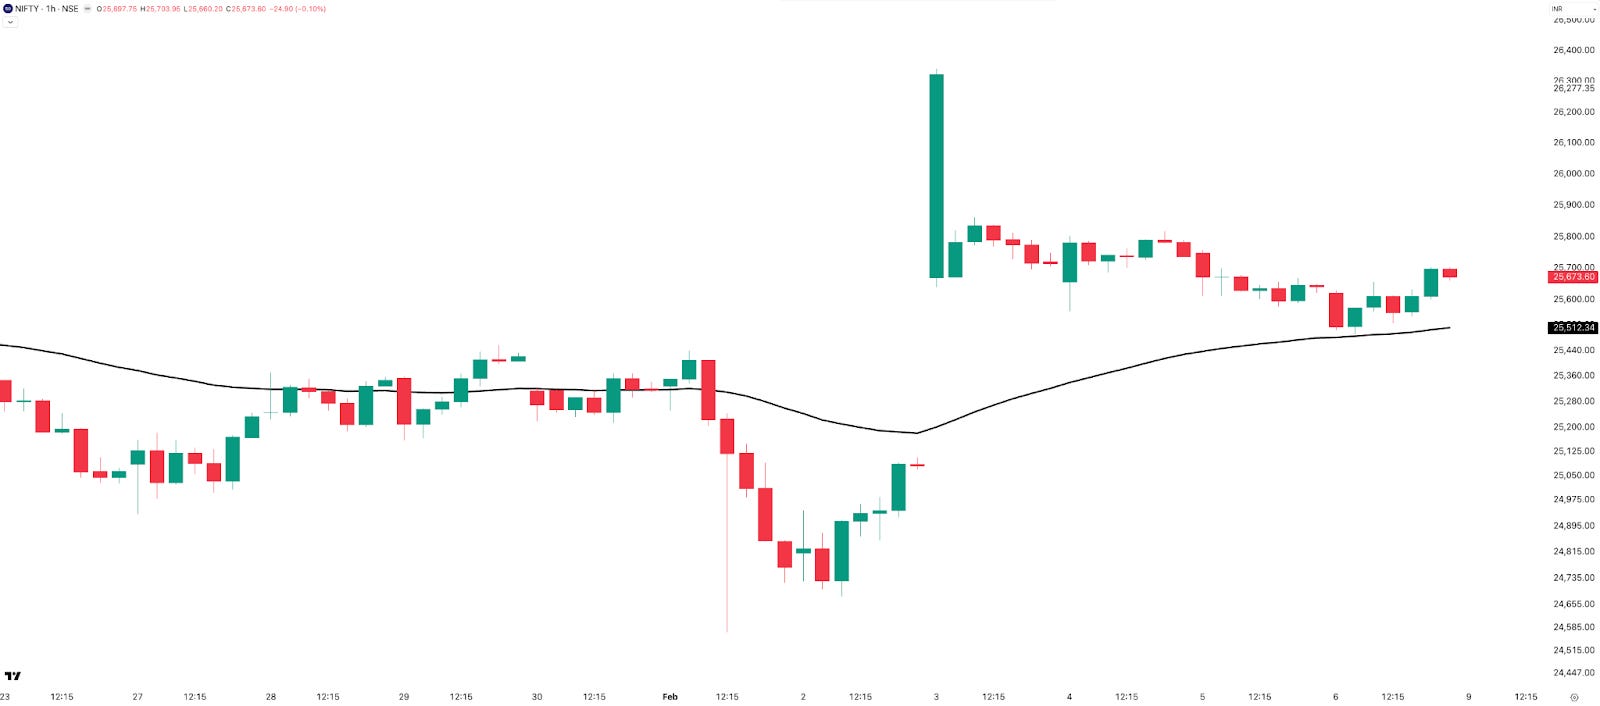
On the one-hour timeframe, the price remained below the 50 EMA after crossing it briefly in the first hour of Budget Day. After that, on Tuesday, with the mega gap-up, the price jumped above the EMA and stayed above it till the end of the week.
It was one of the most treacherous weeks for short-term trend followers, more so after a clean downtrending January month. Let’s see if the price chops around the EMA or gives a clear directional move in the coming week.
Expected Range Till Expiry
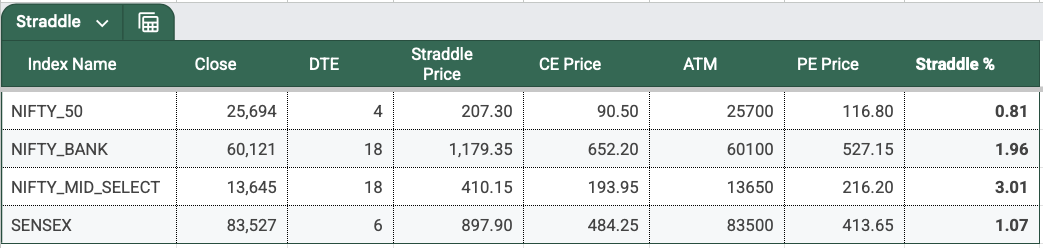
Moving to NIFTY’s range till expiry, NIFTY’s 2 DTE ATM straddle premium closed at 207 this week, which is pricing in a 0.81% move on either side.
Based on the current straddle pricing, the expected range till expiry is:
- Upside: 25,900
- Downside: 25,487
Open Interest Analysis
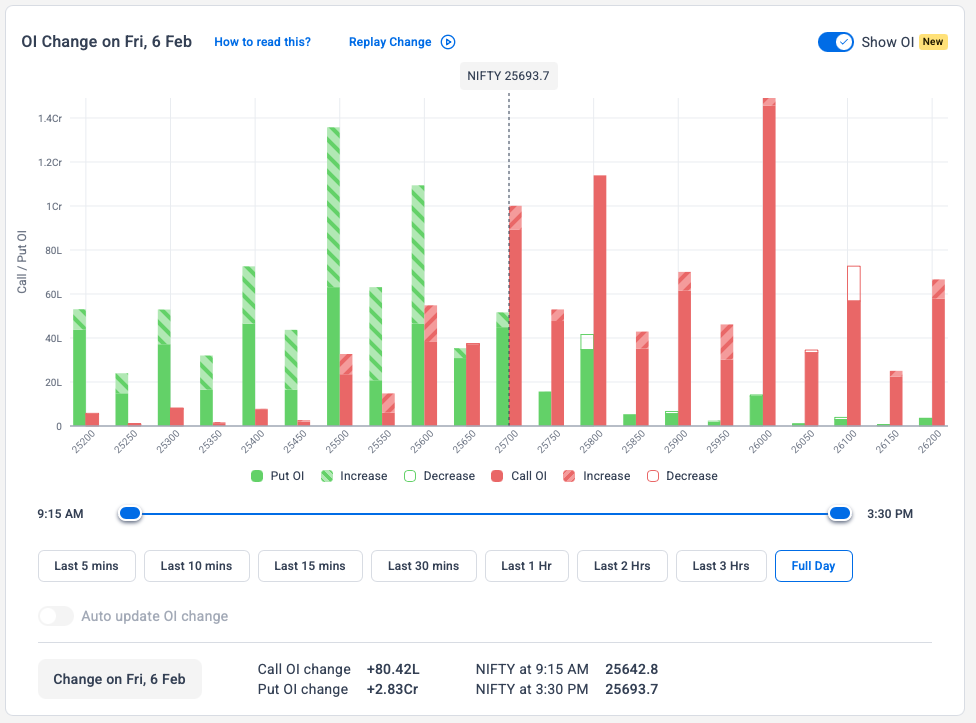
For the upcoming NIFTY weekly expiry on Tuesday, 10th February, 26,000 CE and 25,500 PE have the highest open interest as of Friday’s close. The second-highest open interest is at 25,800 CE and 25,600 PE. So, 25,500 and 25,800 levels are coming up here as well. Do watch out for these levels.
SENSEX: 7.5% Weekly Range
Weekly Timeframe
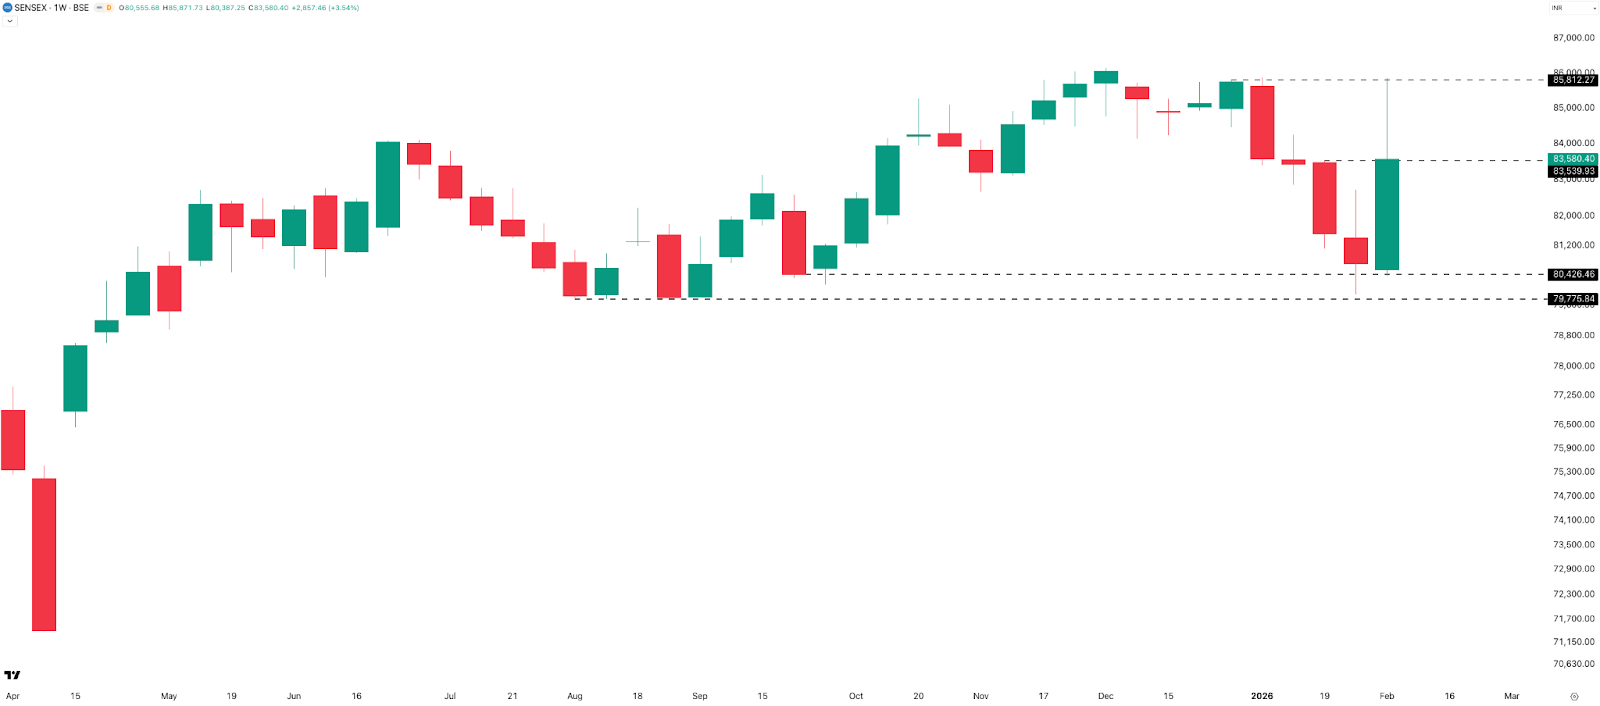
On the weekly timeframe, SENSEX gained 2% or 1,633 points to close at 83,580. The range for the week was 5,972 points, or 7.47%. That’s a seriously wide range for a single week.
Support levels are seen at 80,400 and 79,900, which is the Budget Day low, while the next key resistance sits near 85,800.
Daily Timeframe
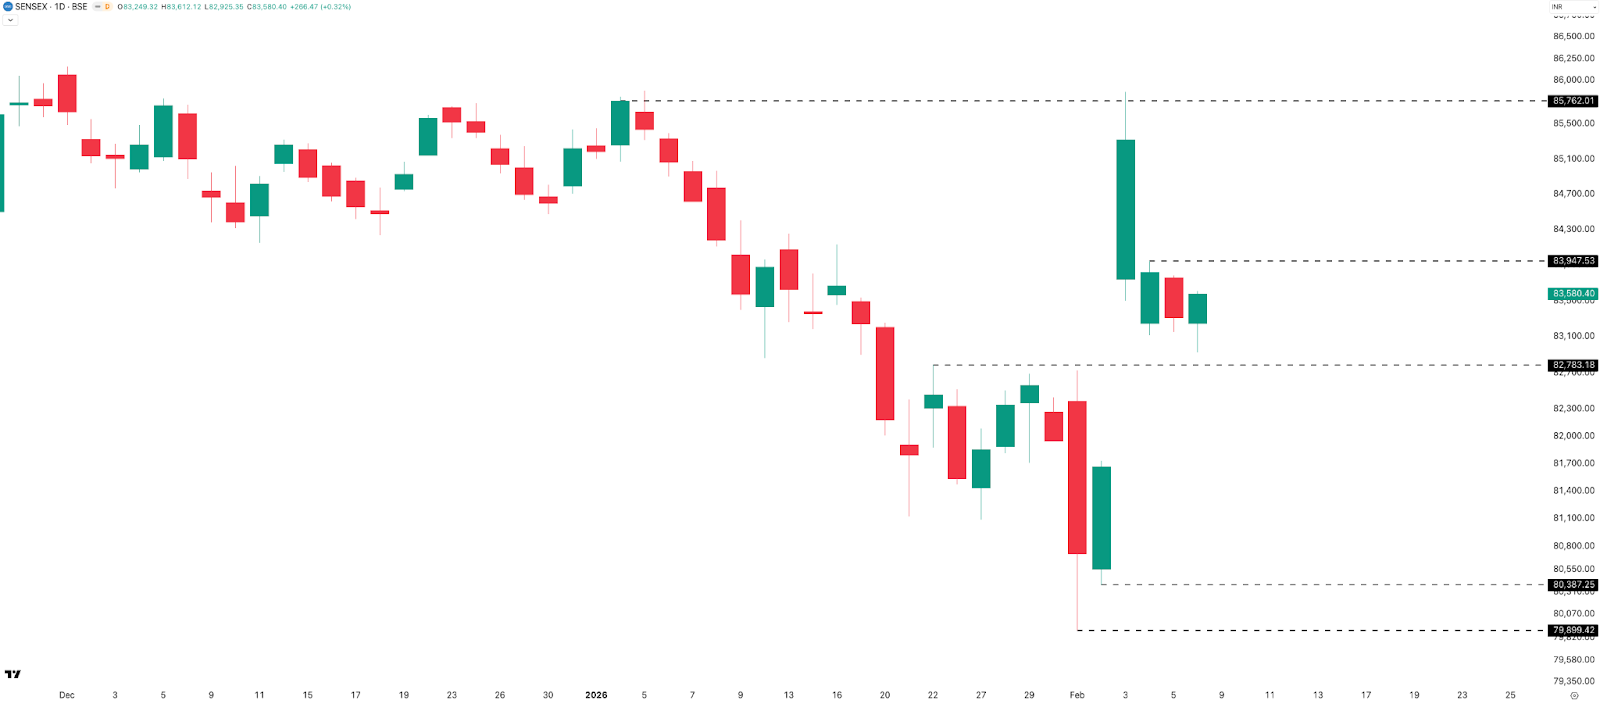
On the daily timeframe, similar to NIFTY, SENSEX printed four green and two red candles. The immediate resistance is in the 83,950–84,000 zone, and above that at 85,800. Support is at 82,800, then at 80,400, and 79,900, which is the Budget Day low.
Expected Range Till Expiry

The next weekly SENSEX expiry is on Thursday, 12 February 2026. With four days to expiry, the ATM straddle closed at 895 points. This implies an expiry range of:
- Upside: 84,475
- Downside: 82,685
This broadly places SENSEX in the 84,500 to 82,700 range going into expiry.
BANKNIFTY: All-Time High Weekly Close
Weekly Timeframe
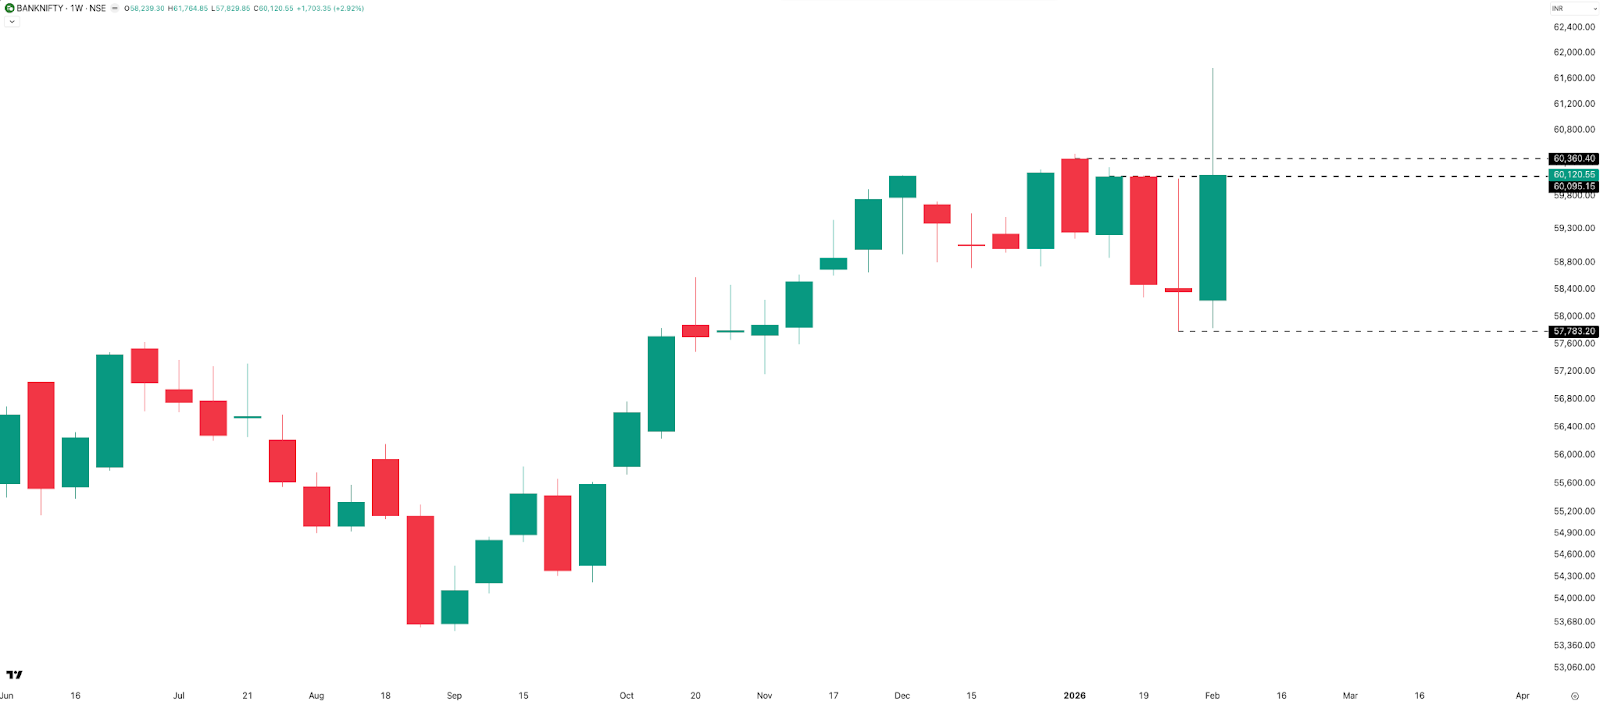
On the weekly timeframe, BANKNIFTY gained 578 points or 0.97% from last Friday’s close and has given an ATH weekly close this week. BANKNIFTY made a high of 61,765 this week on Tuesday following the US–India trade deal announcement, but gave up 1,644 points, or 2.66%, from that high to close at 60,120. The range for the week was 3,982 points, or 6.9%.
Resistance is seen at 60,360 and then at the recent high of 61,765, while support is at 57,800.
Daily Timeframe
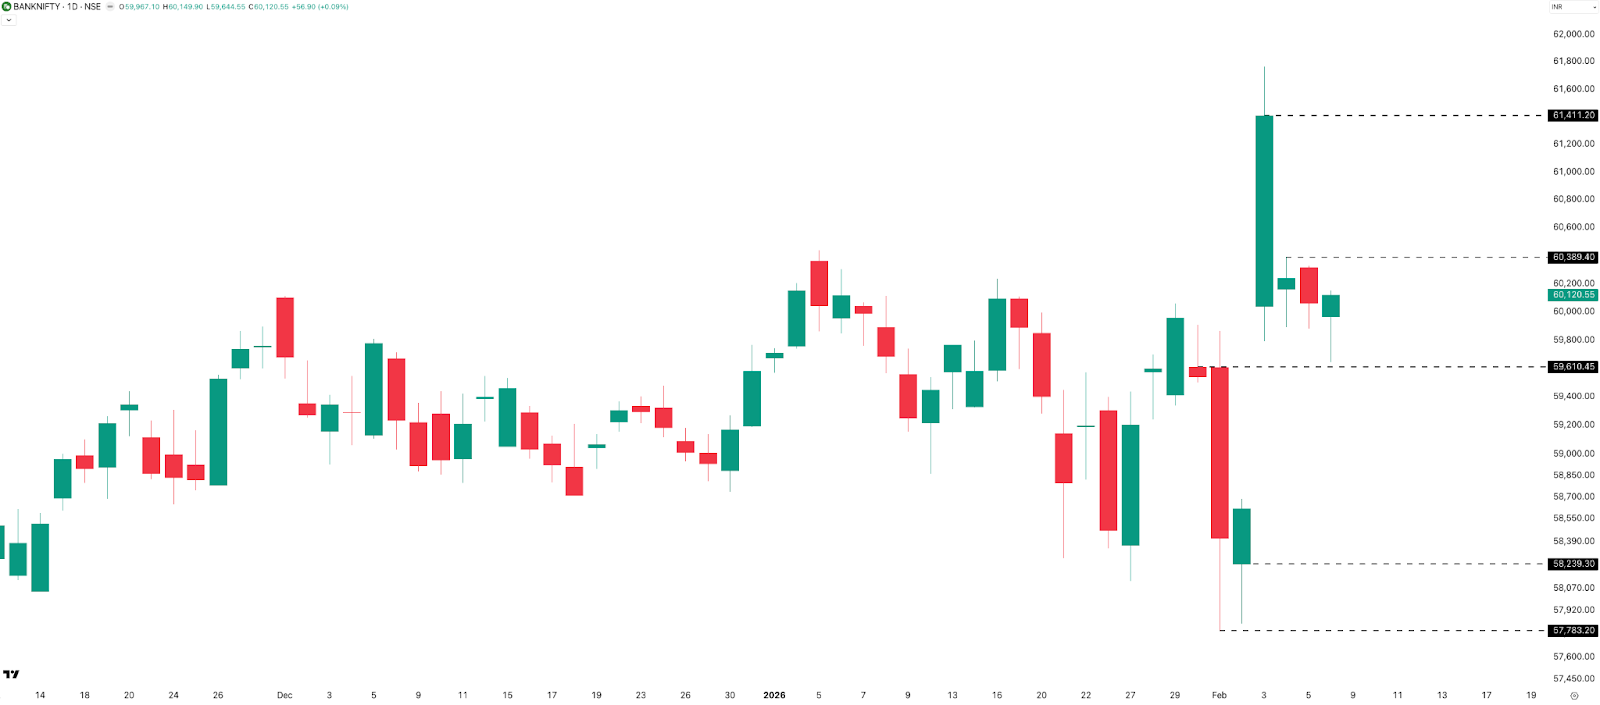
On the daily timeframe, supports are at 59,600, 58,250, and 57,800. Resistance is at 60,400 and 61,400. The price action is distorted, so it is better to observe next week’s price action.
Hourly Timeframe
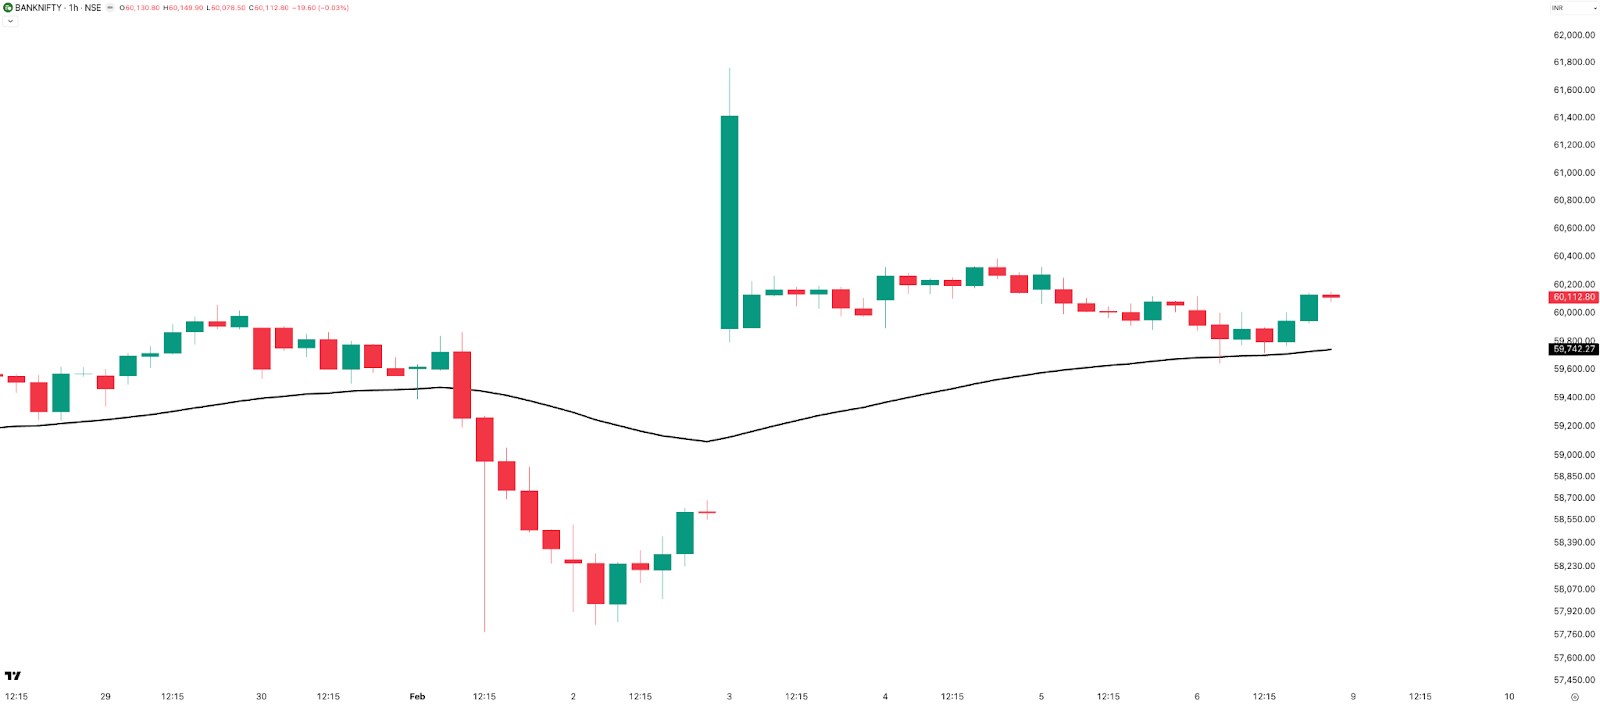
On the hourly timeframe, similar to NIFTY, BANKNIFTY also briefly moved above the 50 EMA on Budget Day and then moved down, only to come back above it with a mega gap-up on Tuesday and stay above it until the end of the week. A very painful week for short-term trend followers, even in BANKNIFTY. The short-term bias remains sideways to positive.
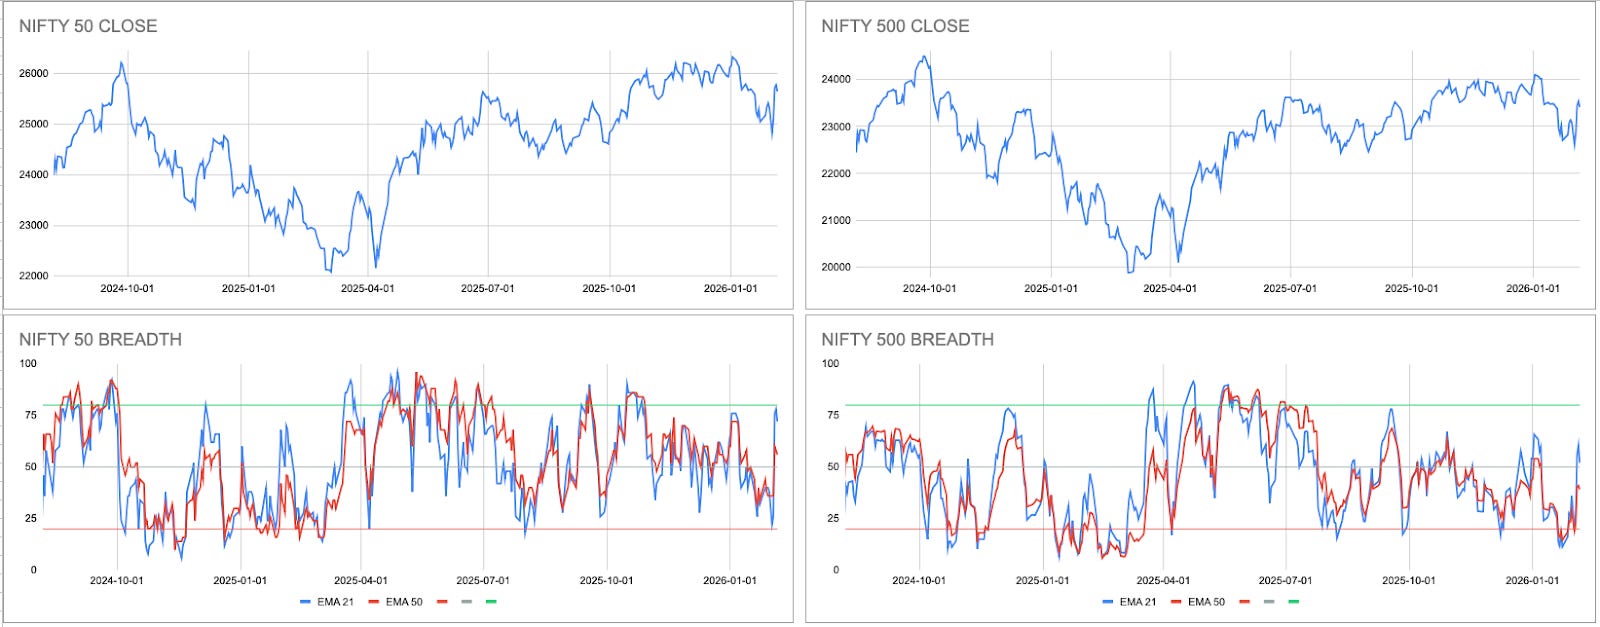
Market Breadth: Flipped Post Gap-Up
Talking about Market Breadth, it seems to have flipped after the massive gap on the 3rd of Feb. 72% stocks in Nifty50 and 52% stocks in Nifty500 are above their 21-day EMA. The broader market continues to be weaker compared to the heavyweights.
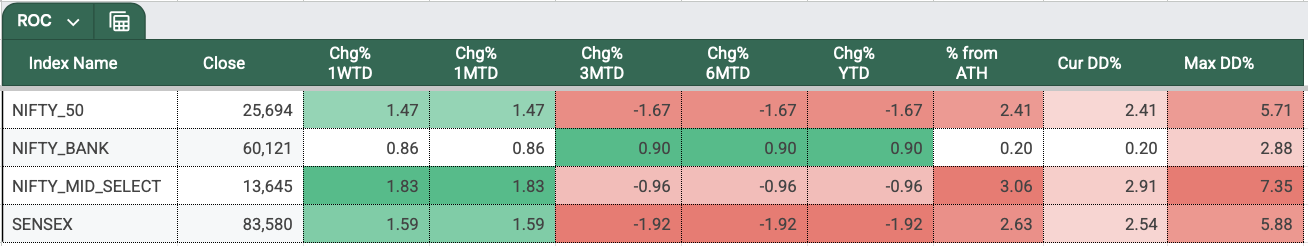
Rate of Change: Only BANKNIFTY Positive YTD
In Week 6 of 2026, all four indices closed in the green. Year-to-date, only BANKNIFTY is in positive territory with a gain of 0.90%, while NIFTY, MIDCAP NIFTY, and SENSEX are down 1.67%, 0.96%, and 1.92%, respectively.
Sectoral Performance: Realty Leads
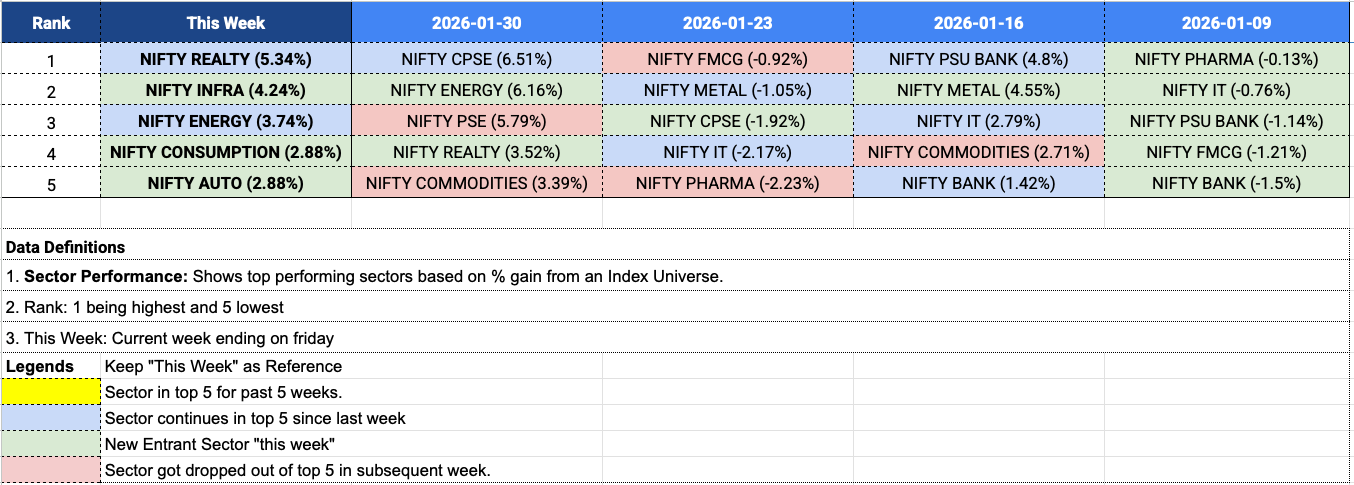
Moving to sector performance for the week, NIFTY Realty topped the charts with a gain of 5.34%, followed by NIFTY Infra up 4.24% and NIFTY Energy higher by 3.74%. NIFTY Consumption and NIFTY Auto rounded off the top five, both gaining 2.88% for the week. Realty and Energy continue to feature consistently in the top-performing sectors—rest three were new entrants this week.
Range Expansion and Rewarding Expiries
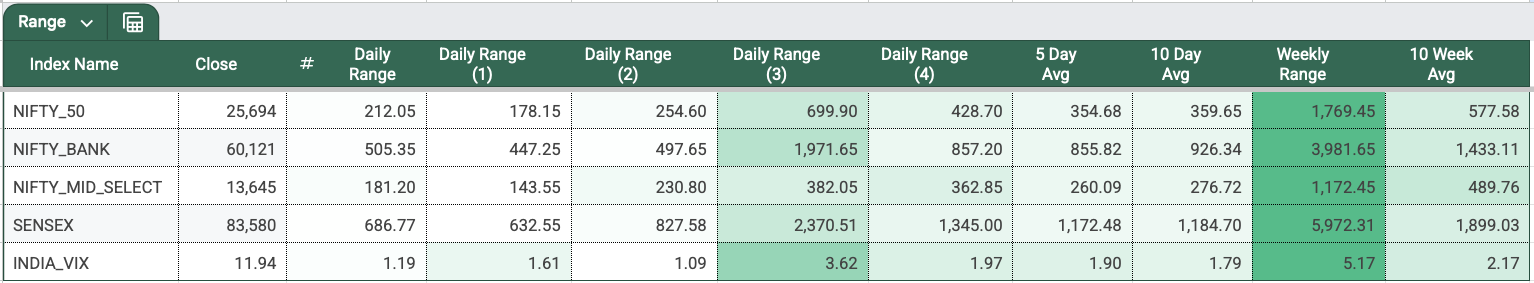
NIFTY’s 5-day daily average range moved up to 355 points. The range did cool off on Thursday and Friday, but it is consistently staying above 200 points. Just like last week, Tuesday recorded the highest daily range across all four indices—NIFTY, BANKNIFTY, MIDCAP NIFTY, and SENSEX.
Just have a look at the weekly ranges: 1,769 for NIFTY, 3,982 for BANKNIFTY, 1,172 for MIDCAP NIFTY, and 5,972 for SENSEX. Yes, this is a weekly range and not monthly. That’s how the week was.
NIFTY’s Tuesday Weekly Expiry
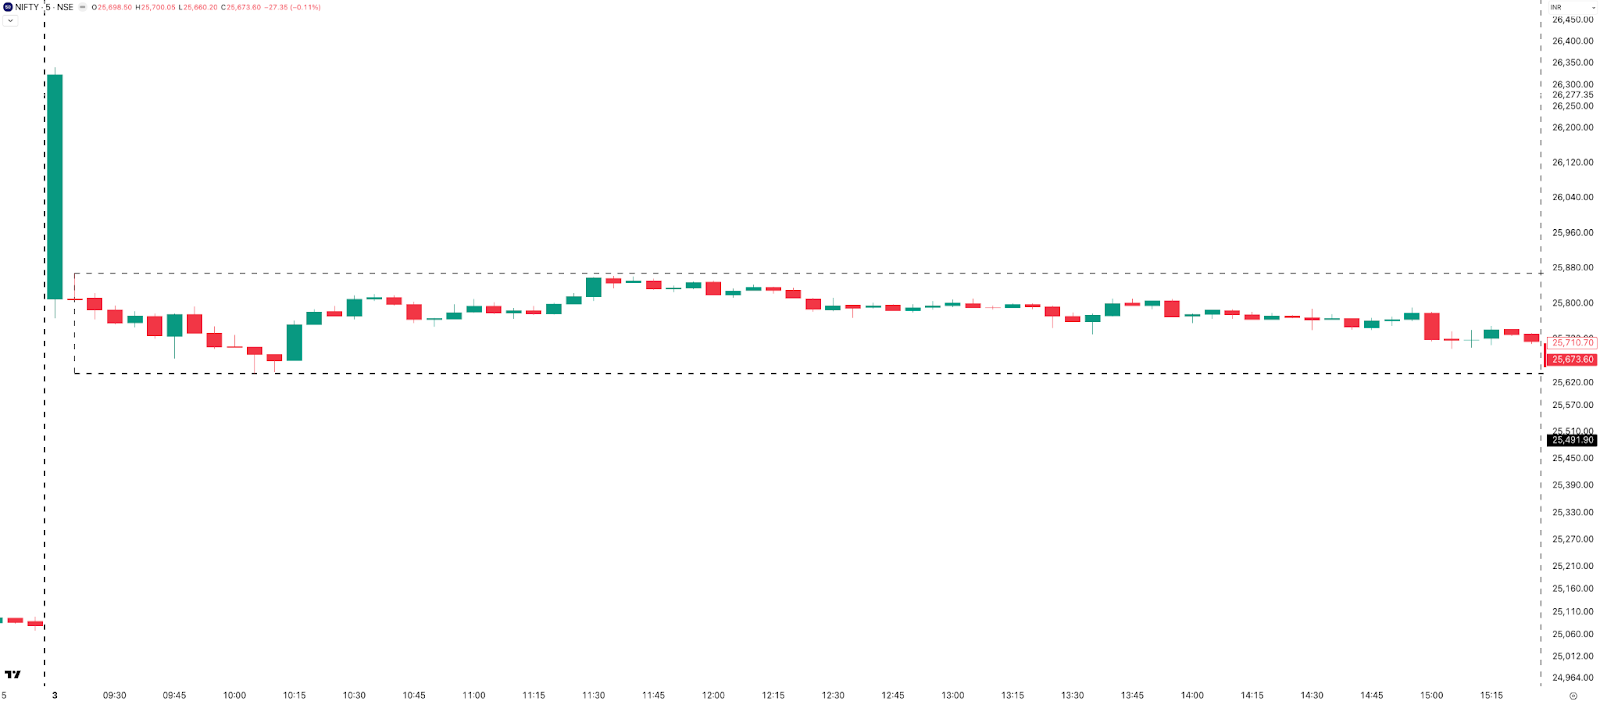
Let’s talk about NIFTY’s Tuesday weekly expiry. With a gap opening of almost 5%, or 1,250 points, and taking naked far OTM CE sellers to the cleaners, NIFTY expiry turned out to be one of the most rewarding in recent times. It’s after these massive moves that the opportunities presented are equally massive.
After the first five minutes, the index remained within a 227-point, or 0.9%, range, with the straddle premium at 312 points around 9:20 AM. The OTMs offered some of the best premiums, but the real question was whether traders had the courage to short them after such a mega gap-up. In hindsight, it may look like the best trade, but not everyone went in with full size. With inflated premiums, the risk widens significantly.
Overall, it was a very rewarding expiry for intraday sellers.
SENSEX’s Weekly Expiry on Thursday
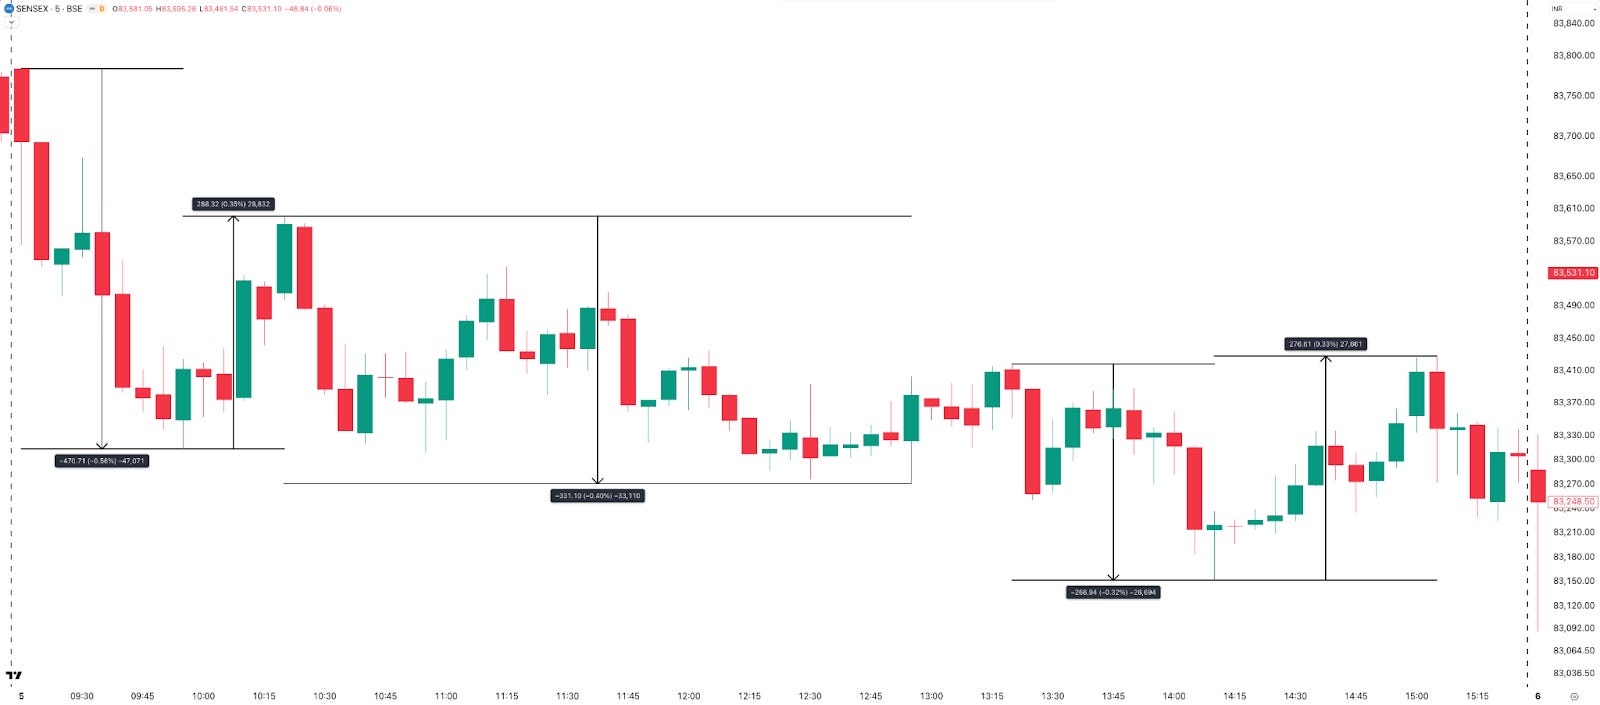
Moving to SENSEX’s weekly expiry on Thursday. Apart from the first-hour hiccup, the SENSEX expiry was easier compared to the last few expiries. The index first went down 470 points and then moved up 288 points in the first hour. From there on, it turned into a good down-trending day, with the index gaining 276 points in the last hour.
The premiums were decent, and it was a good expiry overall. Both expiries this week were good.
INDIAVIX: Post-Budget Cooldown
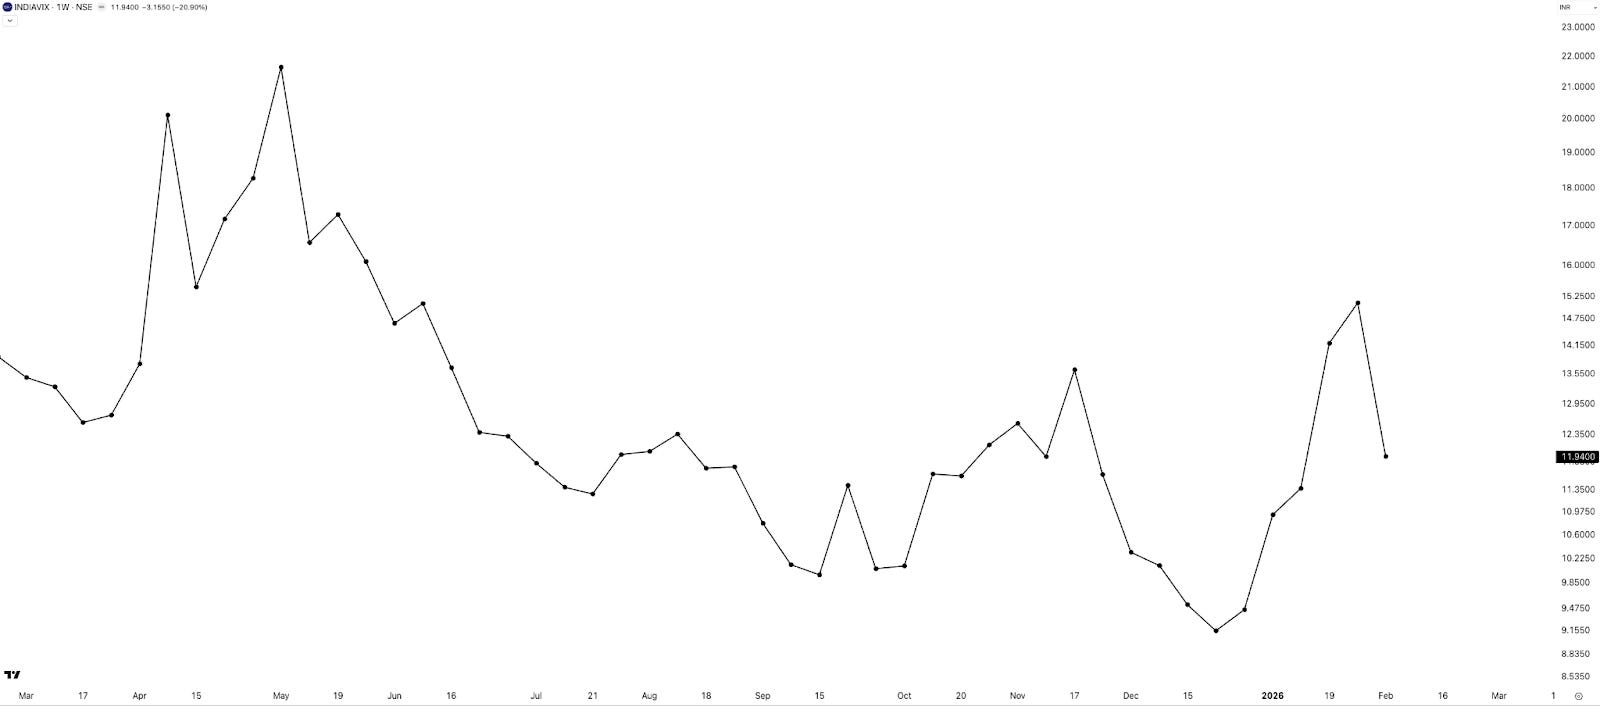
Moving to the India VIX for the week, it cooled off post-Budget, as expected. For the week, it was down 21% to close at 11.94. Even the gap-up on Tuesday did not push the VIX higher.
Commodities: Silver’s Wild Ride Continues
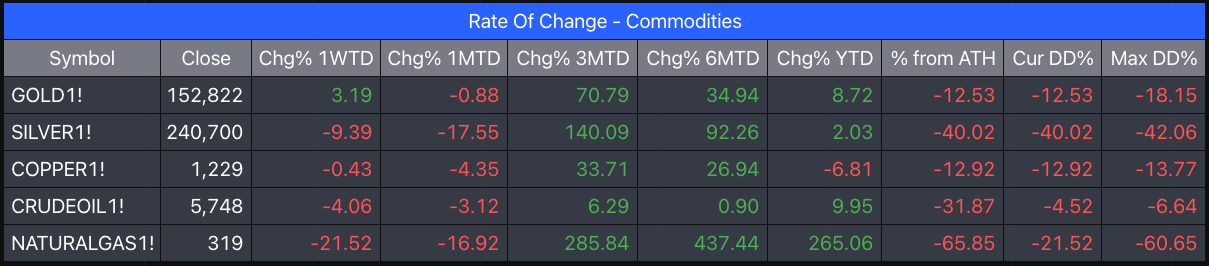
(Data: MCX Continuous Futures - Back Adjusted)
What a week for commodities yet again. Silver lost 9.4% this week, while gold gained 3%. Both are still about 40% and 12.5% away from their all-time highs, respectively.
The volatility in both these counters is through the roof. Silver is making 10–15% ranges almost every single day and remains massively volatile. Not sure how viable it is to trade it right now.
Copper, crude oil, and natural gas also ended the week in the red, with natural gas down 21.5% and crude oil lower by 4%.
In Summary
This was a high-volatility, event-driven week with expanded ranges across all indices due to the Budget and the US–India trade deal announcement.
NIFTY and SENSEX ended the week higher, but both formed wide-range candles with long wicks, highlighting sharp two-way moves and indecision. BANKNIFTY outperformed relatively and closed at an all-time high on a weekly basis, though it failed to hold higher levels post the gap-up.
Daily and hourly price action across indices remained difficult to read, making it a challenging week for short-term trend followers. Ranges stayed elevated, while expiry sessions were volatile but rewarding for intraday option sellers.
INDIAVIX cooled off sharply post-Budget, despite the large price moves, indicating volatility compression at higher levels.
Overall, the week was defined by big gaps, wide ranges, and fast reversals—a reminder that risk management mattered more than direction.
What Caught Our Attention This Week
We have three articles for you this week.
- First is a Bloomberg/HT article titled “The BTS action that led to India-US trade deal”—some interesting background stuff in there about how the trade deal happened:
- Next , there is this news article about Blackstone getting an RBI approval for a 9.99% stake in Federal Bank. The article notes: “Blackstone’s move also follows reports that the Centre is weighing a proposal to permit foreign investors to hold up to 49 per cent in state-run banks. At present, foreign ownership in public sector banks is limited to 20 per cent, compared with 74 per cent in private banks and 100 per cent foreign direct investment in domestic insurers.” That’s good news actually, and may be the reason for resilience in the banking indexes? I don’t know.
- Lastly , a timely article about Winning and Losing by Ian Cassel, someone we follow keenly. In the article, he talks about three investor archetypes—The Rabbit, The Assassin, and the Hunter. At the moment, while we would like to be Assassins, the markets are literally assassinating us.
What to Expect in the Coming Week
Next week is a five-day trading week, and there are no events lined up during the week. Talking about the markets, it looks like both equities and commodities will consolidate for a while before picking up direction again. So long as one can survive this period, you are good.
And with that, we wrap up this week’s Weekly Market Metrics.
If you find this series useful, don’t forget to subscribe to the channel.
Until then—stay curious, stay steady, and enjoy your weekend.