Hello and welcome to the Weekly Market Metrics! I am Sandeep Rao, and we’re in Week 8 of 2026.
The market looked a bit better this week, but is still struggling to find a clear direction, mostly just churning around. Banks were the bright spot in the sectors, while commodities largely stayed pretty quiet.

Anyways, let’s check the charts and see how the price action played out this week. We’ll also look at what is possible in the coming week.
NIFTY: Still Range-Bound
Weekly Timeframe
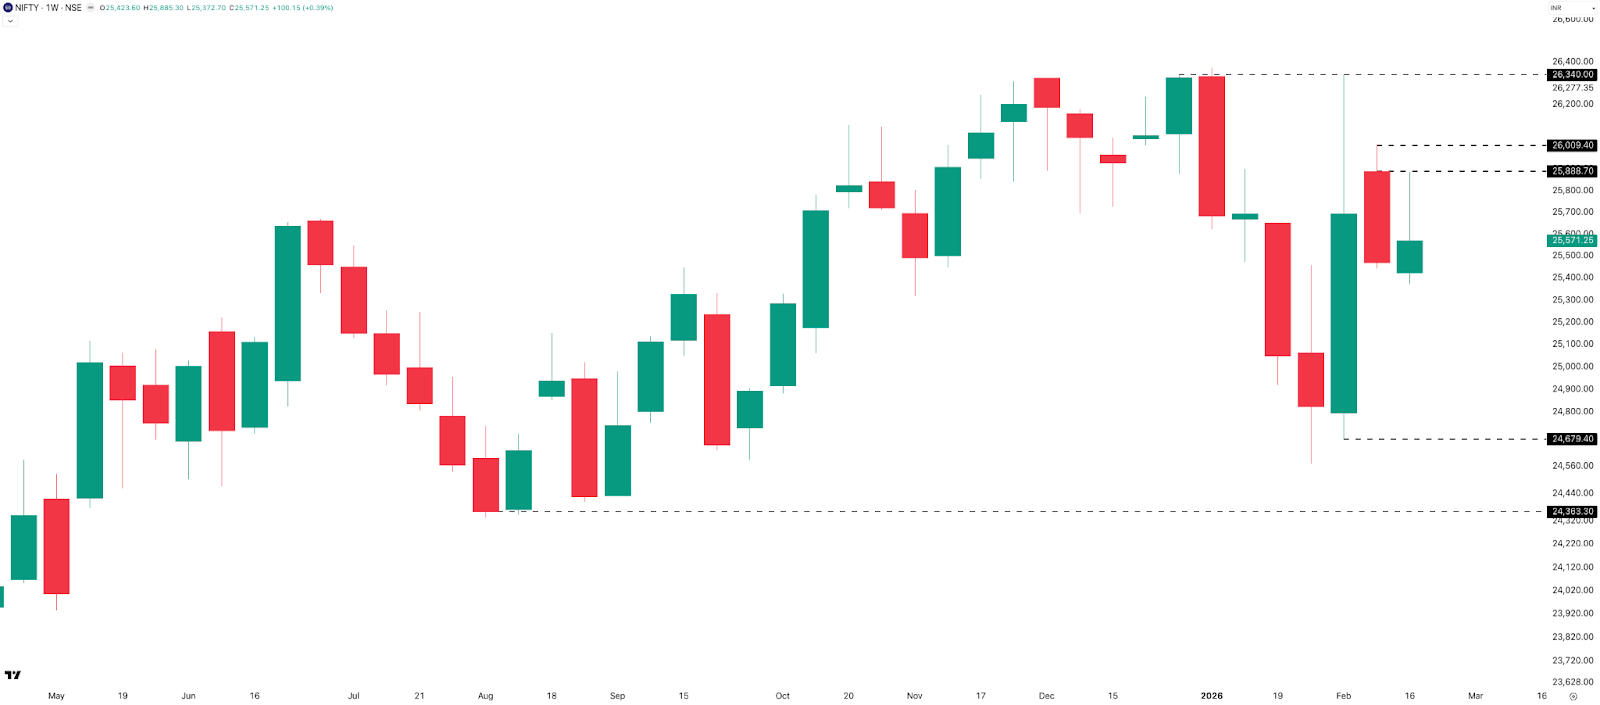
This week, NIFTY did not breach last week’s high near 26,000, but it briefly broke below last week’s low. It closed at 25,571, 127 points above last week’s low. For the week, NIFTY gained 100 points, or 0.39%.
Resistance remains in the 25,900–26,000 zone. Support is unchanged—24,700, followed by 24,400. The bias for next week stays negative to sideways unless we get a decisive weekly close above 26,000.
Daily Timeframe
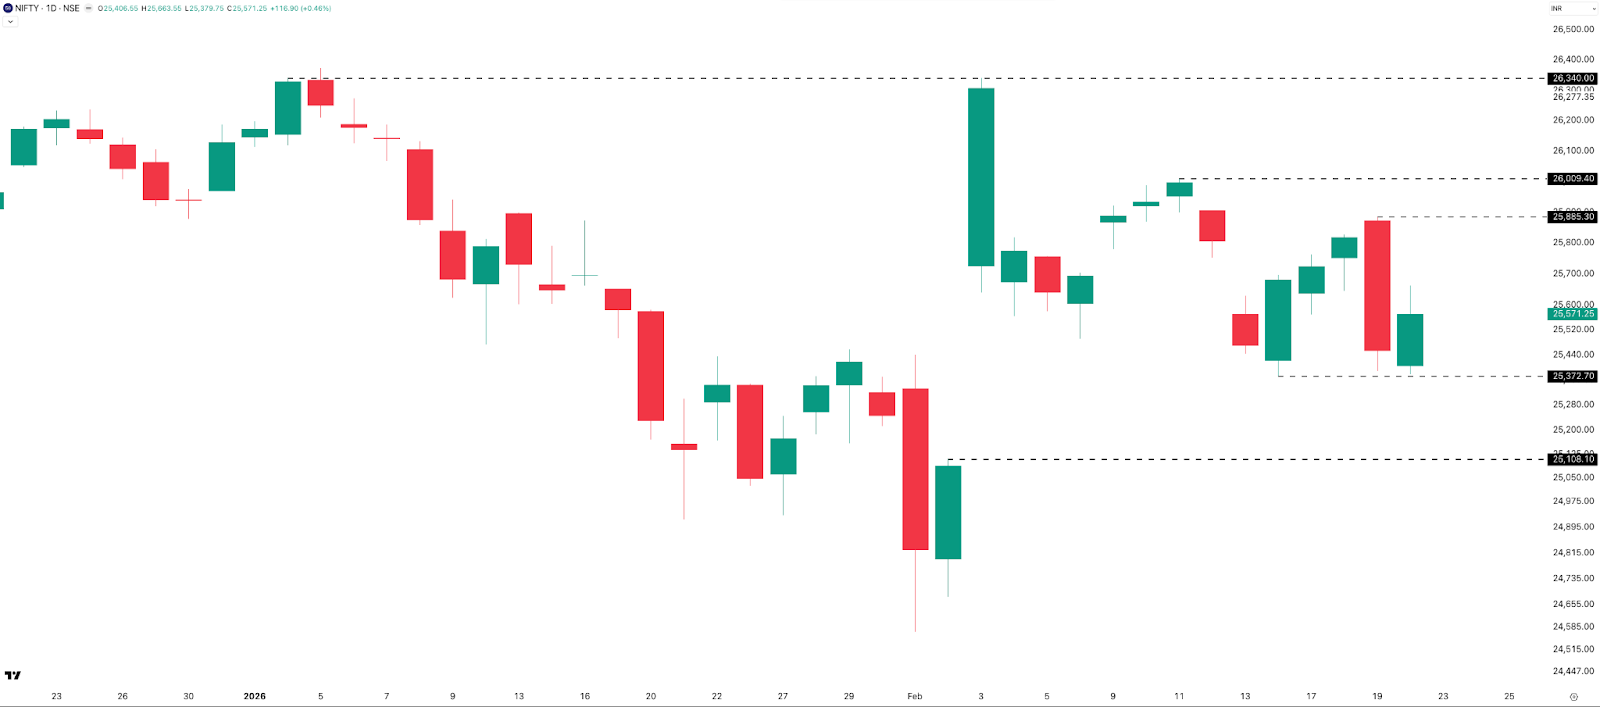
On the daily timeframe, the price action remains extremely choppy. Just like last week, Monday to Wednesday showed an upmove, and then Thursday’s candle wiped out all the gains from those three sessions.
The market going up in steps and coming down in an elevator analogy from last week played out once again. Friday printed a green candle, but Thursday’s high now becomes a key resistance level around 25,900.
For the week, NIFTY registered a 513-point range, which is close to 2%. Supports are placed in the 25,400–25,350 zone, followed by 25,100. Resistance stands at 25,900–26,000, same as the weekly timeframe.
Hourly Timeframe
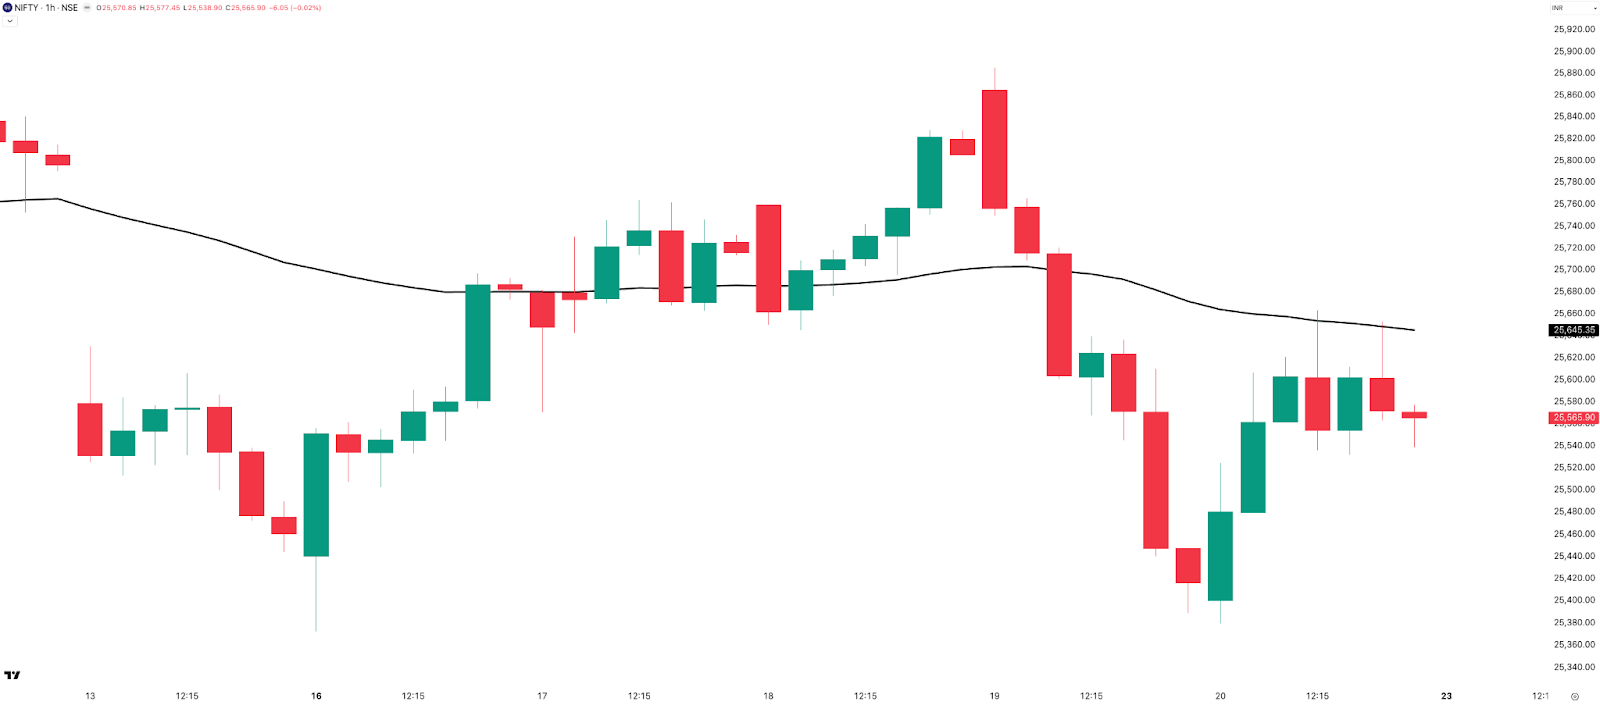
On the one-hour timeframe, NIFTY is currently trading below the 50 EMA. From Monday through Wednesday, the price hovered around the EMA. On Thursday, it broke below it, and on Friday, we saw a pullback toward the EMA—only to get rejected again.
This kind of choppy price action tells you one thing: short-term trend following is taking a hit. There are phases in trend following that make trading extremely difficult, and this is clearly one of them.
Expected Range Till Expiry
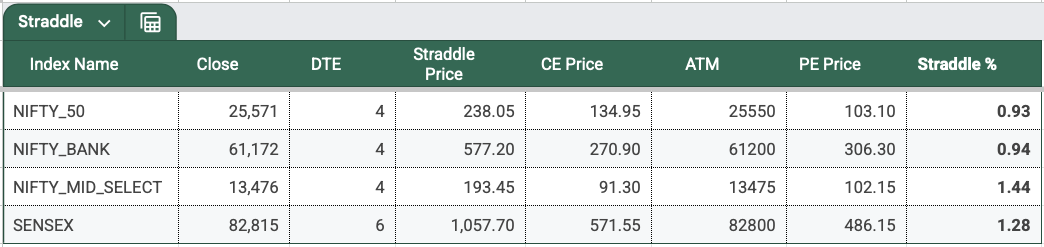
Moving to NIFTY’s range till the upcoming monthly expiry, NIFTY’s 2 DTE ATM straddle premium closed at 238, almost similar to last week. This is now pricing in a 0.93% move on either side.
Based on the current straddle pricing, the expected range till expiry is:
- Upside: 25,809
- Downside: 25,333
Open Interest Analysis
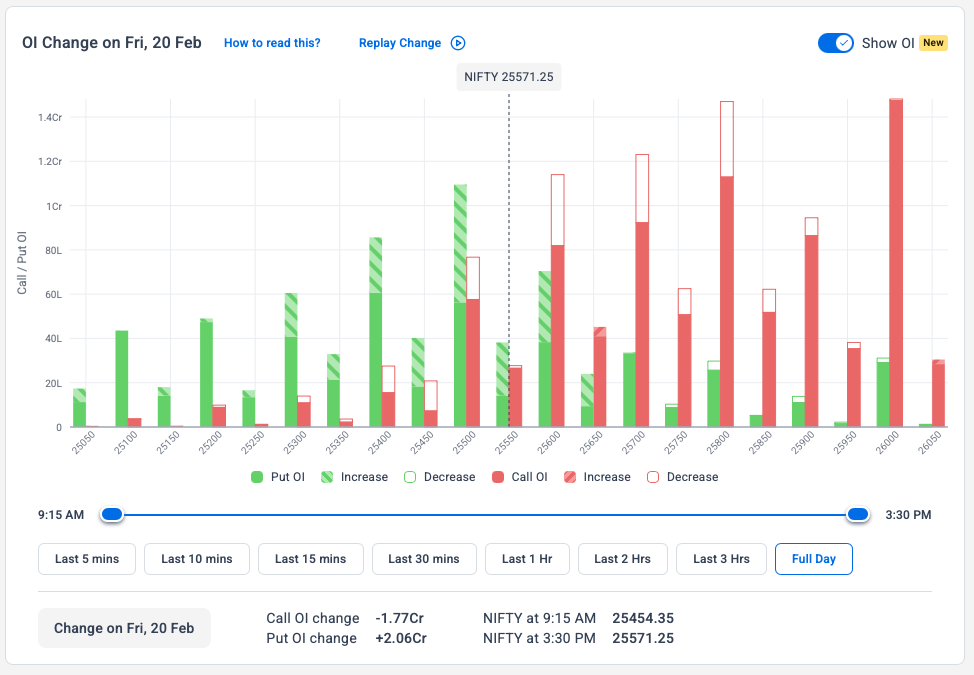
For the upcoming NIFTY monthly expiry on Tuesday, 24th February:
We can clearly see open interest at the 25,800, 25,700, and 25,600 CE strikes being unwound, with most of the unwinding happening in the last hour on Friday. On the Put side, open interest built up at the 25,500 and 25,400 PE strikes.
What does this suggest? Possibly that going into the weekend, the street is positioning for a positive opening on Monday—unwinding Calls and adding Puts. Monday’s opening could be eventful, based on this OI change chart.
SENSEX: Similar Story
Weekly Timeframe
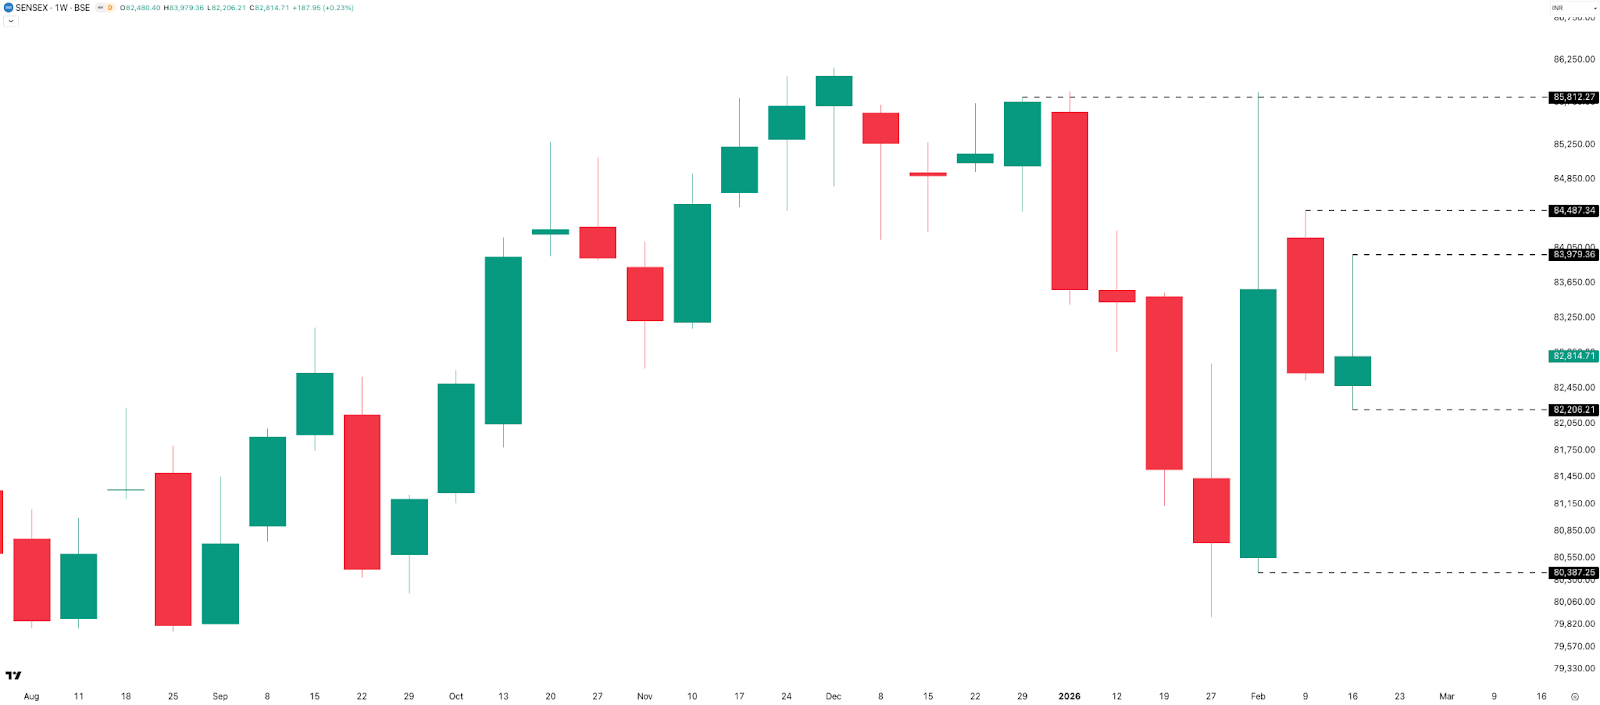
On the weekly timeframe, SENSEX gained 188 points, or 0.23%, to close at 82,815. This week’s candle printed a long upper wick, with a total range of 1,773 points, or 2.16%—almost similar to last week.
Support is placed at 82,200, which is this week’s low, followed by 80,400. On the upside, key resistance stands at 84,000, this week’s high, and then at 84,500.
Daily Timeframe
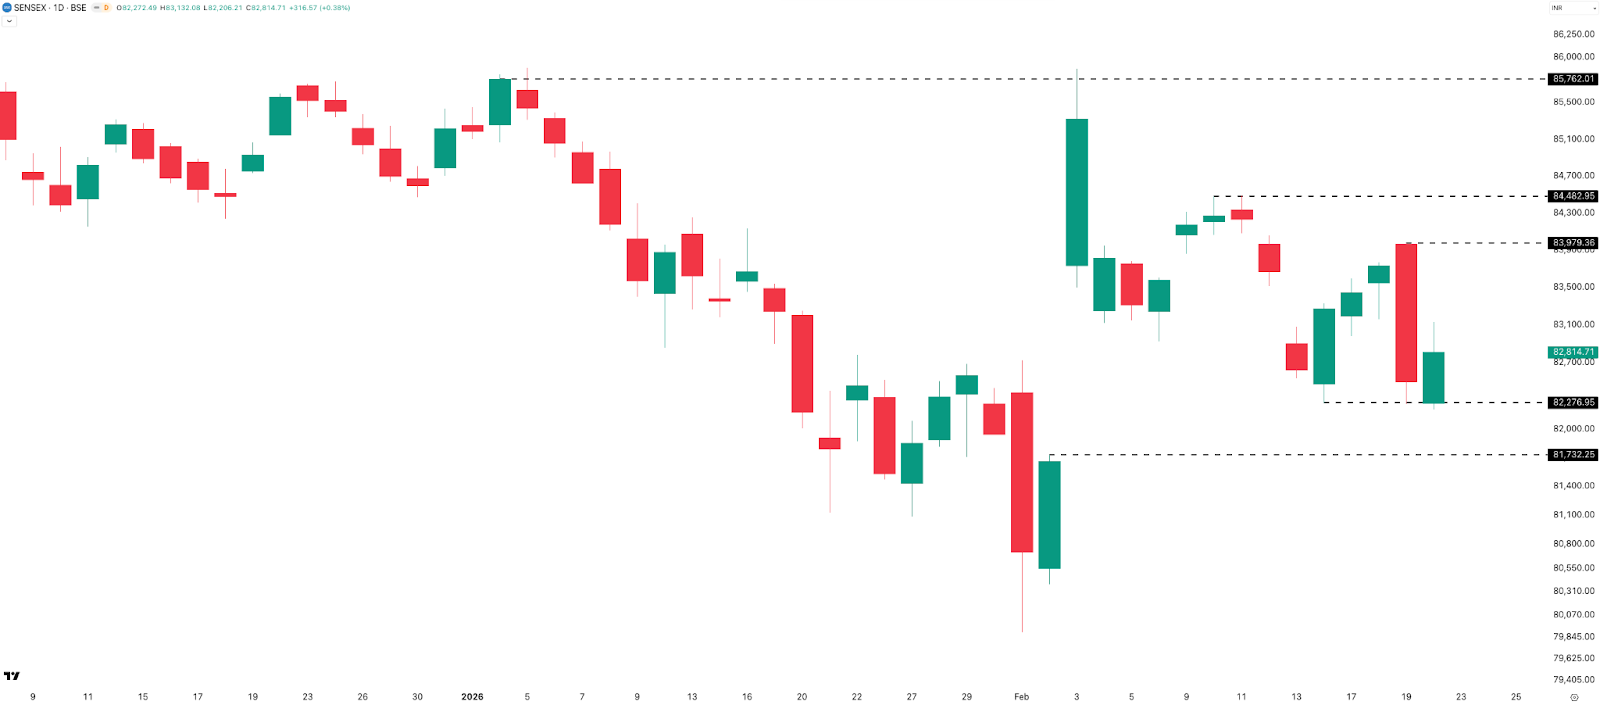
On the daily timeframe, SENSEX printed four green candles and one red candle, but that single red candle nearly wiped out the gains from the four green sessions. Resistance and support levels remain the same as discussed on the weekly chart: 84,000–84,500 on the upside, and 82,300 to 82,200 zone on the downside.
Expected Range Till Expiry

The next SENSEX expiry is on Thursday, 26 February 2026, which is a monthly expiry. The ATM straddle closed at 1,058 points, which implies a 1.28% move on either side. The premium is similar to that of last week. This implies an expiry range of:
- Upside: 83,875
- Downside: 81,750
This broadly places SENSEX in the 83,900 to 81,700 range going into expiry.
BANKNIFTY: Another All-Time High Weekly Close
Weekly Timeframe
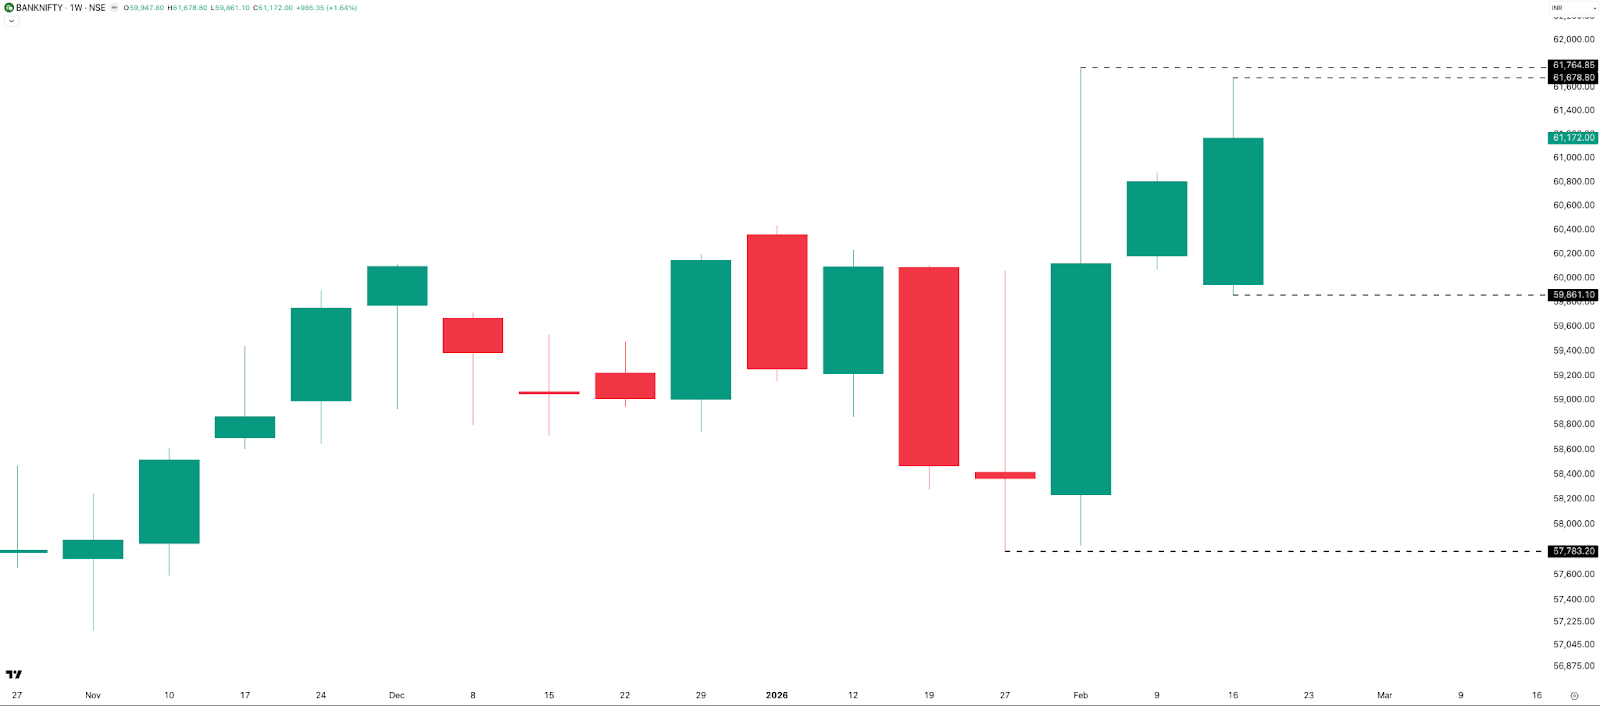
On the weekly timeframe, BANKNIFTY delivered another all-time high weekly close at 61,172, gaining 985 points, or 1.64%, for the week. During the week, it touched 61,679—just 86 points shy of its all-time high, but broad-based selling on Thursday dragged the index lower.
The weekly range stood at 1,818 points, close to 3%. Resistance is now placed at 61,679, this week’s high, followed by the all-time high at 61,765. On the downside, supports are seen at 59,860 and then at 57,800 on the weekly chart.
Daily Timeframe
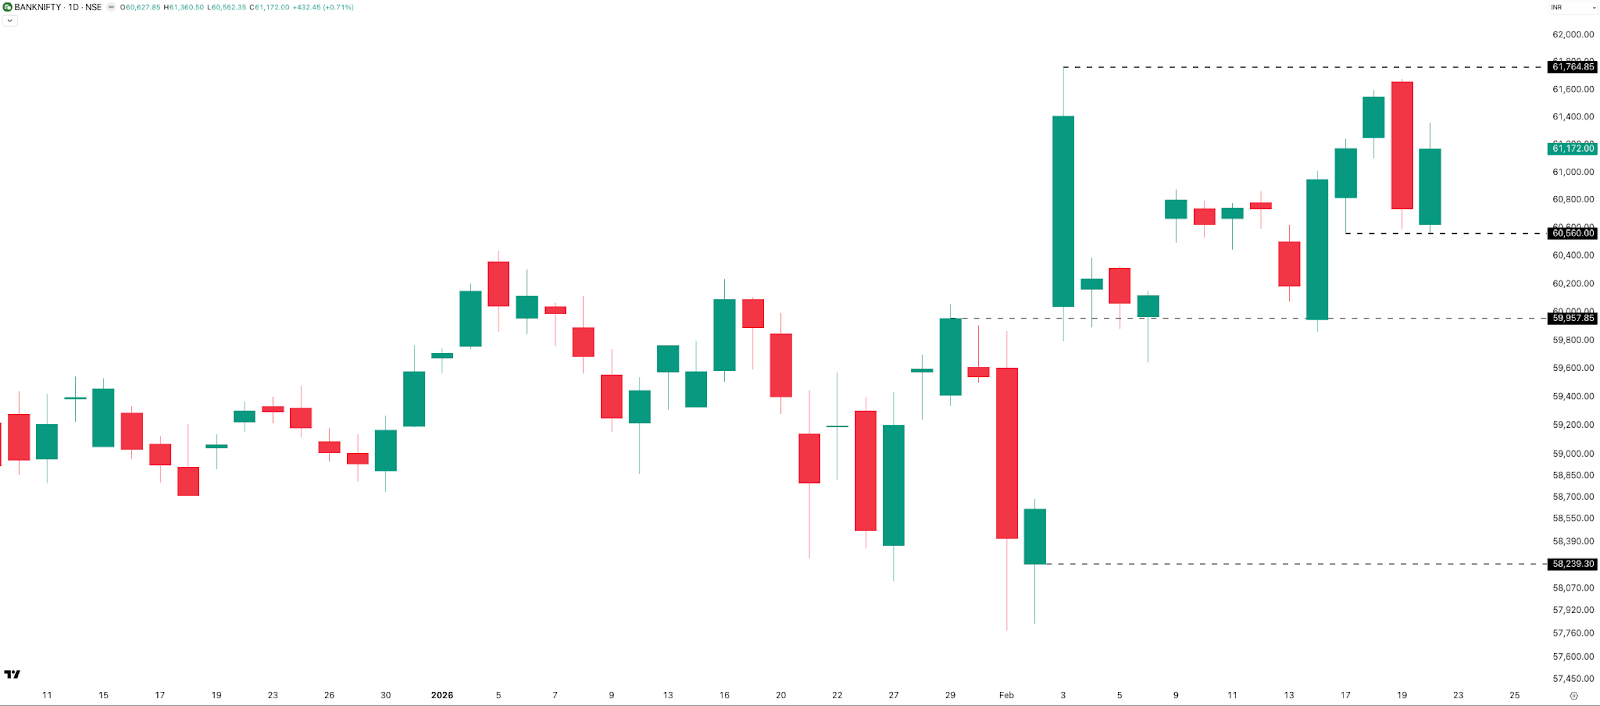
On the daily timeframe, Monday’s green candle was as strong as Thursday’s red candle—both roughly 1.3%. Across timeframes, BANKNIFTY continues to hold firm, with resistance at the all-time high of 61,765 and supports in the 60,500–60,600 zone, followed by the 60,000 level.
Hourly Timeframe
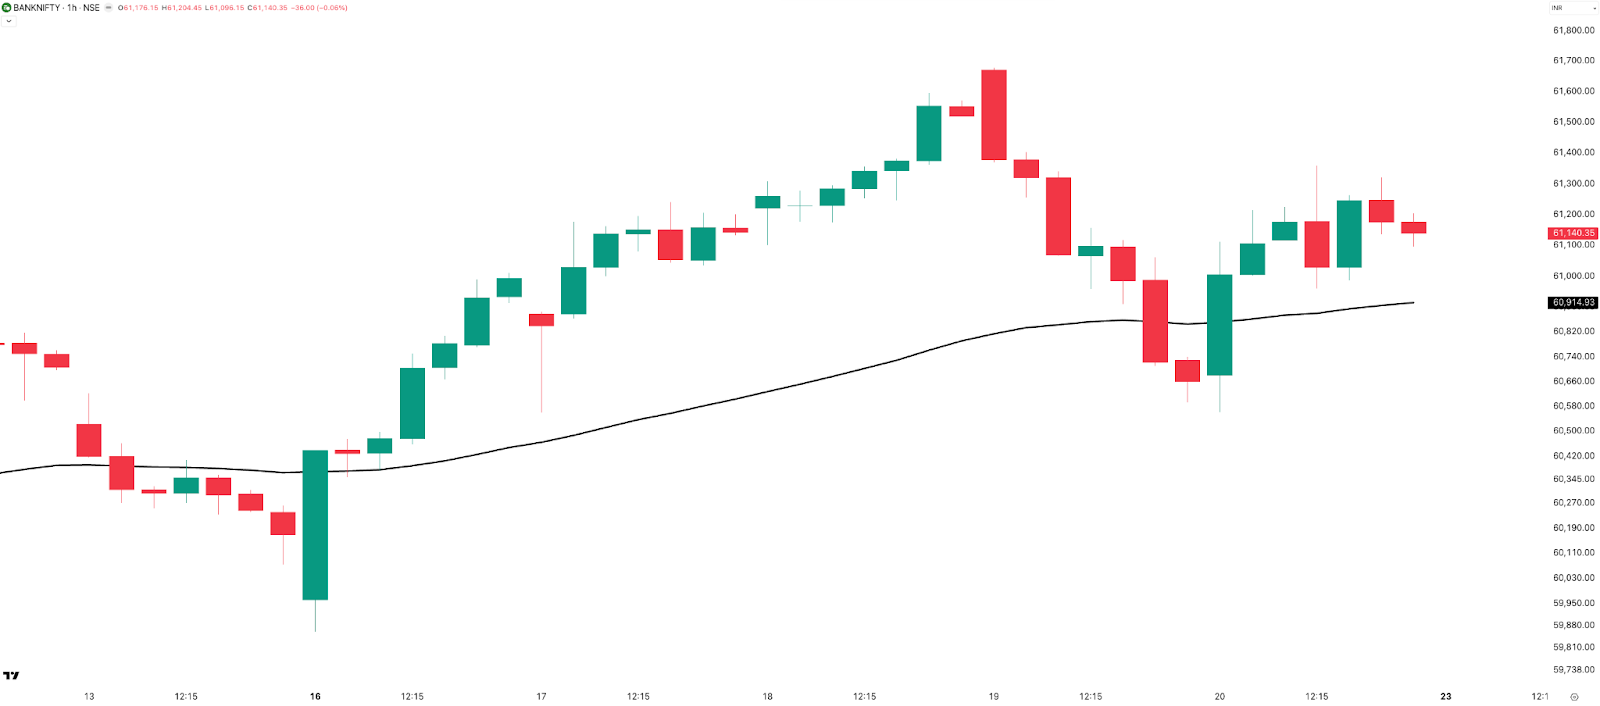
On the hourly timeframe, BANKNIFTY held above the 50 EMA until Wednesday. On Thursday and Friday, it started chopping around the EMA. Similar to NIFTY, short-term trend following in BANKNIFTY has been choppy, even though the index continues to show relative strength compared to NIFTY.
Rate of Change: BANKNIFTY Outperforms
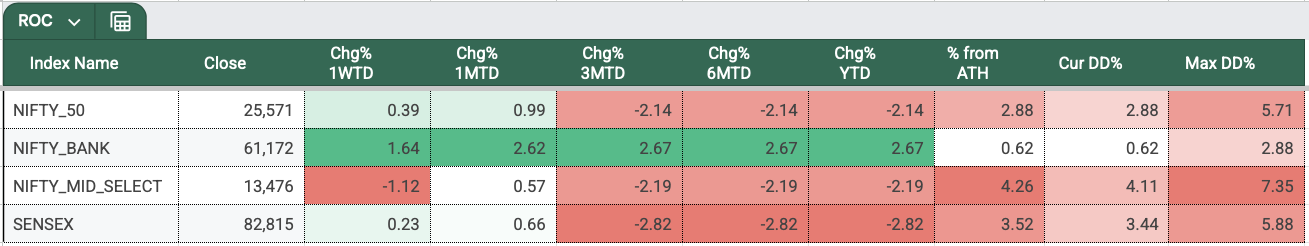
In Week 8 of 2026, NIFTY saw a muted move, up just 0.39%. SENSEX gained 0.23%. BANKNIFTY outperformed, rising 1.64%, while MIDCPNIFTY declined 1.12%.
Year to date, all indices are in the red except BANKNIFTY, which is just 0.62% away from its all-time high. Nearly two months into 2026, Indian indices still haven’t found a strong trigger to move higher. In fact, positive news continues to get sold into, and NIFTY has been stuck in a range for months now.
Sectoral Performance: Banking Leads Again
All of last calendar year and this year again, we’ve been seeing strength across the banking sector. I am sure investors are seeing some tailwinds. I remember an article that spoke about why Goldman Sachs is bullish about banking in India.
There is also a video by Markets by Zerodha on PSU banks.

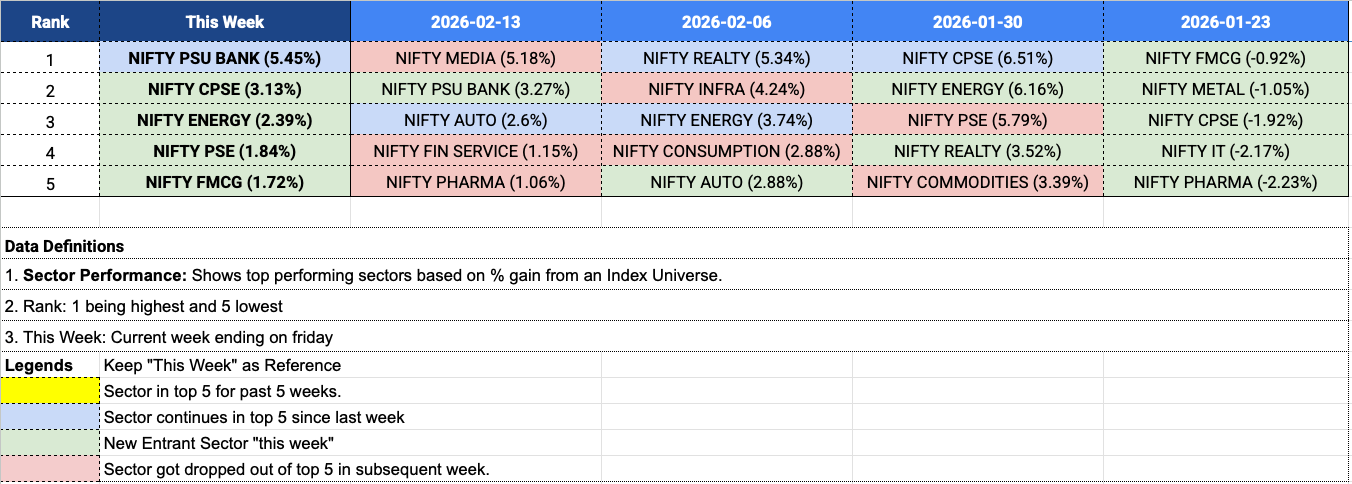
So yes, PSU Bank tops this week at 5.45%, continuing from 3.13% last week. The rest of the sectors that are in the top 5 this week are new entrants. CPSE comes back in the list after a pause of two weeks. Energy is up 2.39% this week after a week’s pause. PSE is also back this week at 1.84% after a two-week pause, and trailing it is FMCG at 1.72%, again in the list after three weeks.
Will it be another year of Banking leading the sectors? Let’s see—worth keeping an eye on.
Range Expansion and Expiry Review
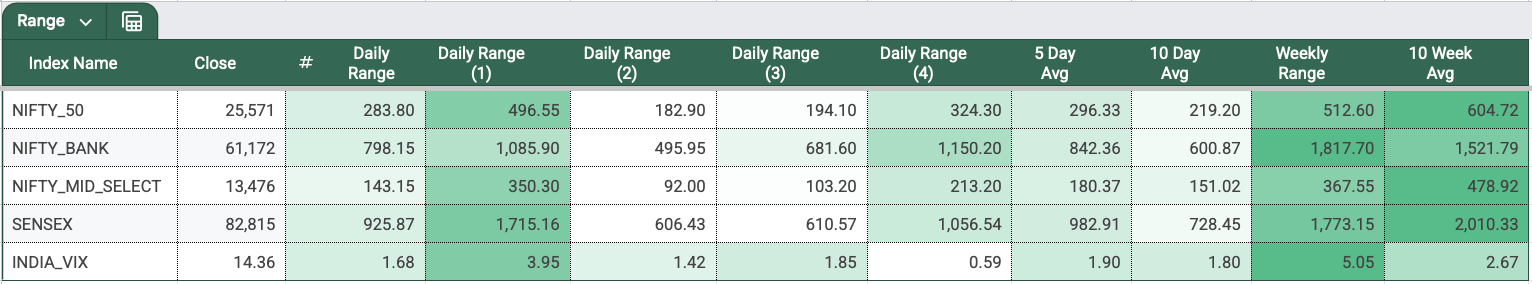
NIFTY’s 5-day average daily range has expanded to around 296 points, up sharply from 150 points last week. The spike was largely driven by Thursday’s near 500-point range. Even if we exclude Thursday, NIFTY is back to clocking 200-plus point ranges a day.
Last week’s large Friday range repeated itself this week on Thursday. In fact, all major indices recorded their highest range on Thursday.
NIFTY’s Weekly Expiry on 17-Feb
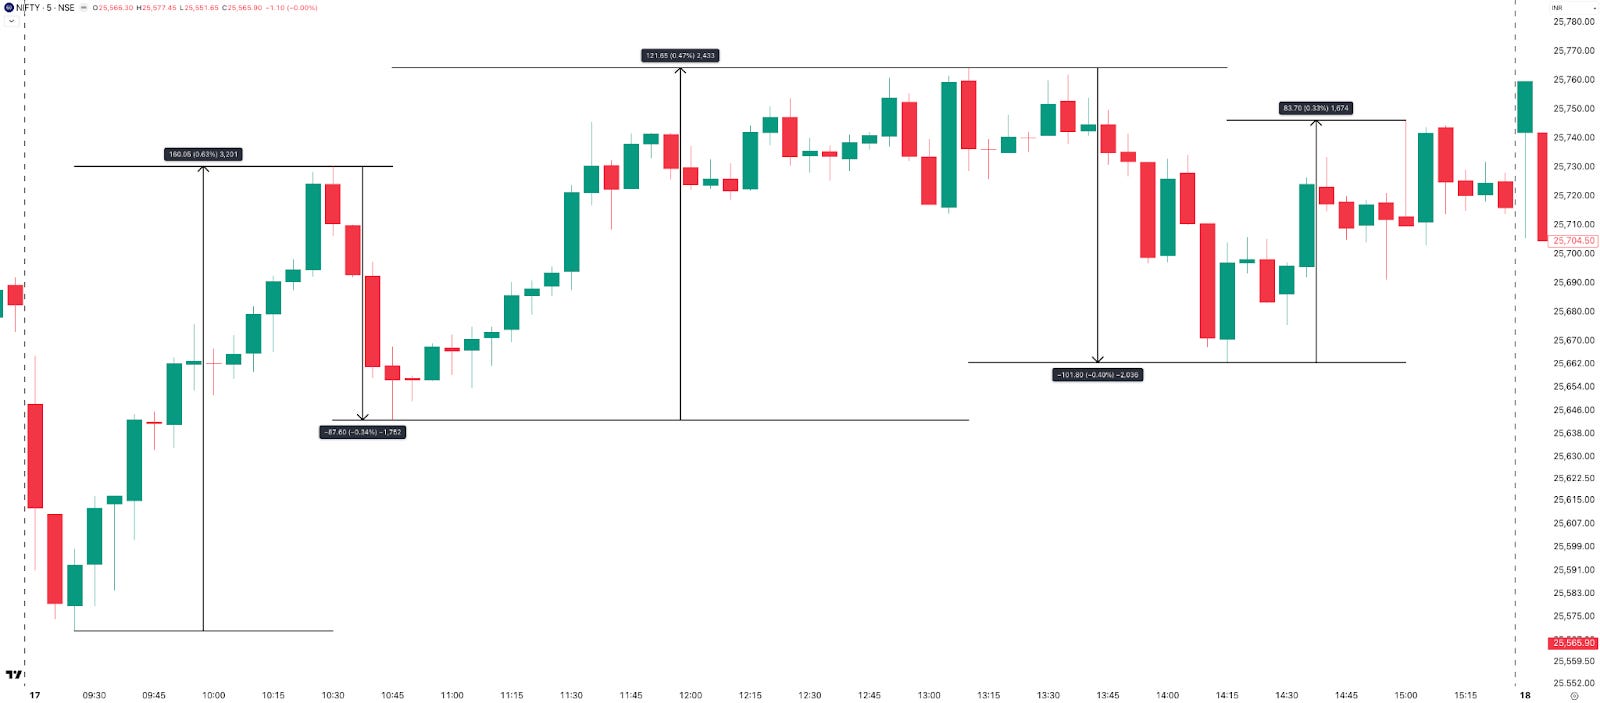
Let’s talk about NIFTY’s weekly expiry on 17-Feb, Tuesday. After a gap-down opening, the index swung wildly—+160, -88, +122, -101, and +83 points—before closing just 42 points higher, up 0.17% from the previous day.
Following a volatile first hour, the expiry became manageable. The opening straddle premium was 107, dipped to 95 within the first hour, and then spiked back to 107 around 10:30 AM. By around 2 PM, ATM Straddle premiums were in the 55 range, even though the realized move was much larger.
Overall, it was a relatively easier expiry—provided one did not deploy the entire size early and spread positions across the day.
SENSEX Weekly Expiry on 19-Feb
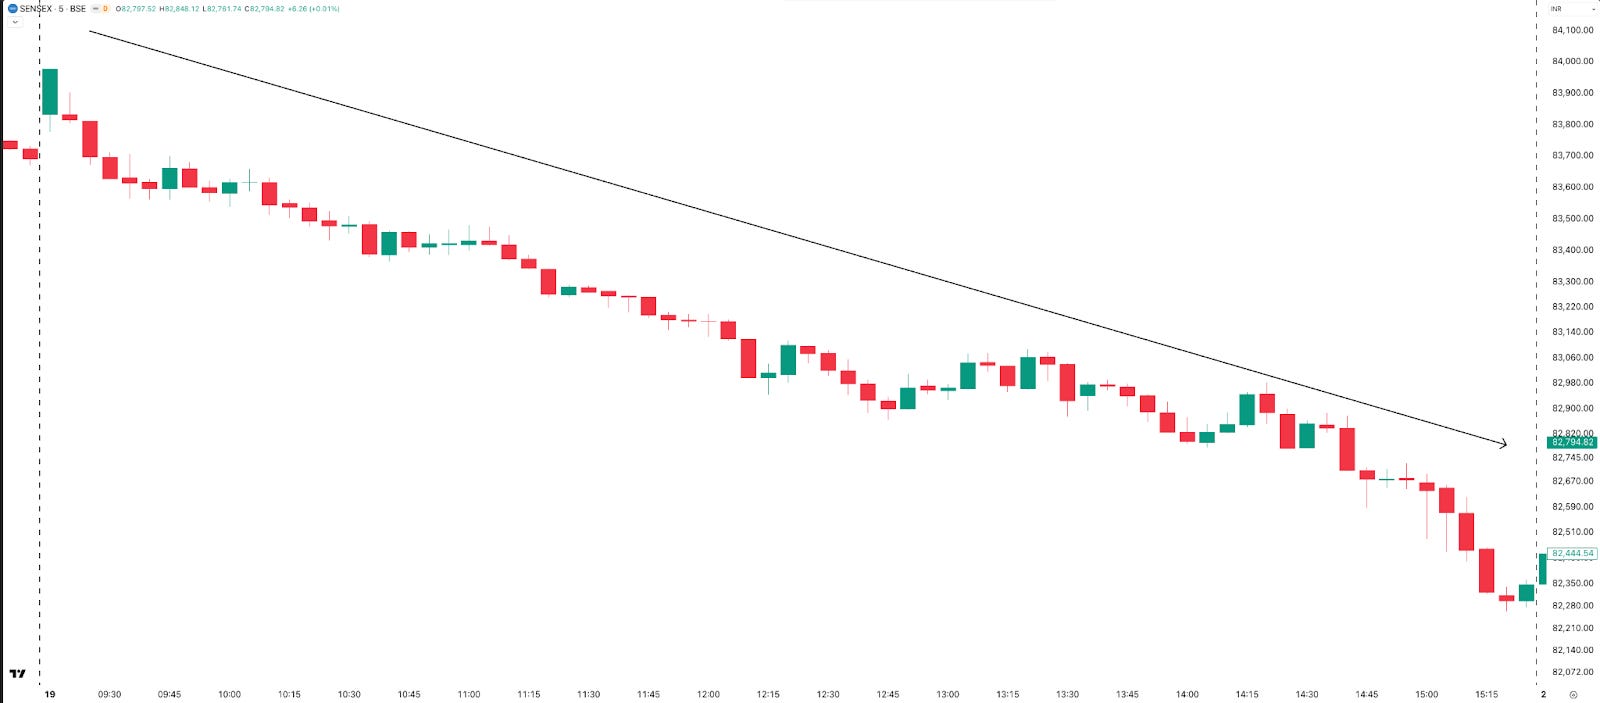
Moving to SENSEX weekly expiry on 19-Feb, Thursday. It was a clean downtrending day, with the index falling 1,236 points, or 1.48%. The ATM straddle opened at 280, implying an expected move of 280 points. The realized move, however, was almost 10 times that expectation.
Fixed stop-loss time-based straddle sellers likely had a stellar day, while combined premium stop-loss traders would have struggled in such a strong trend. Overall, it was a decent expiry for sellers—and surely one where option buyers had plenty to celebrate as well.
INDIAVIX: Rising Again
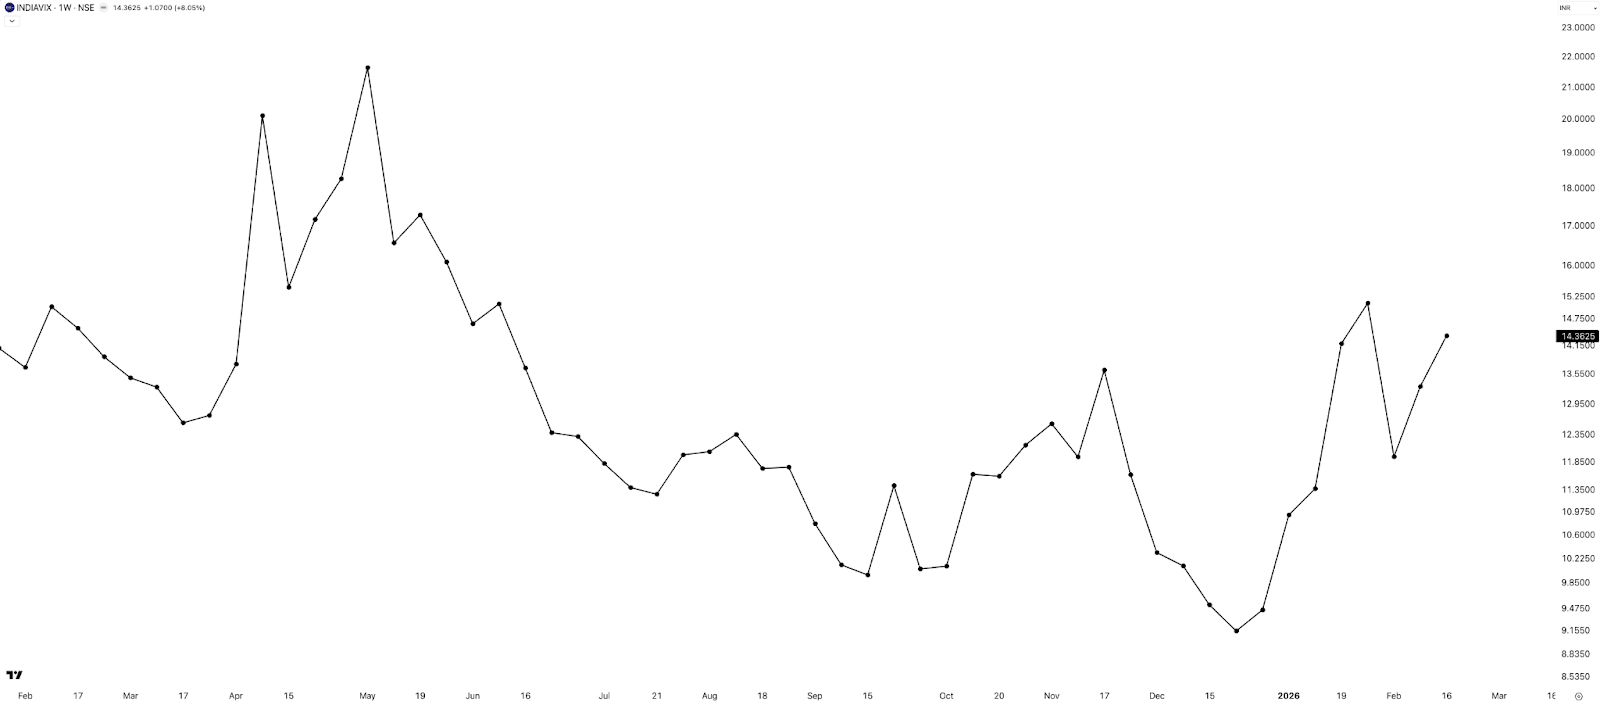
Moving to INDIAVIX for the week: For the second week in a row, it spiked. This week, it was up 8%, closing at 14.36.
My guess is that US–Iran tensions and the upcoming weekend led to the rise in volatility. However, more Puts were written than Calls as seen in the NIFTY Open Interest chart, implying the market is positioning for an upmove.
Two contradictory views—and that’s exactly how markets are made: on opposing expectations.
Commodities: Calm Returns
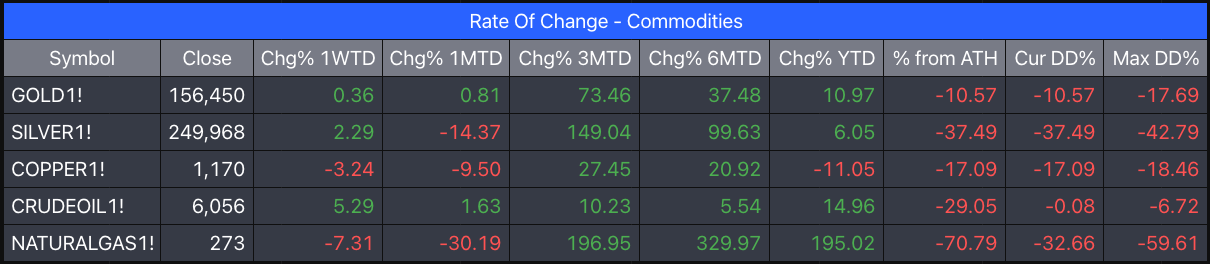
There seems to be a calm in commodities after those mad moves in December and January.
While precious metals were slightly in green this week—Gold about 0.36% and Silver at 2.29%—Copper corrected close to -3.24%. In energy, Crude oil’s up 5.29% and Natural Gas down -7.31% this week. Talking about Natural Gas, since the beginning of the month, it’s been down 30%, which also coincides with its near-term high—perhaps seasonality playing out.
Do note, compared to Nifty50, which is down close to 2% for the year, Gold is still up 11%. Will Gold continue to rally this year as well? Let us know what you think in the comments.
In Summary
Week 8 was muted at the index level but volatile underneath. NIFTY gained 0.39%, and SENSEX rose 0.23%, both continuing to move in a sideways range. BANKNIFTY outperformed with a 1.64% gain and closed at another all-time high weekly close, showing clear relative strength.
Price action remained choppy across timeframes, making short-term trend following difficult. Thursday was the highest range day across indices, and implied volatility rose for the second straight week.
Sectorally, PSU Banks led the gains, while commodities were relatively calm. Overall, the broader structure remains sideways to weak, with strength concentrated in Banking.
What Caught Our Attention This Week
We have two interesting reads for you.
- First is a rather somber letter to his partners: Swiss Fund Manager Guy Spier announced the closure of his fund due to health issues. It also discusses his investing philosophy—and we wish him luck in this new phase of his life.
- Next is something off markets—a very well-written dispatch from Afghanistan by journalists Elian Peltier and Tomas Munita in the New York Times, where they discuss the state of affairs in Afghanistan while traveling along Highway 01, an arterial road that runs from Kandahar to Kabul. There are some great visuals as well in the article.
What to Expect in the Coming Week
Next week is a five-day trading week and the final week of February 2026. Global geopolitical uncertainty continues, and the India–US trade deal is likely to be finalized this month and will be signed in March. Markets may continue to remain sideways and range-bound—expanding ranges during the week, yet ultimately going nowhere.
And with that, we wrap up this week’s Weekly Market Metrics.
If you find this series useful, don’t forget to subscribe to the channel.
Until then—stay curious, stay steady, and enjoy your weekend.