Welcome to another edition of Weekly Market Metrics. I am Sandeep Rao, and we’re wrapping up Week 9 and, with it, two full months of 2026 — time does fly.
On the markets front, the less said the better. We’re close to 5% below all-time highs, and the price action increasingly resembles a sell-the-rise regime, particularly for short-term traders. Precious metals continue to hold up as expected, but there isn’t much else to cheer about. Let’s get into the charts.

NIFTY
Monthly
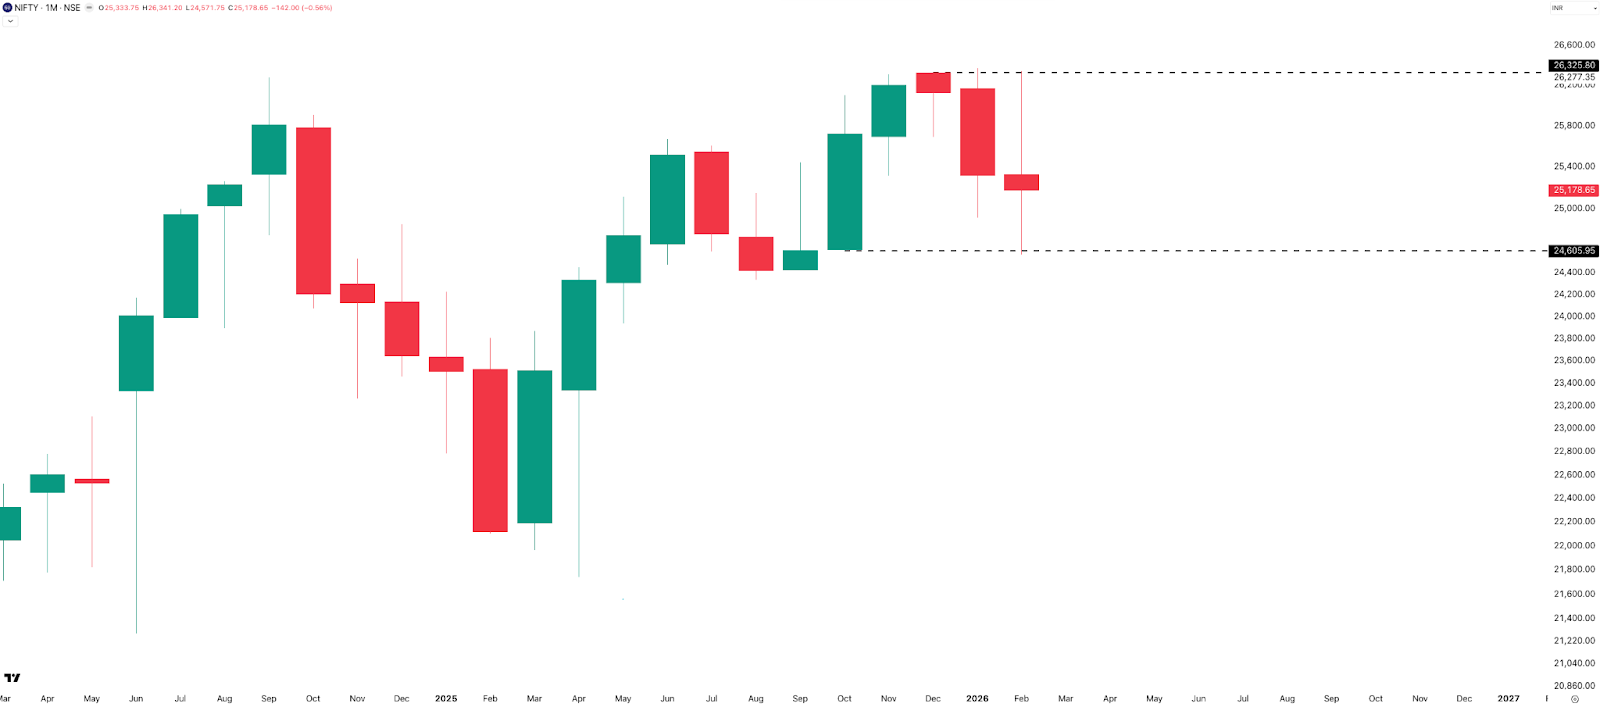
February was quite a month for NIFTY. It tested the October 2025 low on Budget Day (1-Feb) and then almost touched its all-time high following the India–US trade deal news on 3-Feb. The monthly range clocked in at a whopping 6.7%, or 1,770 points — the highest since April 2025 (that tariff-bomb month). Despite all that drama, NIFTY closed down just 0.56%, or 142 points, from January’s close.
As the old Mumbai saying goes: khaya piya kuch nahi, glass phoda barah aana.
The monthly structure remains sideways to bearish. Budget Day low of 24,570 acts as support; ATH of 26,375 is the resistance to watch.
Monthly Seasonality
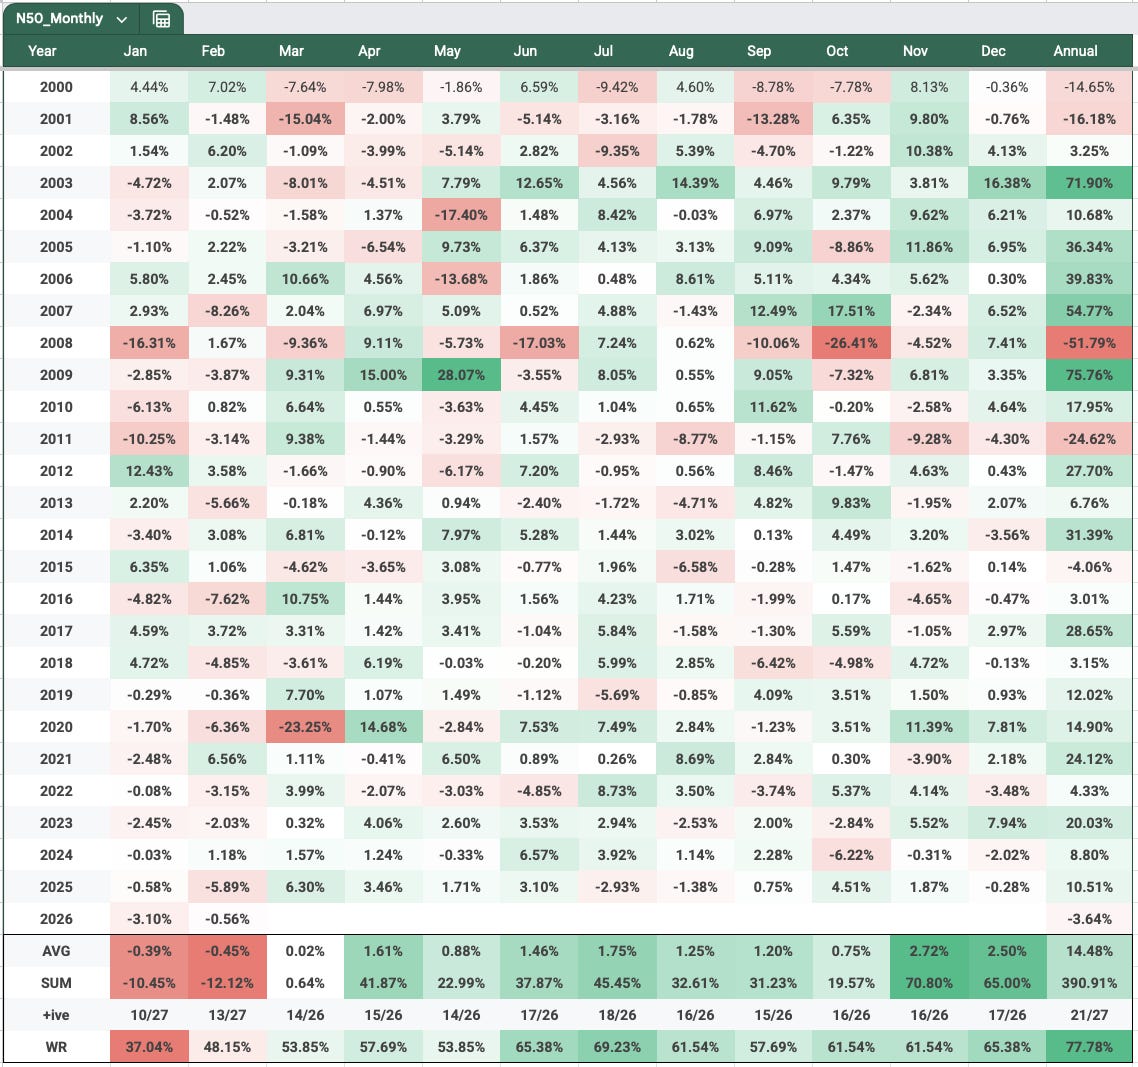
Over to the nifty monthly seasonality chart.
February 2026 closed in the red. Looking ahead, March has historically delivered positive returns every year from 2021 to 2025 — with the obvious exception of March 2020 and its COVID collapse. Year-to-date, NIFTY is still in the red at –3.64% .
Weekly
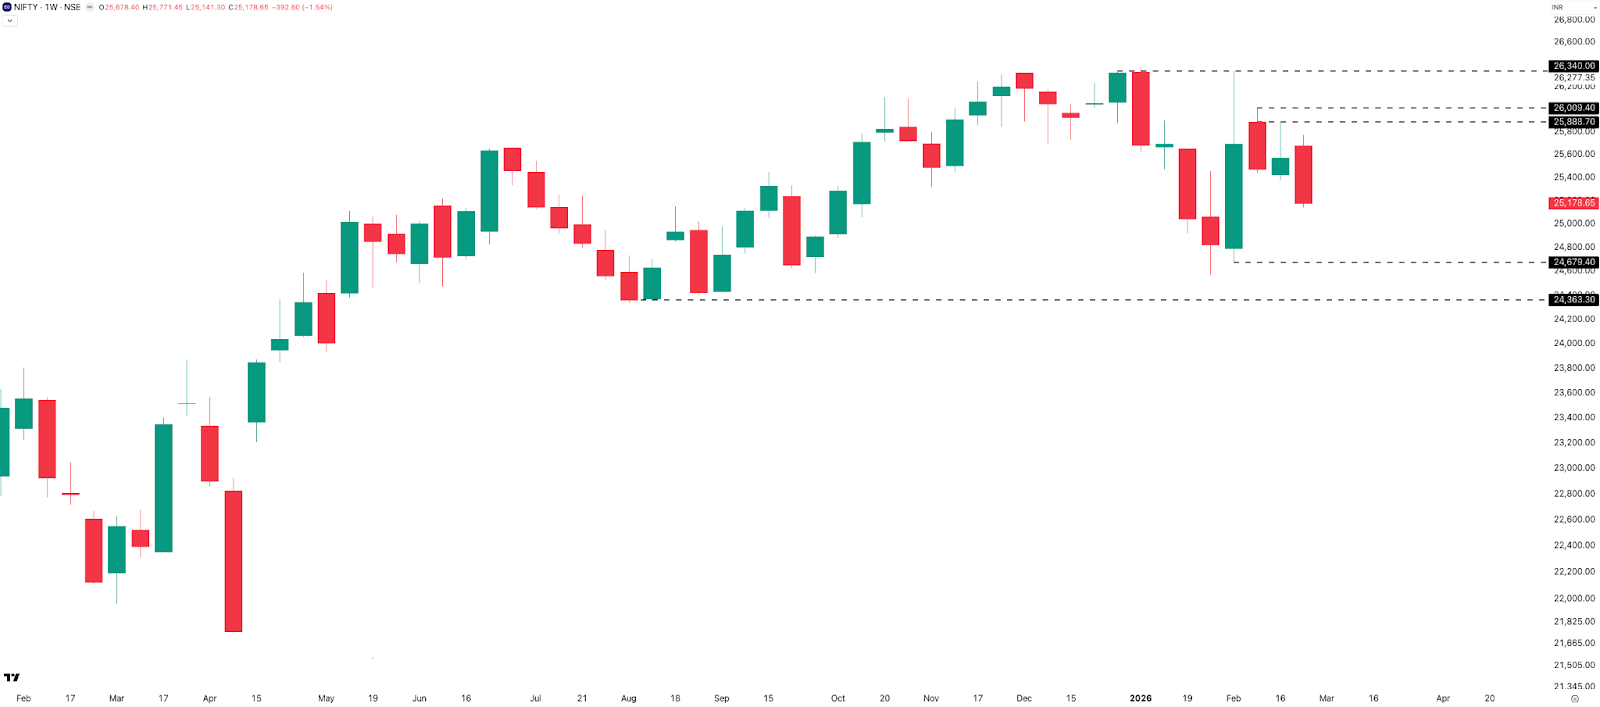
For the second consecutive week, NIFTY failed to breach the prior week’s high and instead broke below the prior week’s low. The index lost 939 points (–1.54%) to close at 25,179 , with the weekly range expanding to 630 points — the widest in three weeks.
Resistance remains in the 25,900–26,000 zone. Support sits at 24,700 , followed by 24,400 . The bias for the coming week stays negative to sideways unless there’s a decisive close above 26,000.
Daily
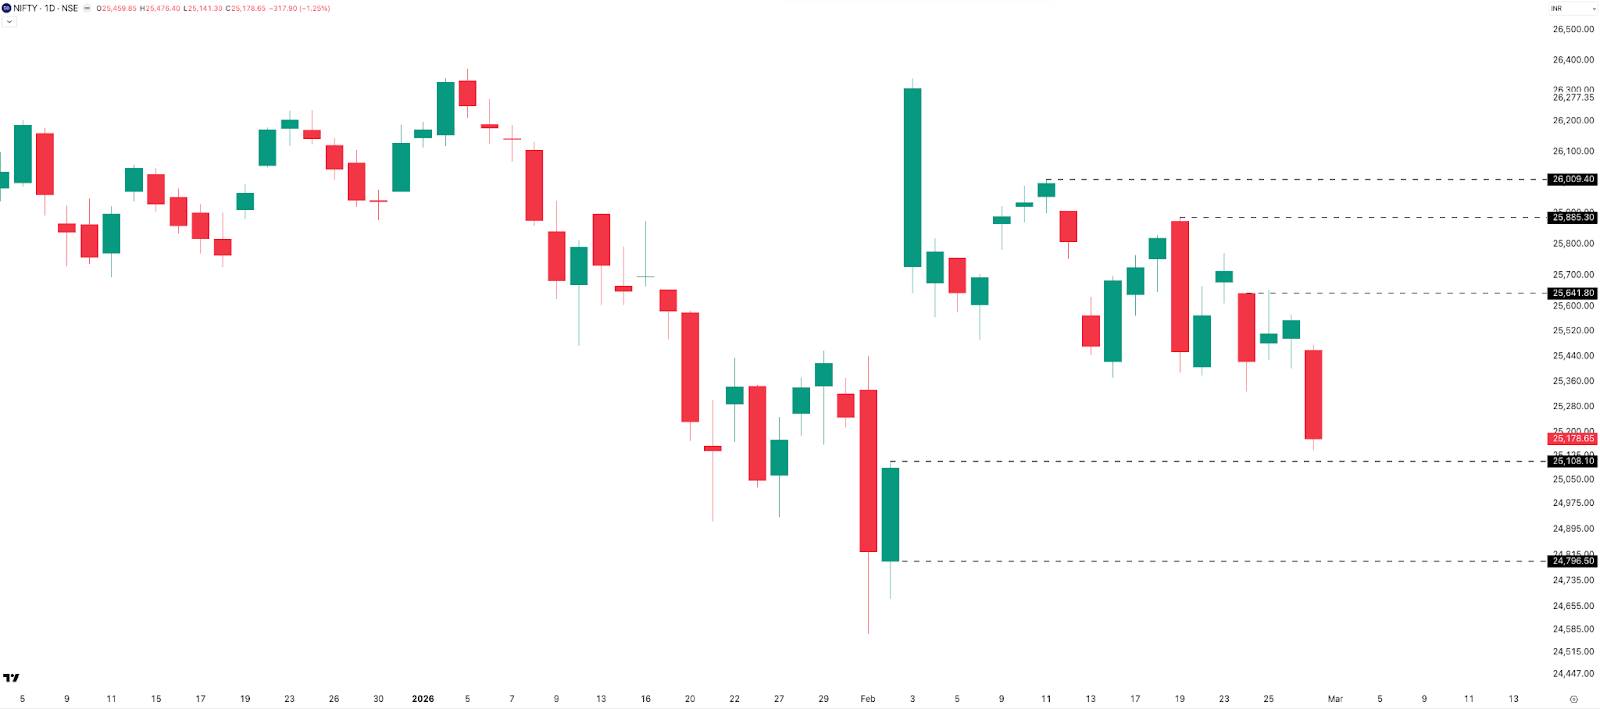
The week saw two –1%+ sessions — Tuesday and Friday — while the remaining three days printed green candles. Monday showed early promise with a gap-up and intraday high of 25,770, but Tuesday’s candle broke last week’s low, and Friday finished the job.
That 3-Feb gap is now very close to being filled — just 33 points separated Friday’s low from 2-Feb’s high. The next supports to watch are 25,108 and 24,800 . Resistances are at 25,650 , 25,900 , and 26,000 . The overall setup points to a downtrending to sideways week ahead.
Hourly
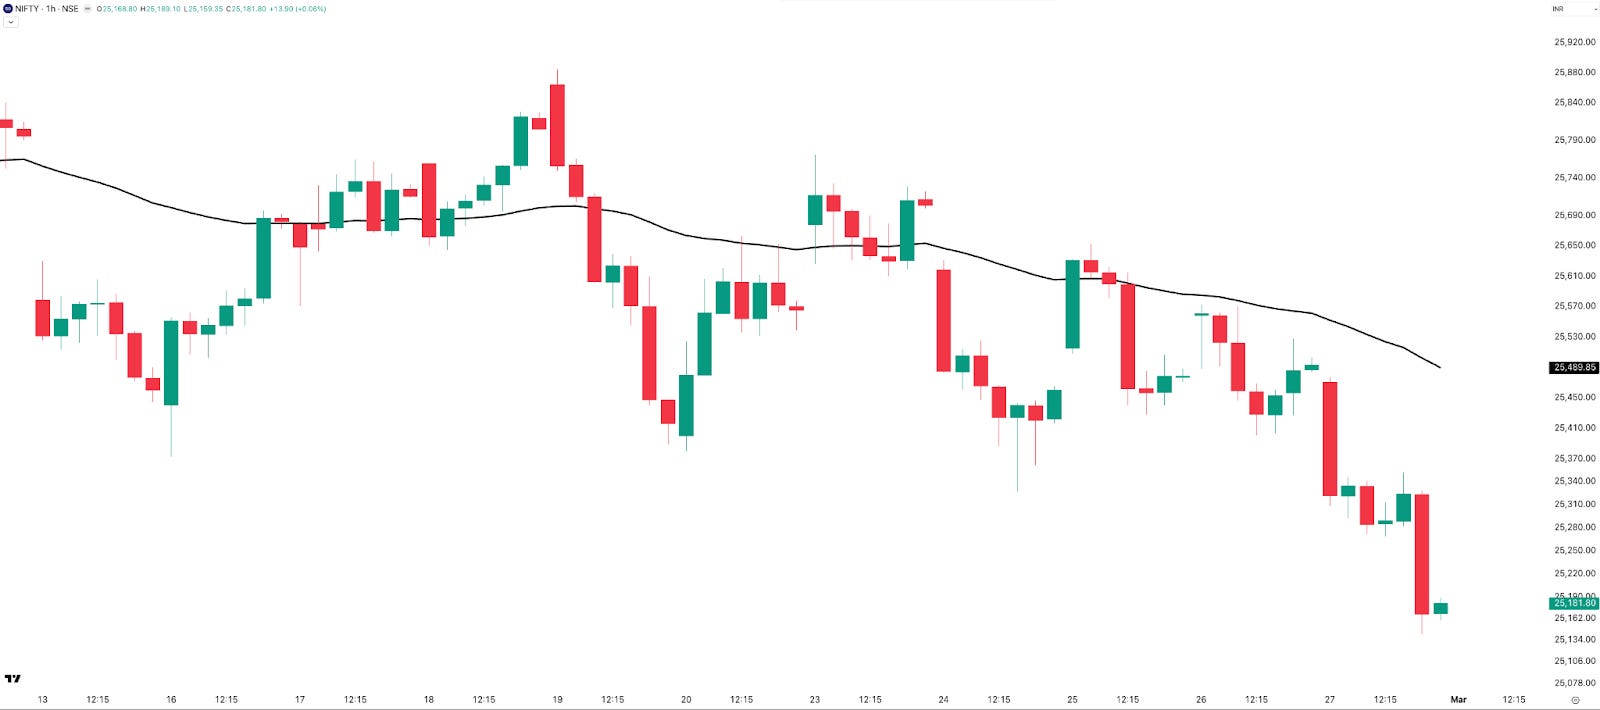
NIFTY traded below the 50 EMA for most of the week from Tuesday onward. Shorts generally worked well, barring some choppy EMA-crossover action on Wednesday. February was one of the tougher months for short-term trend followers — here’s hoping March brings cleaner conditions.
Range Till Expiry (2-Mar)

Note: Monday is a trading day; Tuesday is a holiday on account of Holi.
NIFTY’s 0DTE ATM straddle closed at 203 points , implying a 0.8% move on either side. Last week’s 2DTE premium ahead of the monthly expiry was 238 — so this is a healthy premium going into the first weekly expiry of March, especially with the weekend factor.
Expected expiry range: 25,382 on the upside | 24,976 on the downside — broadly, a 25,000–25,400 band.
Open Interest
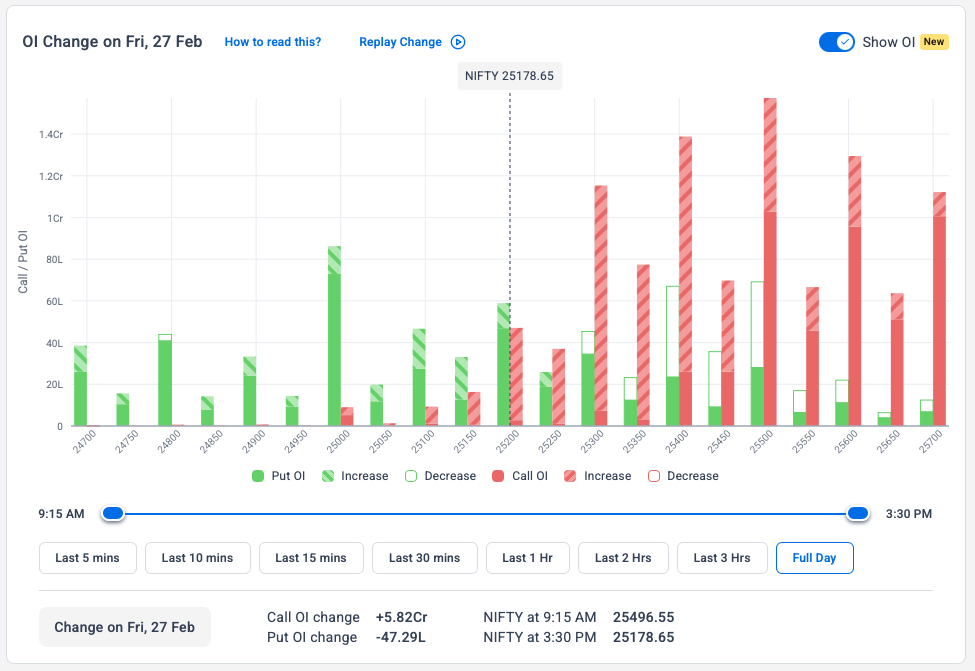
Looking at the upcoming NIFTY weekly expiry open interest,
Rising OI is visible at the 25,300, 25,400, and 25,500 CE strikes. On the PE side, only the 25,000 strike shows meaningful OI. The street appears positioned for a bearish move on Monday, though OI can flip within minutes, so nothing definitive should be read into this. Broad takeaway: 25,000 as support, 25,500 as resistance — with Monday’s 0DTE price action being the real arbiter.
SENSEX
Monthly
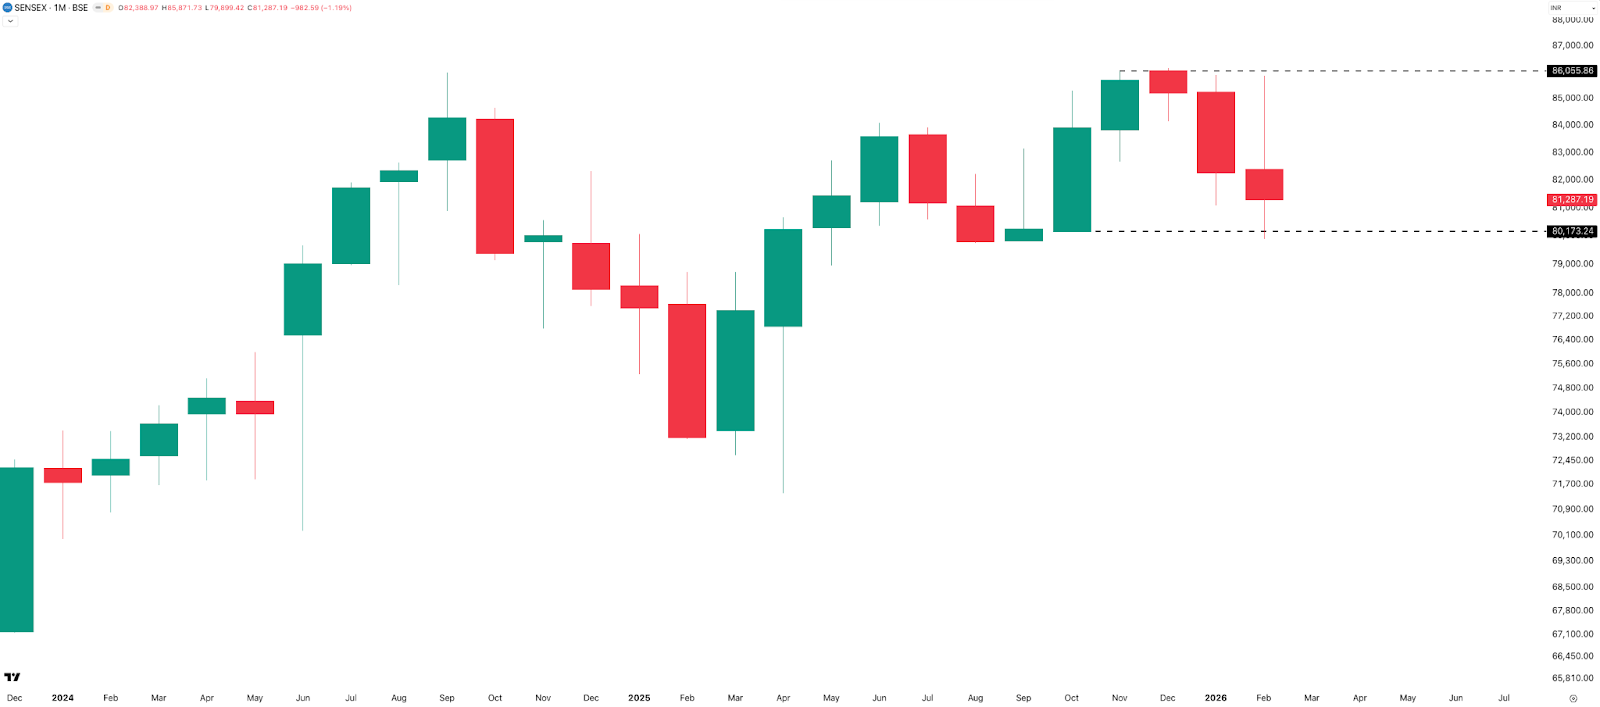
The SENSEX monthly chart mirrors NIFTY’s structure closely. It made a near-7% monthly range of roughly 6,000 points and closed at 81,287 — down 983 points (–1.19%) from January. Key levels: 86,000 as resistance, 80,200–80,000 as support.
Weekly
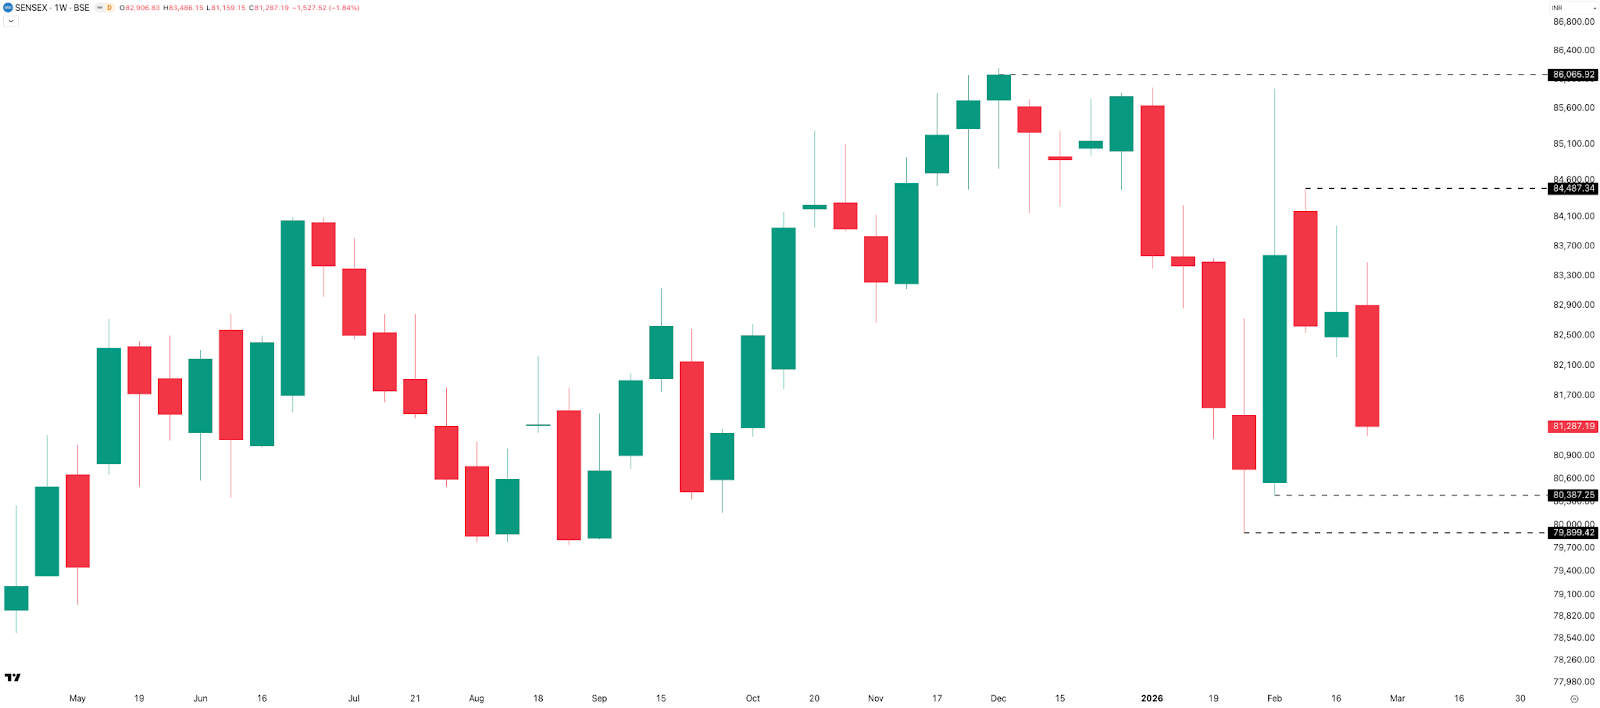
SENSEX shed 1,528 points (–1.84%) to close at 81,287, forming a strong red weekly candle with a long upper wick closing near the week’s lows. Weekly range was 2,327 points (~2.8%). Support is at 80,400 and 80,000 ; resistance at 84,500 and 86,000 .
Daily
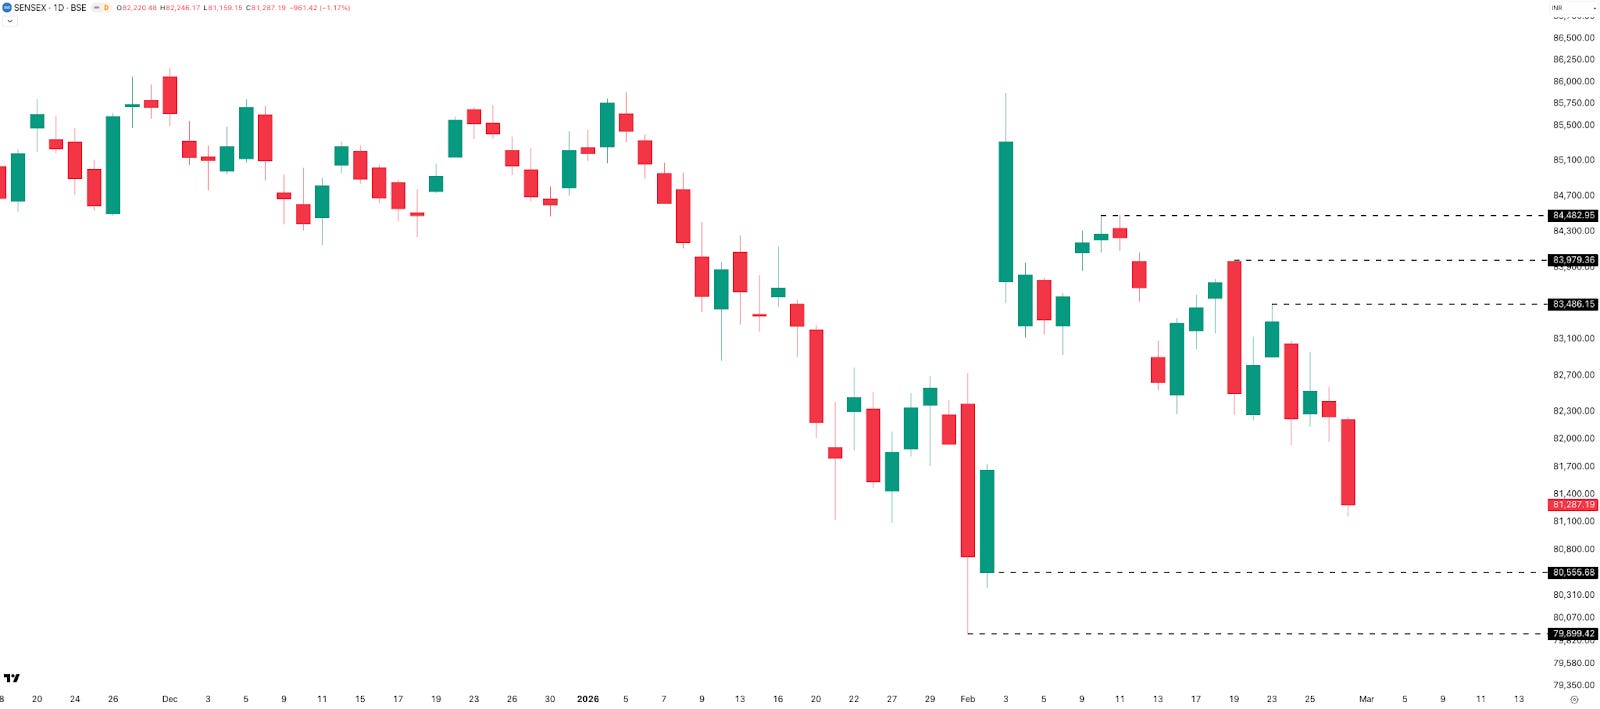
The 3-Feb gap has been filled. Support sits at 80,555 and 80,000 ; resistance at 83,500 , 84,000 , and 84,500 .
Range Till Expiry (5-Mar, Thursday)
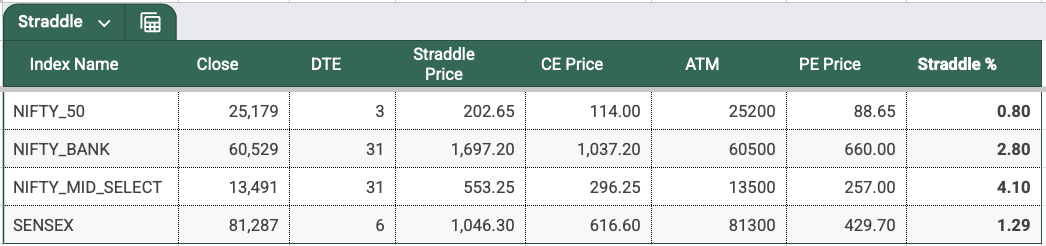
ATM straddle closed at 1,046 points , implying a 1.29% move on either side — broadly similar to last week’s premium.
Expected expiry range: 82,333 on the upside | 80,241 on the downside — roughly 80,250–82,350 .
BANKNIFTY
Monthly Seasonality
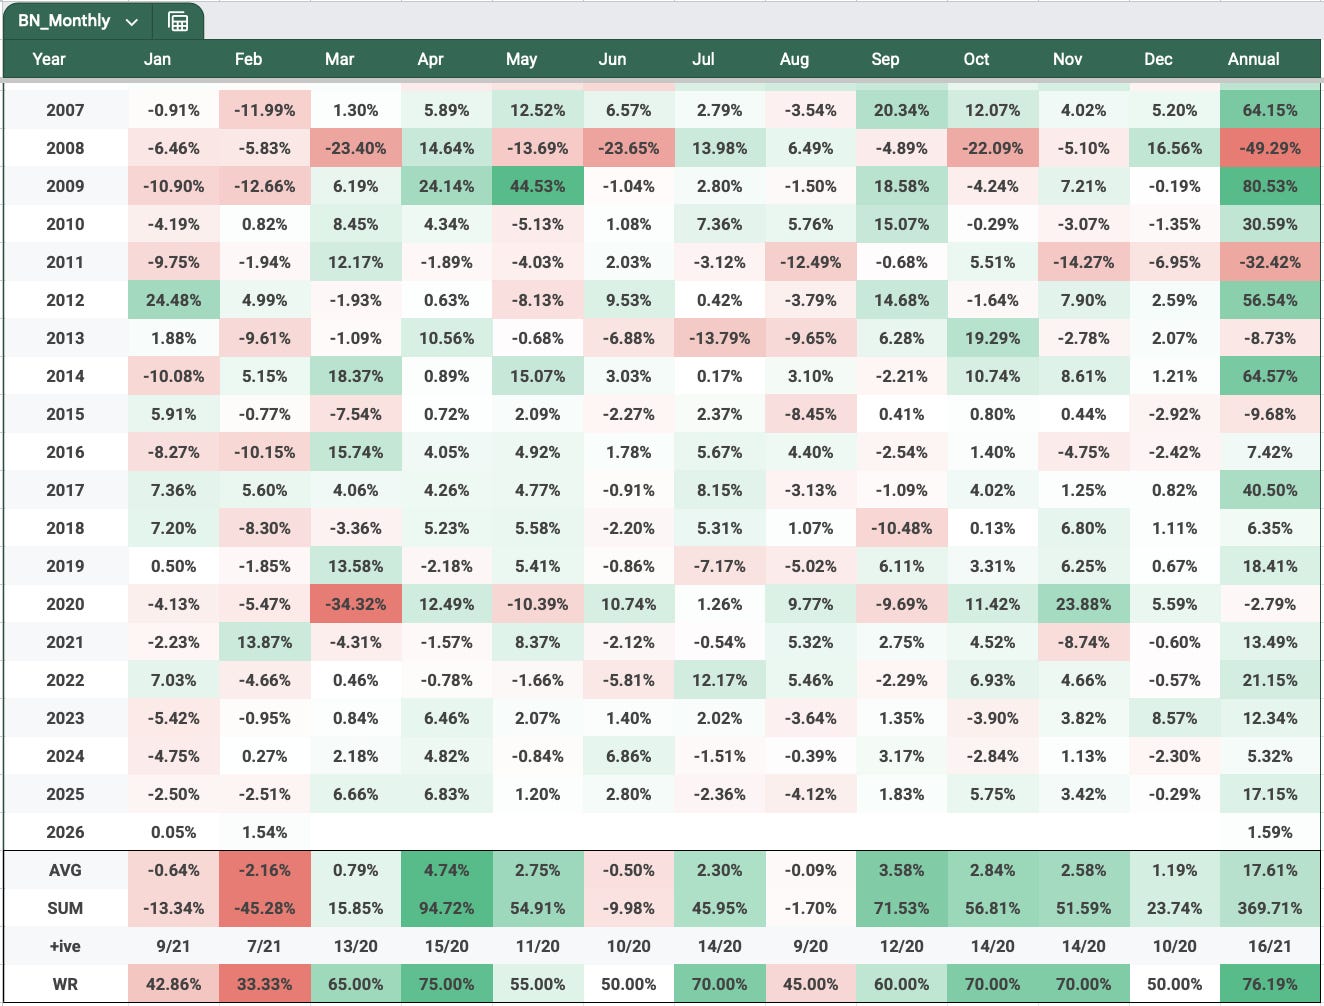
Here’s an interesting divergence: while NIFTY remains in the red YTD, BANKNIFTY gained 1.54% in February to close at 60,529 — its highest monthly close ever. Both months of 2026 have been positive for BANKNIFTY, even as the broader market zigzags.
Daily
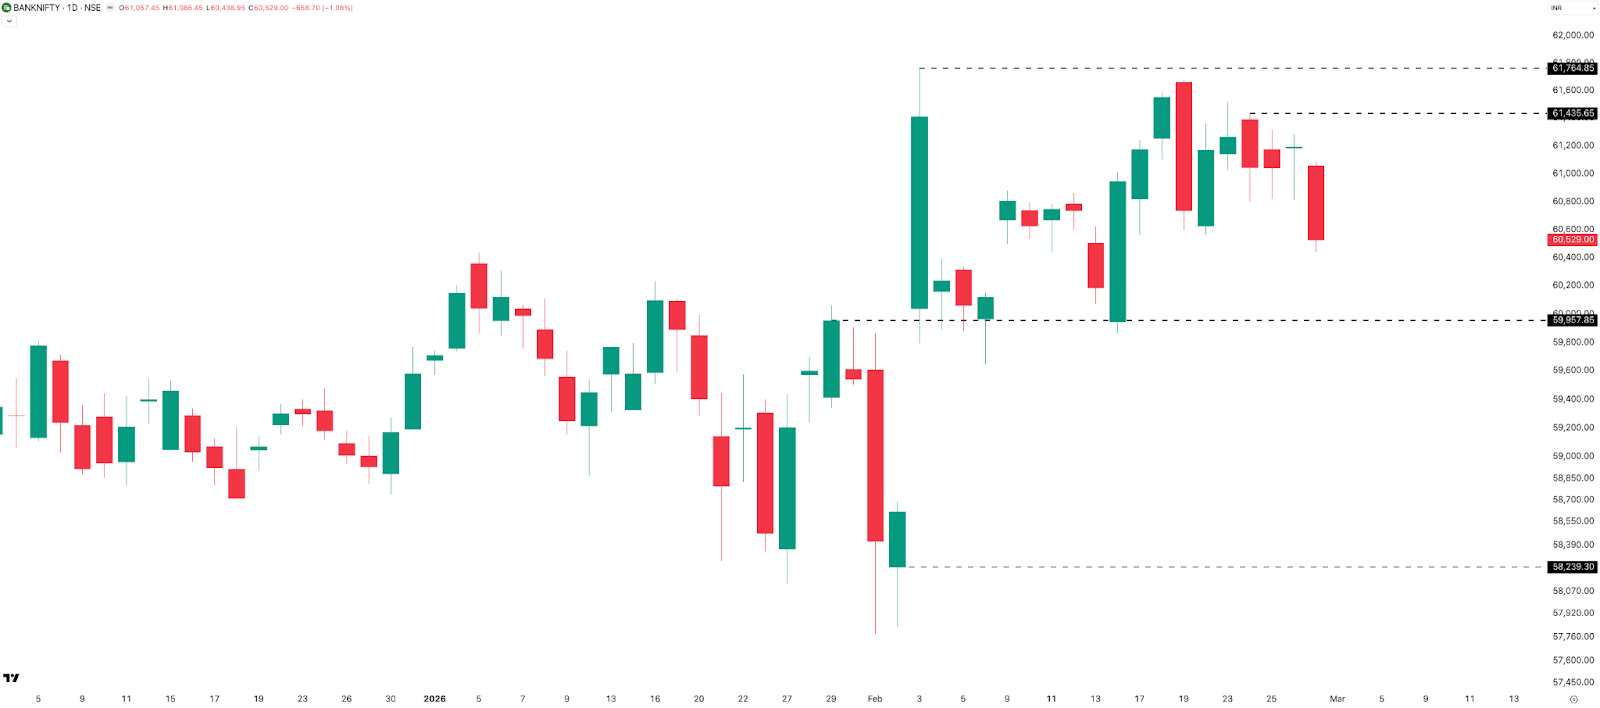
Support is at 60,000, followed by 58,700 . Resistance sits at 61,400 and 61,800 . Outside of Friday, the index did not see any –1%+ candle this week. Weekly range: 1,079 points (1.75%).
Hourly
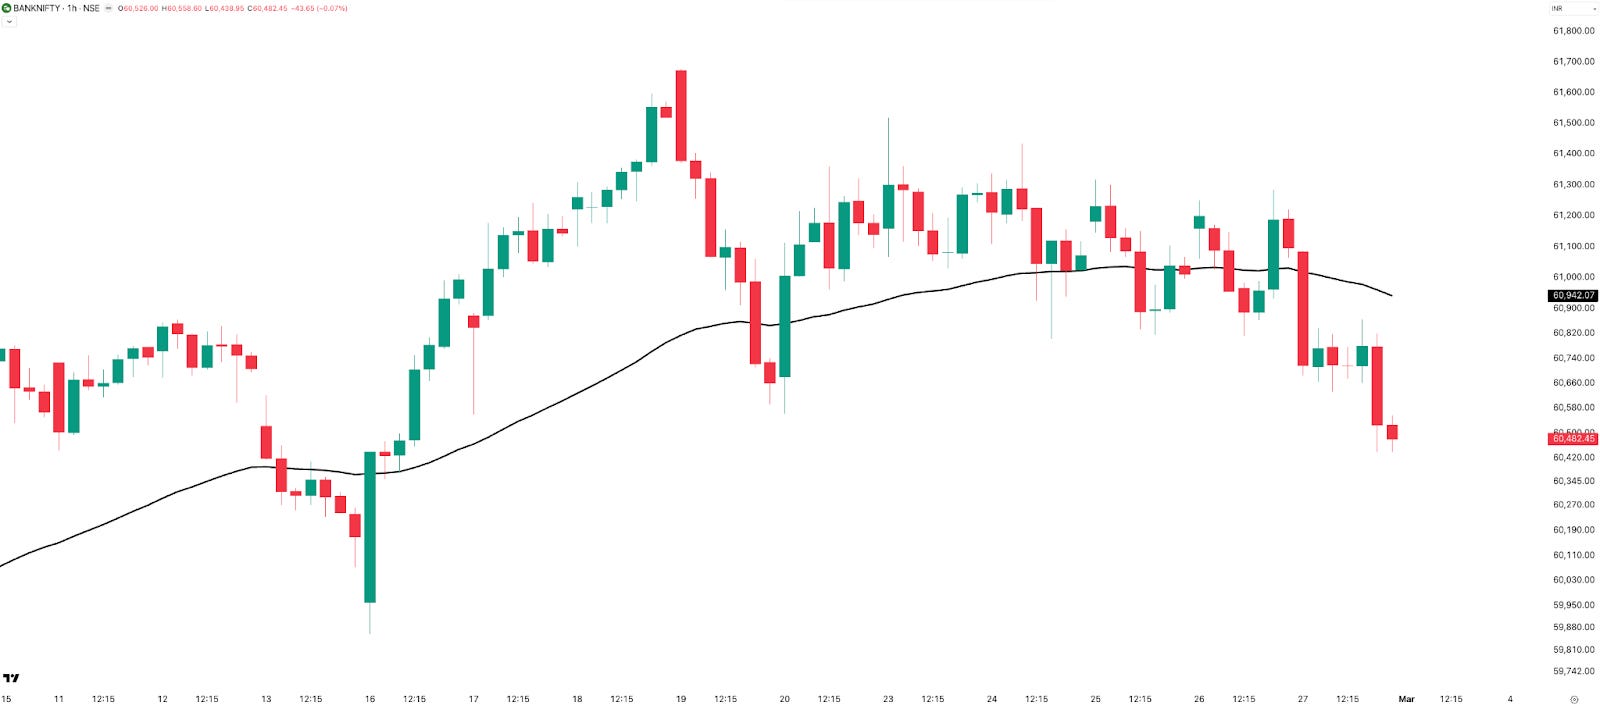
BANKNIFTY chopped around the 50 EMA for most of the week before breaking below it on Friday. Given its relative strength versus other indices, a faster recovery is likely — but short-term trend following on BANKNIFTY hasn’t been particularly rewarding in 2026 either.
Rate of Change (ROC) — Weekly Snapshot
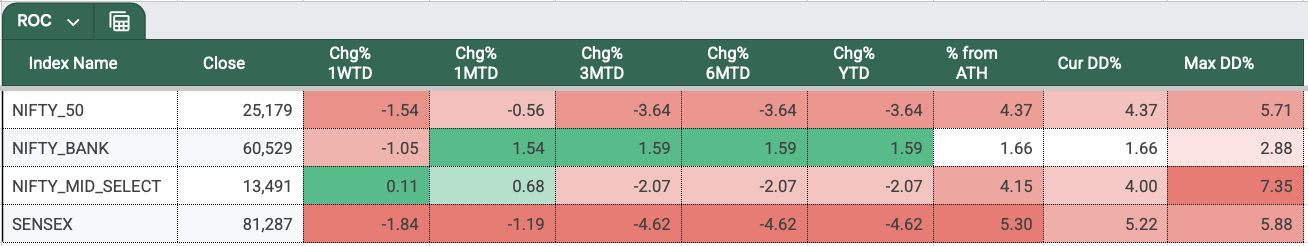
Week 9 was red across the board, with MIDCPNIFTY barely clinging to positive territory at +0.11% . NIFTY, BANKNIFTY, and SENSEX fell 1.54%, 1.05%, and 1.84%, respectively.
Year-to-date, only BANKNIFTY (+1.59%) remains in the green. January and February have historically been negative months for Indian equities, and 2026 is staying true to that pattern. Based on current price action, a broad trend reversal doesn’t appear imminent.
Sectors
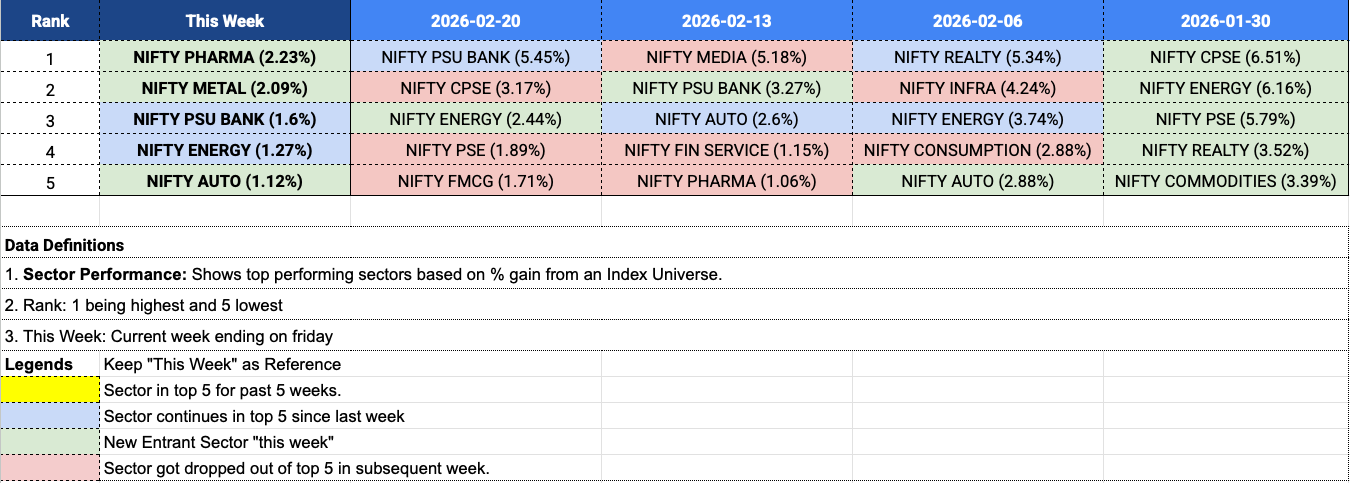
Top performers this week: PHARMA (+2.23%), METAL (+2.09%), AUTO (+1.12%), PSU BANK, and ENERGY.
PSU BANK has now featured in the top five sectors for three consecutive weeks — it is PSU banks, not private banks, that are holding up the BANKNIFTY index. IT, on the other hand, likely sits atop the worst performers list this week — a sector worth tracking separately from next week.
Ranges & Expiries
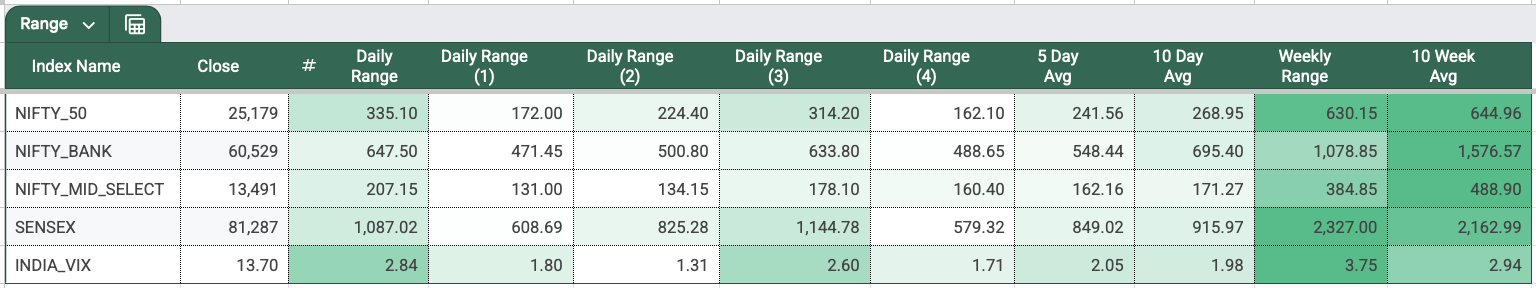
NIFTY’s 5-day average daily range dipped from 296 points last week to 242 points this week, though Tuesday and Friday both printed 300+ point ranges. All three Fridays over the past three weeks have featured large moves — could be recency bias, or just Fridays being Fridays.
NIFTY Feb Monthly Expiry (24-Feb)
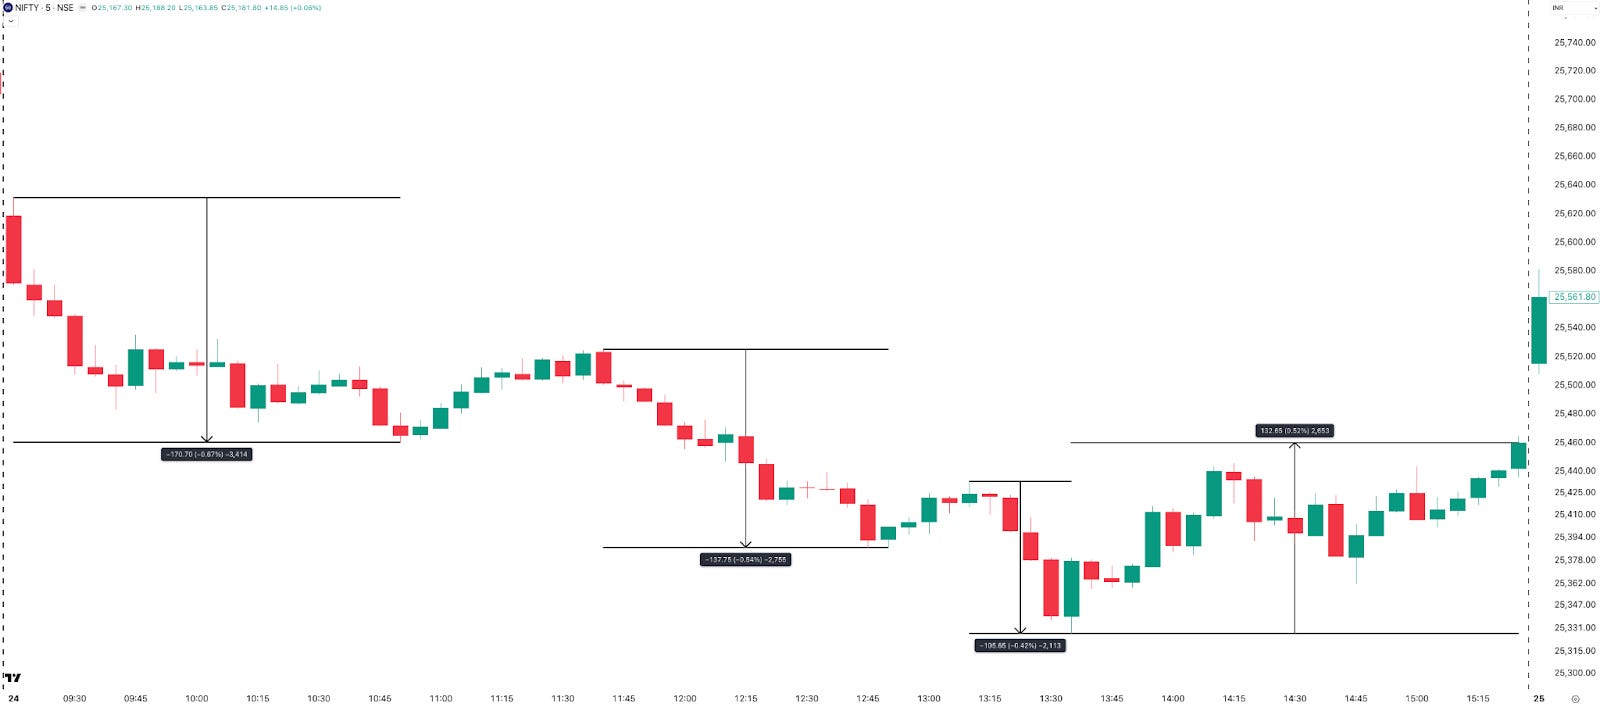
After an 80-point gap-down open, NIFTY continued lower through the session without meaningful pullbacks, save for a ~130-point bounce post 1:30 PM. The ATM straddle opened at 135 points and stayed relatively contained. NIFTY ended the day down 288 points (–1.12%) — a good day for directional option sellers and buyers alike.
SENSEX Monthly Expiry (26-Feb)
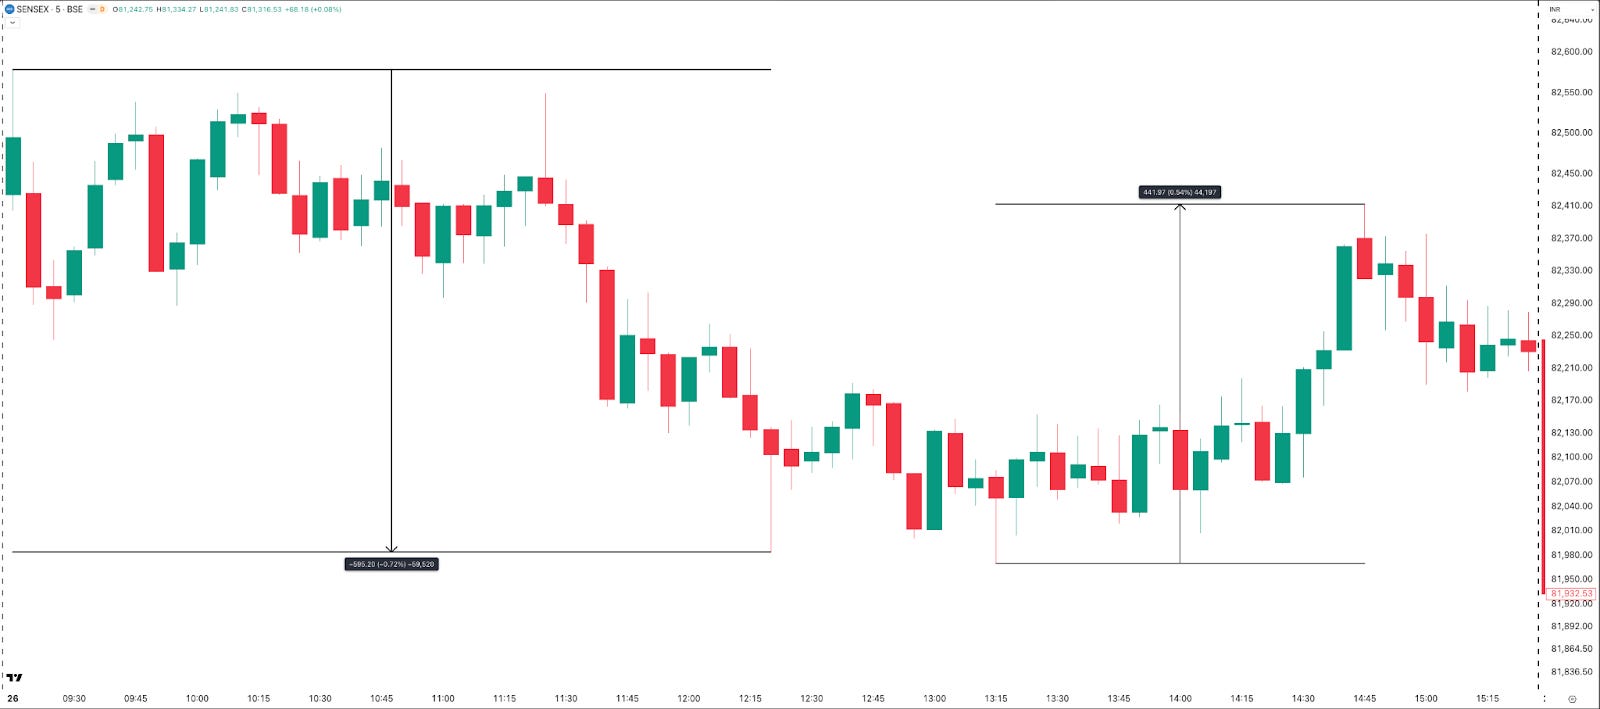
This was a rougher one. The ATM straddle opened at just 360 points, but SENSEX moved nearly 600 points in the first three hours, with sharp intraday swings. Post 1:05 PM, it rallied 442 points. A tough session for option writers — and arguably for option buyers too, given how difficult it would have been to hold MTM gains through the volatility.
INDIAVIX
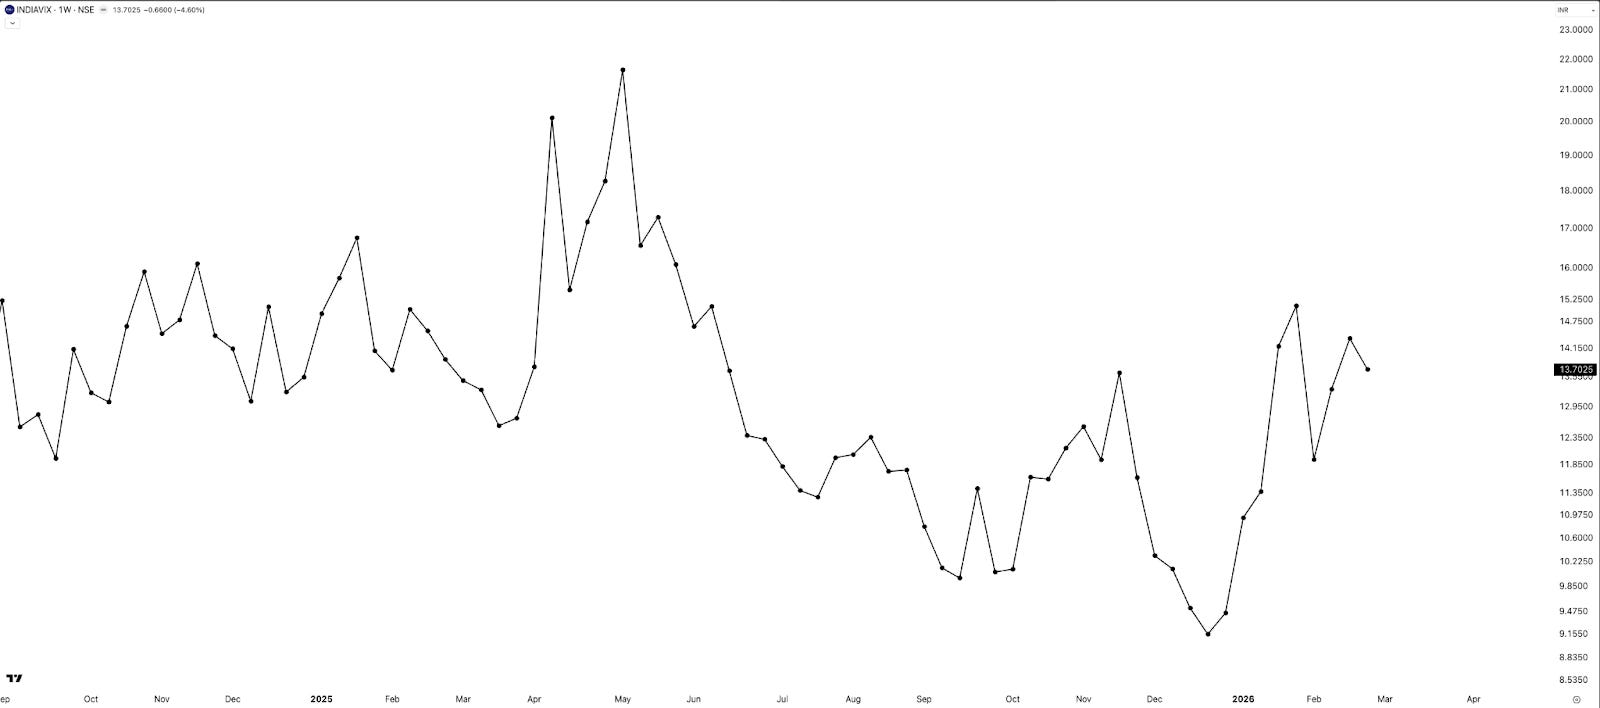
INDIAVIX fell 4.6% to close at 13.7 for the week. Despite this, 0DTE NIFTY straddle premiums remain above 200 — likely a function of the weekend ahead rather than any underlying vol concern. Nothing material to read into here.
Commodities
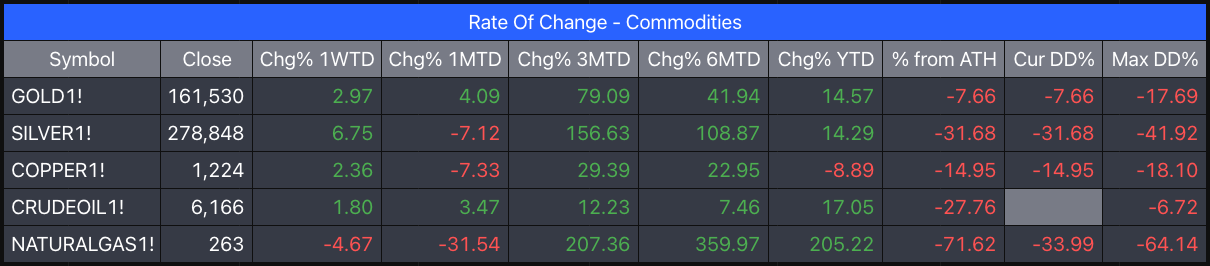
Commodities continue to hold up and move broadly in line with expectations. Precious metals and copper were all in the green this week:
- Silver: +6.75%
- Gold: +2.97%
- Copper: +2.36%
- Crude Oil: +1.80%
- Natural Gas: –4.67%
Worth highlighting: while NIFTY50 is down ~4% for the year, Gold is up 14% YTD . Whether that momentum continues is the question.
Summary
Week 9 was broadly negative for equities. NIFTY fell 1.54%, SENSEX dropped 1.84%, and BANKNIFTY declined 1.05%, while MIDCPNIFTY barely held on. Year-to-date, only BANKNIFTY remains positive, underscoring clear relative strength in banking.
Price action across timeframes stayed choppy, with strong red weekly candles and weak follow-through on rebounds — making short-term trend following difficult. Sectorally, PSU Banks continued to lead, while Pharma and Metals saw late-week strength. Commodities were mixed — Gold and Silver firm, Natural Gas under pressure.
The overall structure remains sideways to weak , with selective strength in Banking and defensives.
What Caught Our Attention This Week
1. Sectoral Skew Across NSE Market Cap Indexes — Veteran market analyst Nooresh Merani breaks down the fascinating concentration shifts as you move from large-cap to microcap indices. Recommended reading for anyone interested in index composition and factor exposure. Read here →
2. Why Are Chinese EVs So Cheap? — A deep dive by the Rhodium Group (NY-based think tank) exploring the cost structure behind China’s EV dominance. If you’ve noticed BYD and GWM dominating markets in Thailand and Brazil — countries with low import barriers — this piece explains why. Read here →
What to Expect Next Week
Next week is a four-day trading week — Tuesday is a holiday on account of Holi — and marks the first week of March 2026. No major known events are on the calendar.
With that, we wrap up this week’s Weekly Market Metrics. Wishing you a very happy Holi!
If you find this series useful, don’t forget to subscribe to the newsletter.
Until then — stay curious, stay steady, and enjoy your weekend.