Welcome to another edition of Weekly Market Metrics. I am Sandeep Rao.
We’re in Week 11 of 2026, and it’s mid-March. NIFTY is now 11% below its all-time high — and this week alone, the index fell close to 5%. That’s the single biggest weekly fall since June 2022. Three years and nine months.
 | Markets See Biggest Weekly Fall in Years")
Last week, despite all the geopolitical tensions in West Asia, markets appeared relatively calm. This week, the fear started showing up. The effects of those tensions are now being felt closer to home. These are difficult times — for us and for the world.
As much as it is painful to say in the context of the human toll such events carry, these are also historically the moments where markets begin to offer real opportunities — both for investors and for traders.
Let’s get into the charts.
NIFTY
Weekly
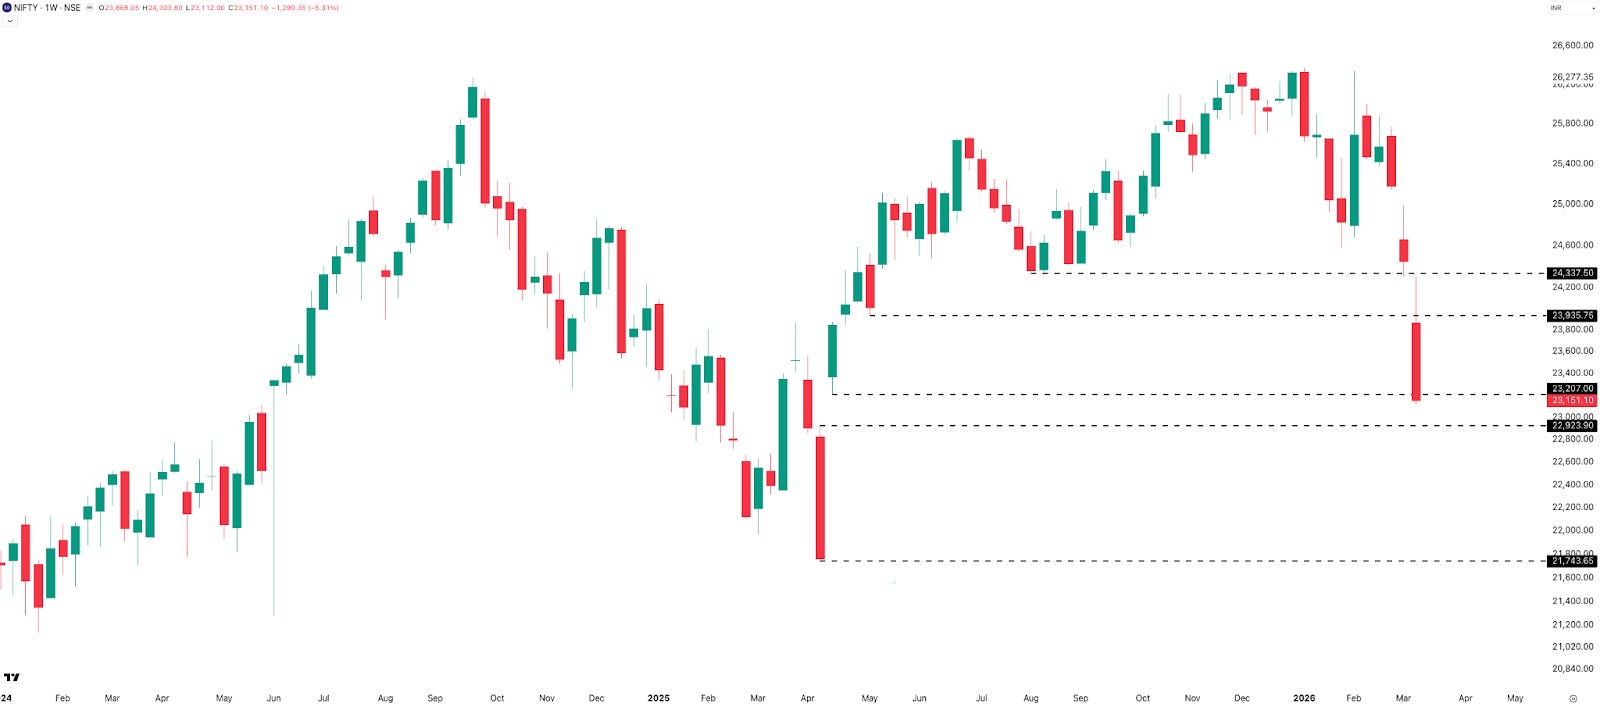
NIFTY lost 1,299 points (–5.31%) this week to close at 23,151 . Let that sink in. This was the biggest weekly fall in 3 years, 8 months, and 24 days — the last comparable decline was the week of 13 June 2022, when the index fell 5.61%.
Immediate resistance is at 23,200 , followed by the 23,900–24,000 zone. Support is seen at 22,900 , and then near 21,750 . The bias for the coming week remains bearish, with pullbacks likely to be sold into.
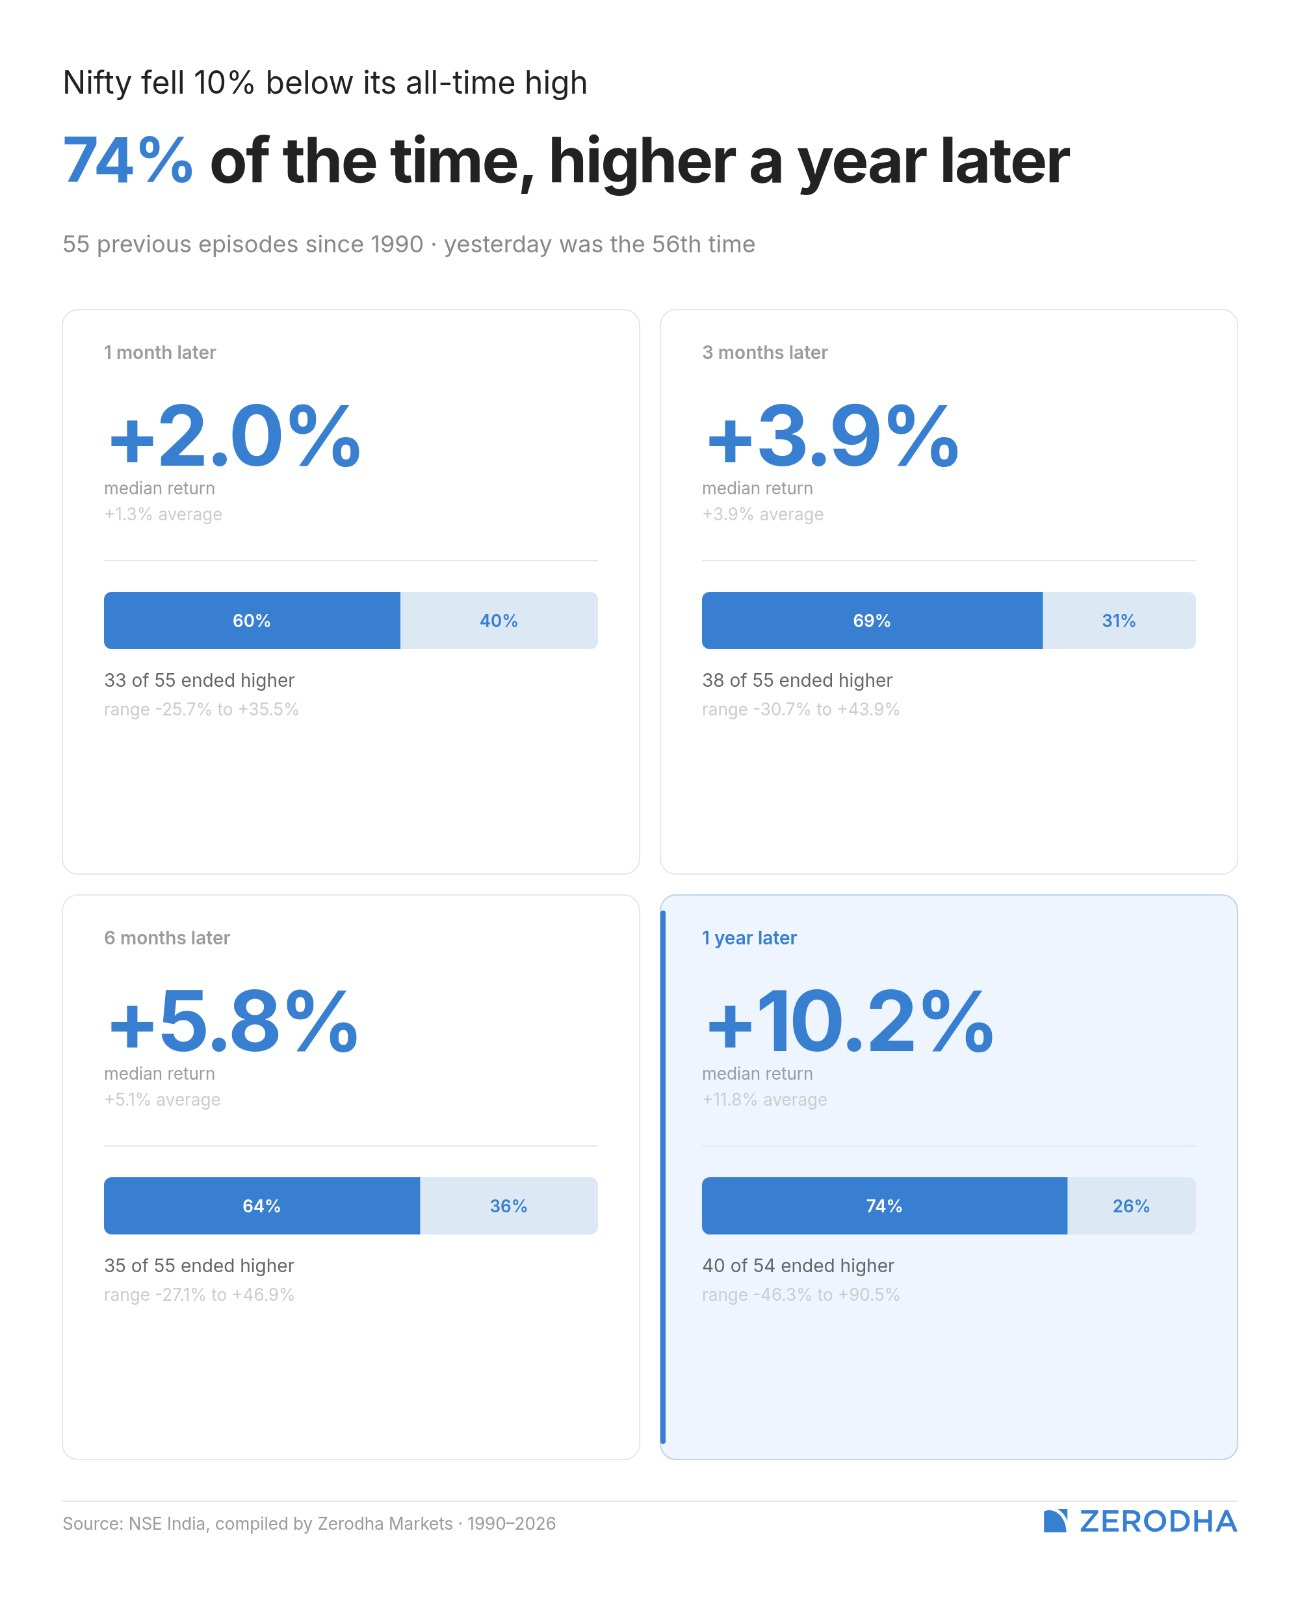
Given the severity of the move, a quick look at historical data offers some perspective: across 35 years of NIFTY data, every time the index has closed more than 10% below its high, it has been higher a year later 74% of the time , with a median return of 10.2% . Some solace in difficult times.
Daily
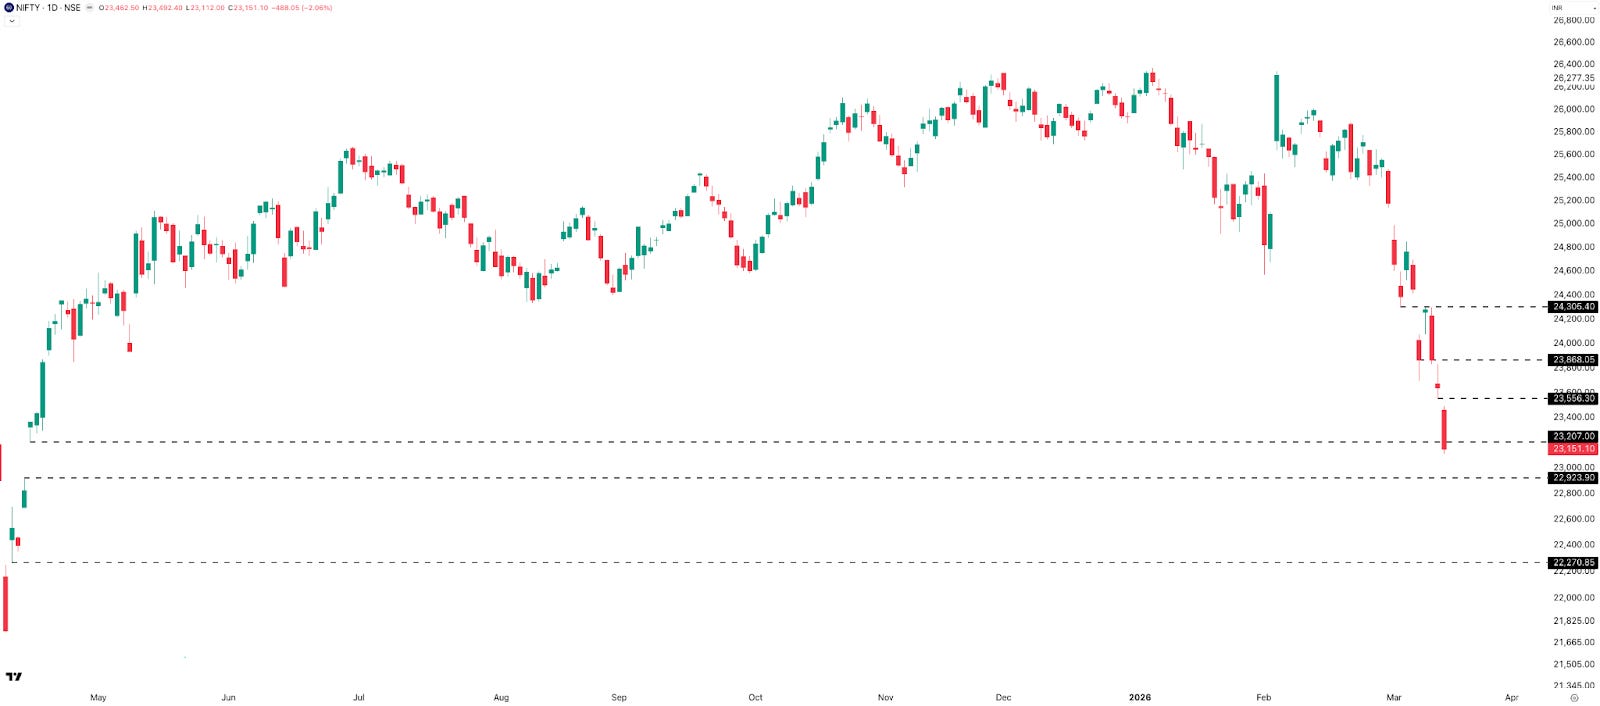
The week’s daily breakdown: –1.73% Monday, +0.97% Tuesday, –1.63% Wednesday, –0.95% Thursday, –2.06% Friday. Four red days, one green.
Pullbacks in a downtrend can feel sharp enough to suggest the worst is over — but unless we start seeing closes above recent swing highs, or price action forming higher highs and higher lows, the trend hasn’t changed. Supports are at 22,900, followed by 22,300 . Resistances are at 23,200 , 23,550 , and 23,850 zone.
Hourly
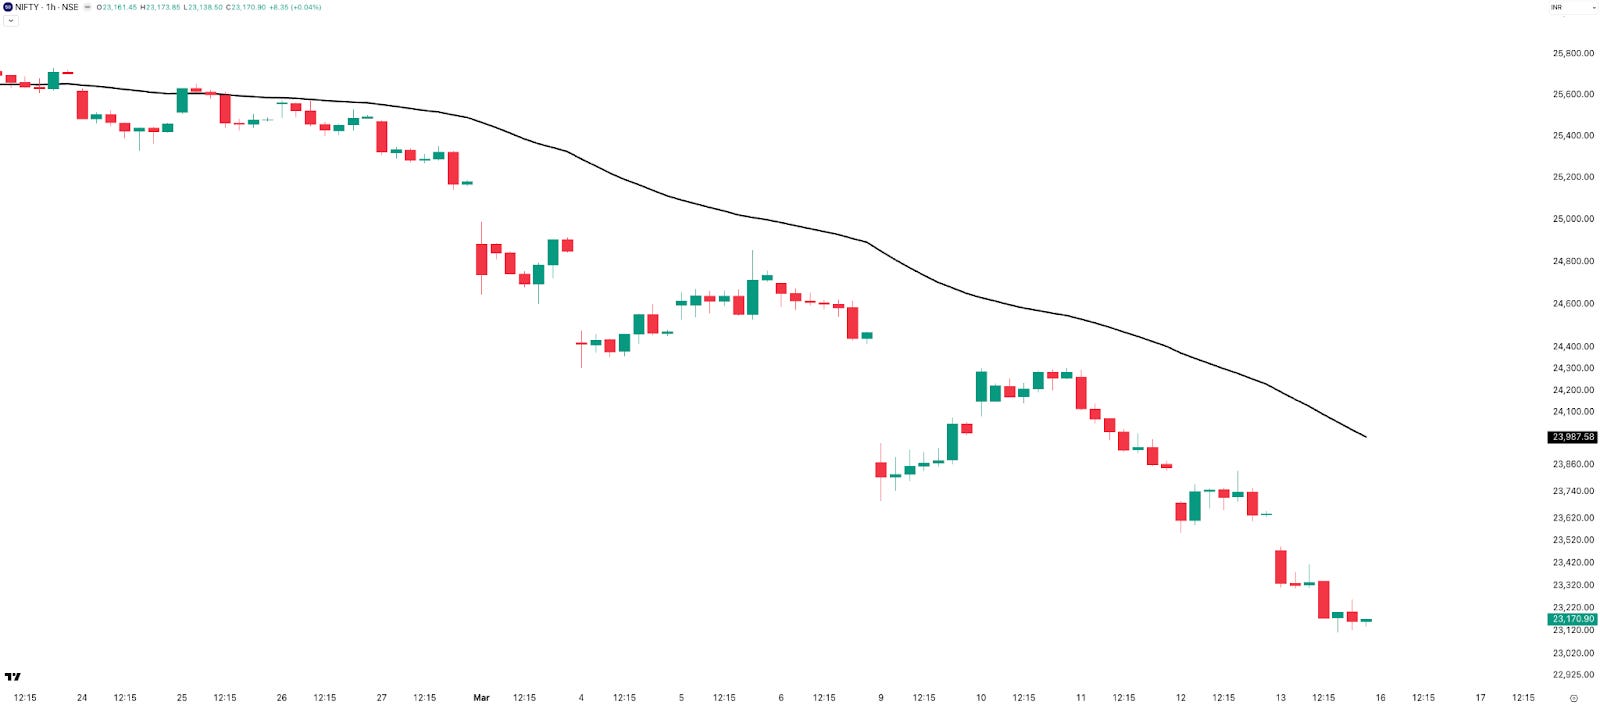
NIFTY stayed comfortably below the 50 EMA throughout the week. Even Tuesday’s pullback couldn’t sustain — the down move quickly resumed. After a long stretch of choppy, directionless conditions, short-term trend followers finally have a proper trend to work with. That’s often how trend following plays out — many small losses, eventually recovered by one sustained move.
Range Till Expiry

Moving to NIFTY’s expected range till the upcoming weekly expiry.
NIFTY’s 1DTE ATM straddle premium closed near 500 points — up 72 points from last week — implying approximately a 2.15% move on either side. Given the ongoing geopolitical uncertainty, this elevated premium was expected.
Expected expiry range: 23,650 on the upside | 22,650 on the downside — roughly a 1,000-point band priced in for the week.
Open Interest
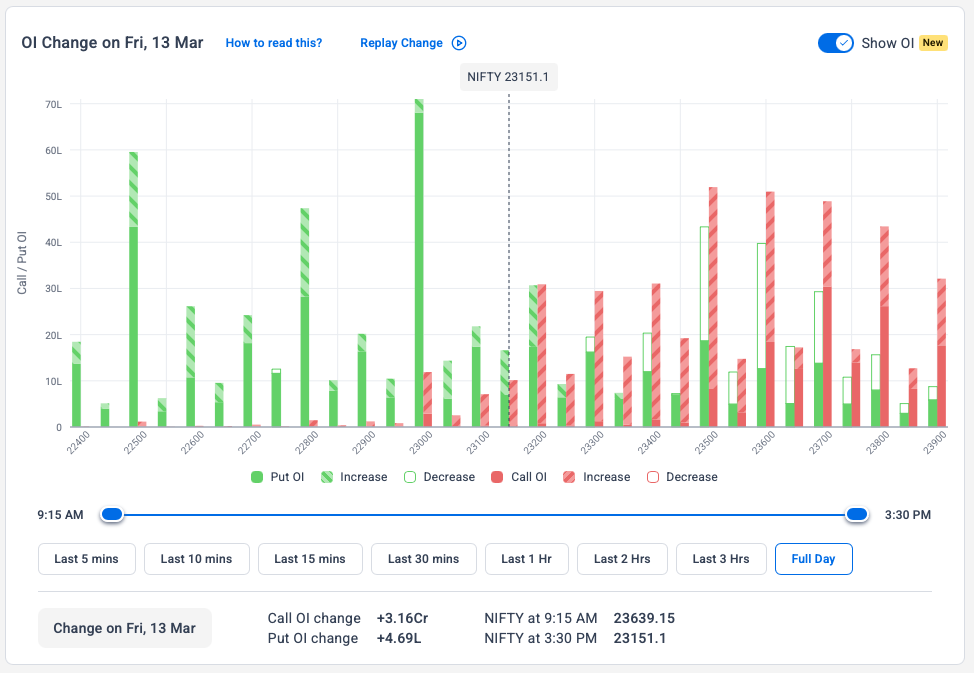
Looking at the upcoming NIFTY weekly expiry open interest,
On the PE side, the 23,000 , 22,800 , and 22,500 strikes have the highest open interest heading into the weekend. On the CE side, the 23,500–23,700 zone has relatively higher OI. PE open interest currently exceeds CE open interest — but given how fast the index has been moving, these numbers can shift quickly. Broadly: 23,000 as downside anchor , 23,500–23,700 as upside cap .
SENSEX
Weekly
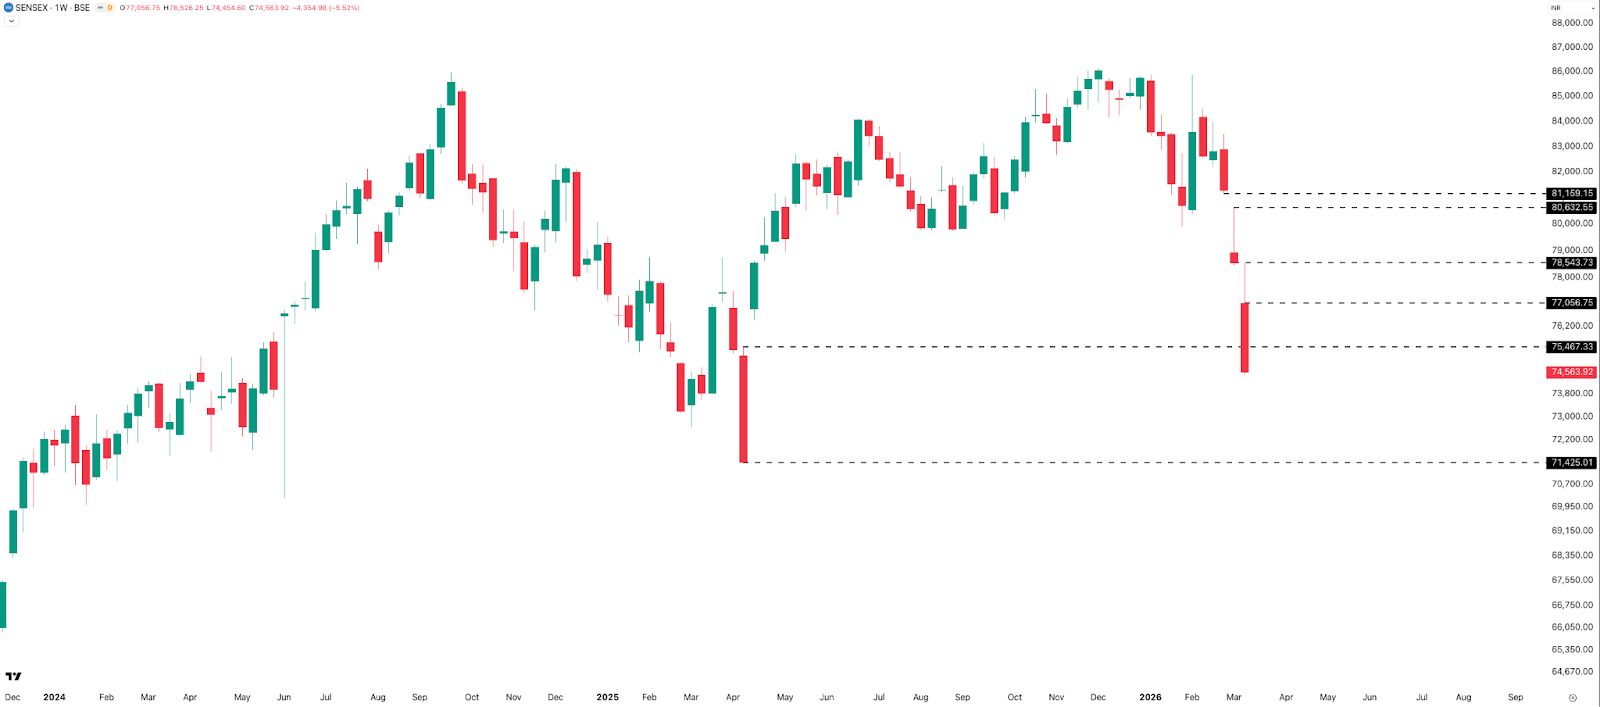
SENSEX lost 4,355 points (–5.52%) to close at 74,563 . The inverted hammer from last week found no upside follow-through — the index simply continued lower. Immediate resistance sits at 75,500 , followed by 77,000 and 78,500 . Support is near 71,400 . The view remains bearish, with pullbacks unlikely to change the broader direction.
Daily
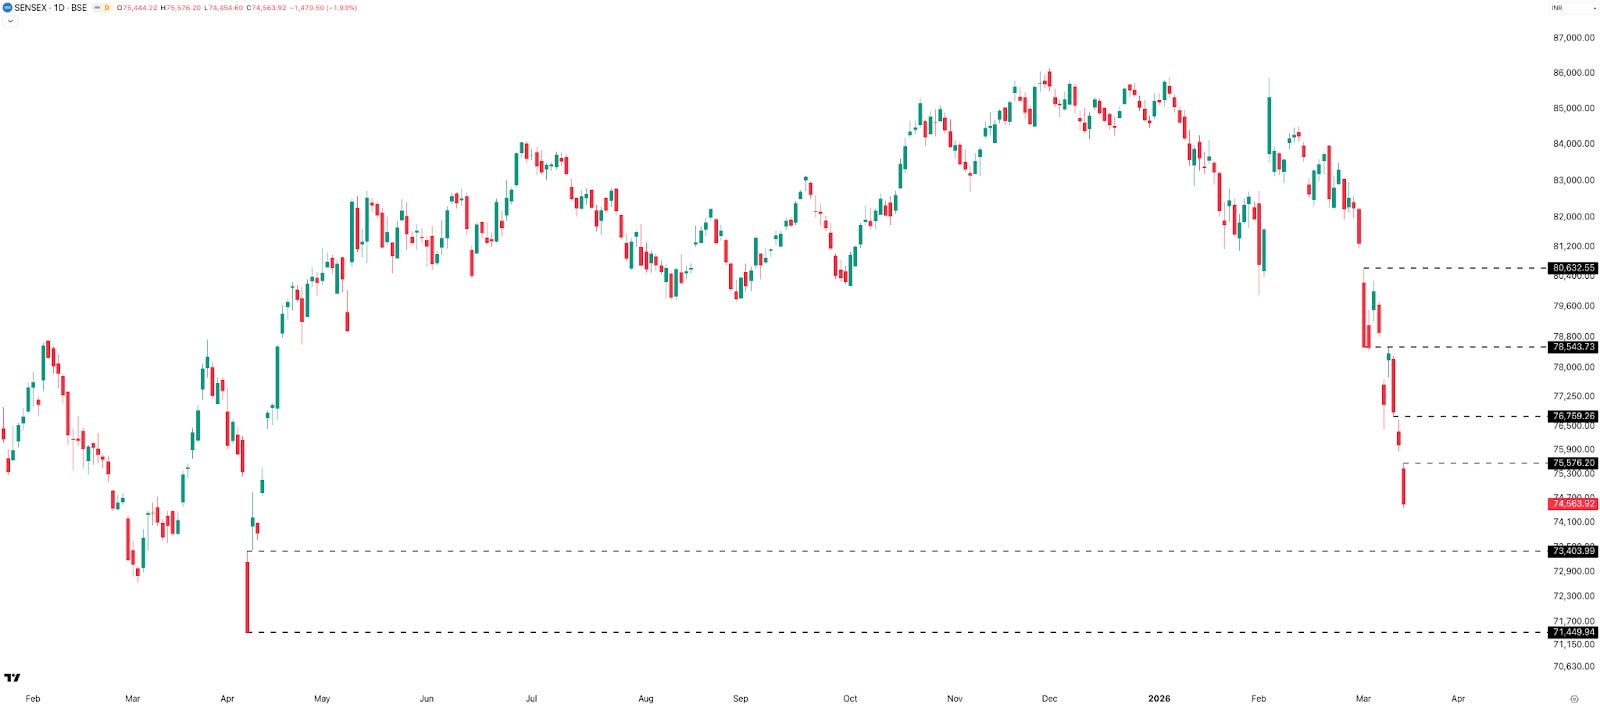
Supports: 73,400 , then 71,450 — the low made after the Trump tariff announcement in April 2025. Resistances: 75,600 , 76,750 , 78,550 .
Range Till Expiry (19-Mar, Thursday)
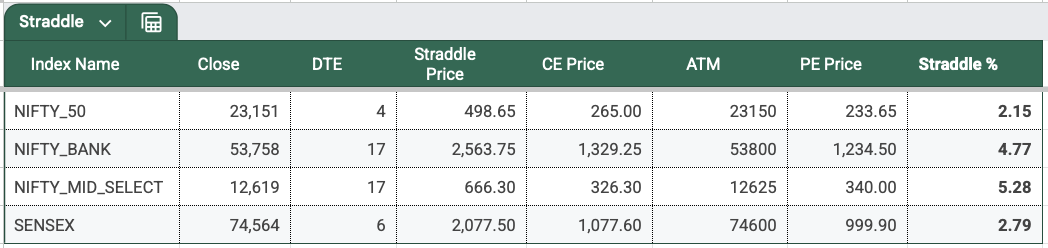
ATM straddle closed at 2,078 points , up from 1,801 last week, implying a 2.79% move on either side.
Expected expiry range: 76,642 on the upside | 72,486 on the downside — broadly 72,500–76,650 .
BANKNIFTY
Daily
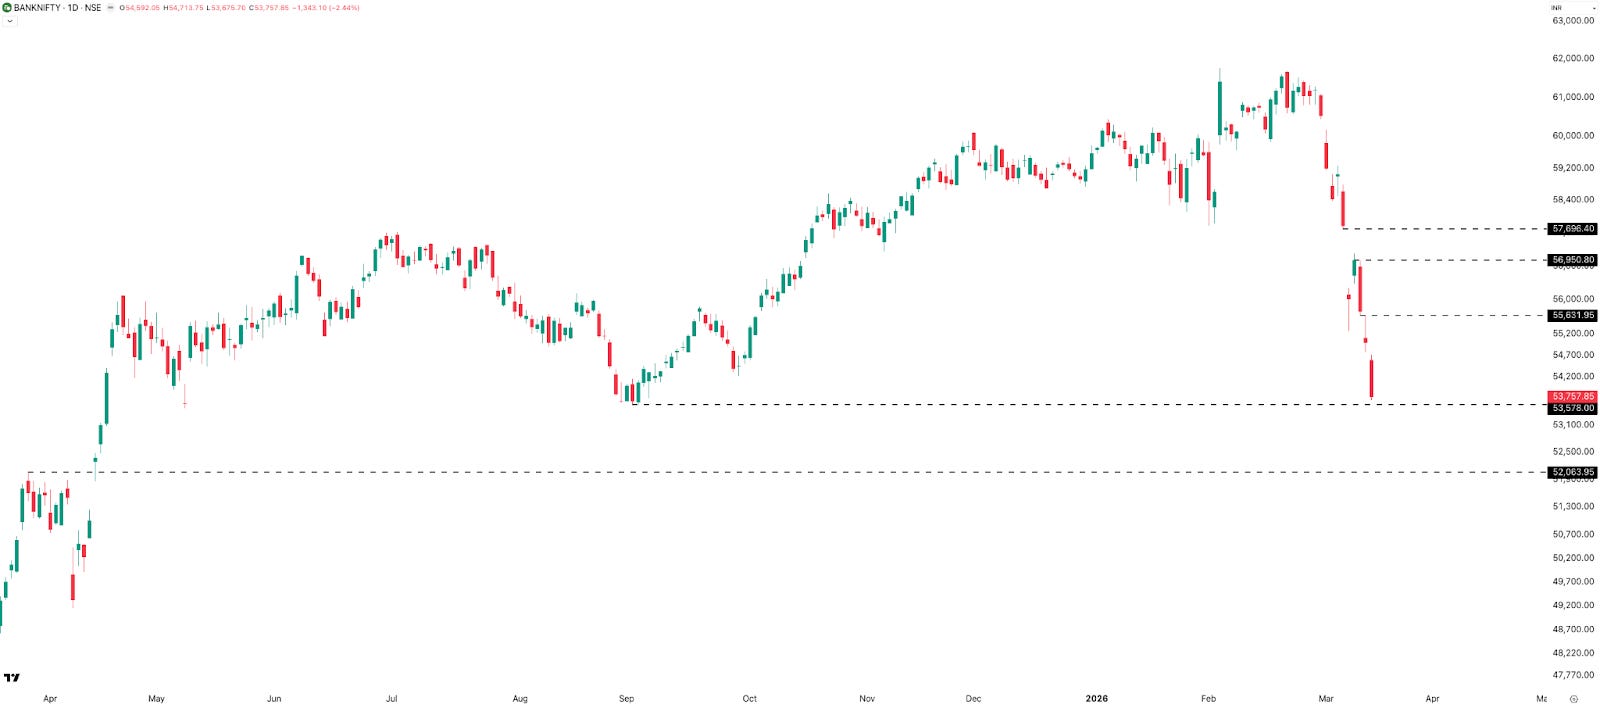
BANKNIFTY lost 4,025 points (–6.97%) for the week — the largest weekly fall since the week of 18 May 2020. That’s 5 years, 9 months, and 19 days. The weekly range was 3,421 points (6.37%).
The index is sitting at a critical support of 53,600 ; below that, the next level is around 52,000 . Resistance lies at 55,630 , followed by 56,950 and 57,700 . In clearly bearish conditions like these, following the trend is almost always preferable to taking contra bets on the upside.
Hourly
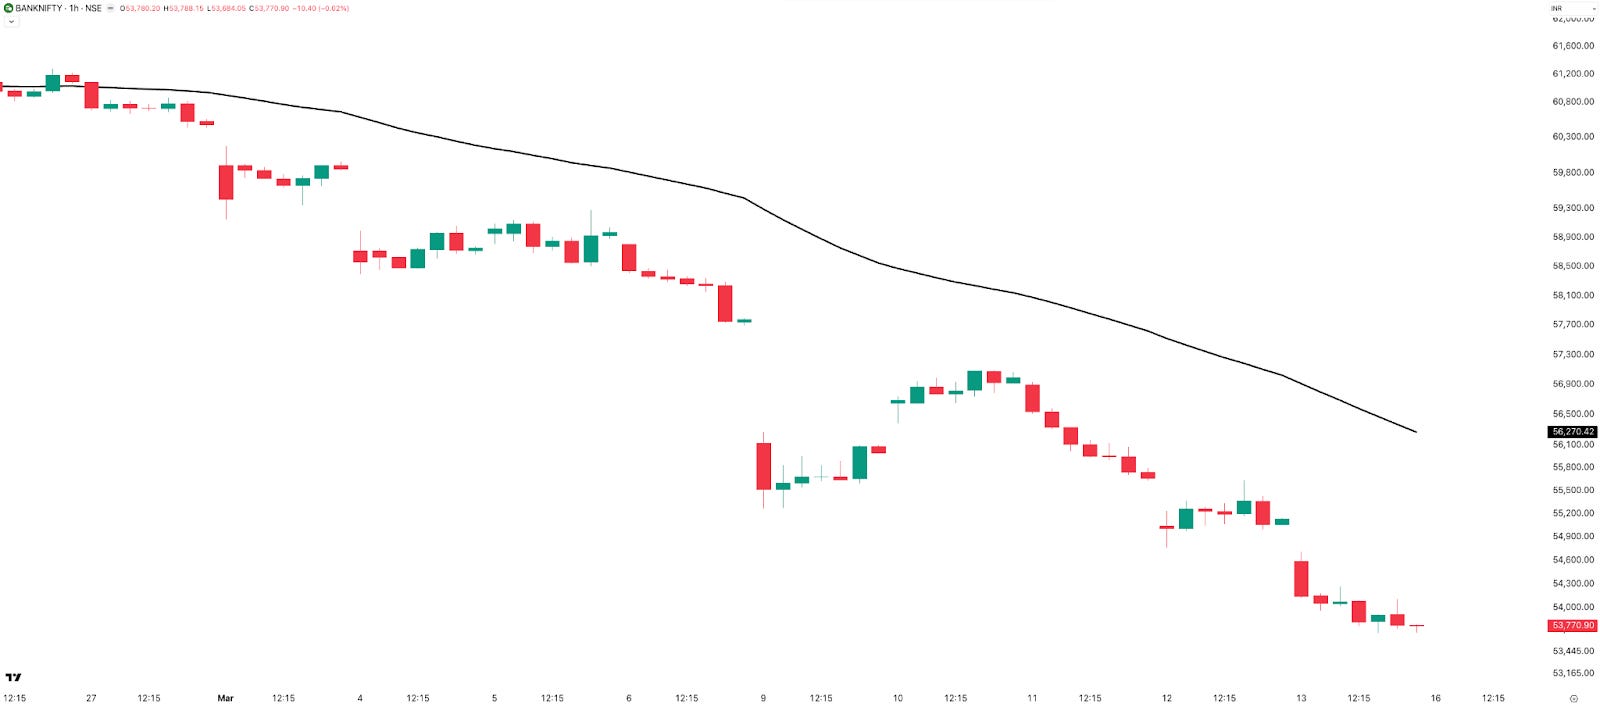
Price remains below the 50 EMA, and the trend from last week has continued. For short-term trend followers on the short side, this is shaping up to be one of the biggest single trades in years. That said, moves on the downside carry a particular psychological complexity — trading positions may be in profit while the broader portfolio bleeds, leaving the net-net feeling closer to breakeven. Trading gains compensating for notional portfolio losses is a reality many are navigating right now.
Rate of Change (ROC) — Weekly Snapshot
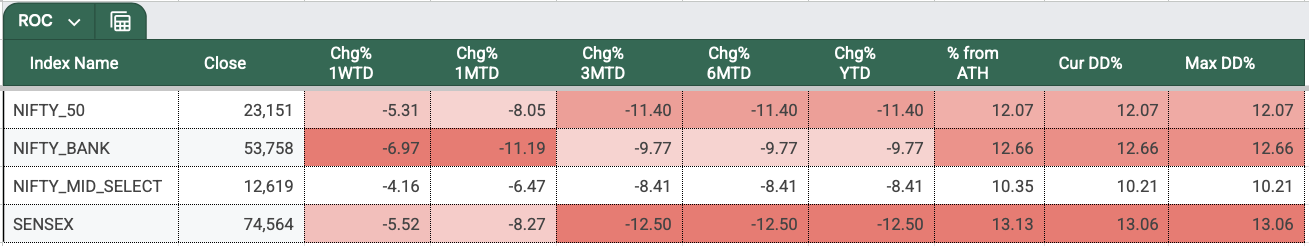
Week 11 was deep red across the board. BANKNIFTY fell ~7% , SENSEX ~5.5% , NIFTY 5.3% , and MIDCPNIFTY ~4.2% .
Year-to-date: SENSEX –12.5% , NIFTY –11.4% , BANKNIFTY –10% . All three months of 2026 — January, February, and now March — are tracking red.
Sectors
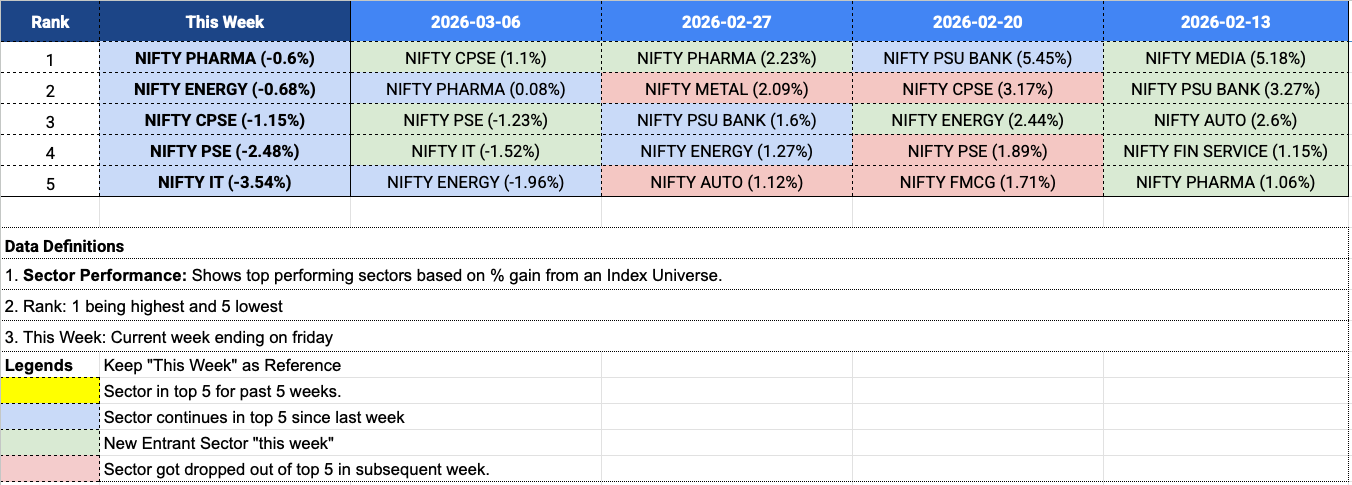
Not a single sector closed in the green this week. The most resilient names were all carryovers from prior weeks: Pharma leading, followed by Energy, CPSE, PSE, and IT — all negative, but less so than the broader market.
Ranges & Expiries
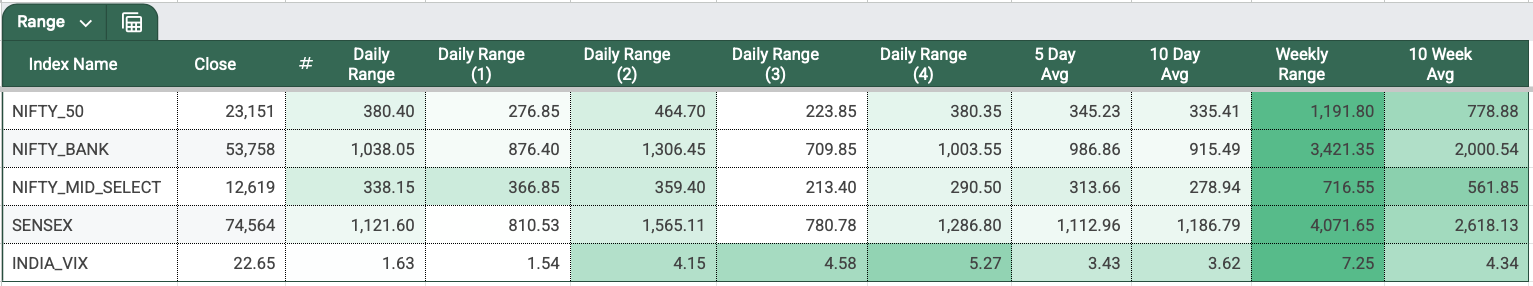
NIFTY’s average daily range expanded further to 345 points , up from 325 last week. Wednesday saw the widest range at 465 points; Monday and Friday both clocked close to 380 points. Moves of around 1% intraday have become the norm over the past few weeks. Wide ranges create trading opportunities — but only for those keeping position sizing firmly in check. This is the environment where trend-following and volatility-based strategies tend to show their best results.
NIFTY Weekly Expiry (10-Mar, Tuesday)
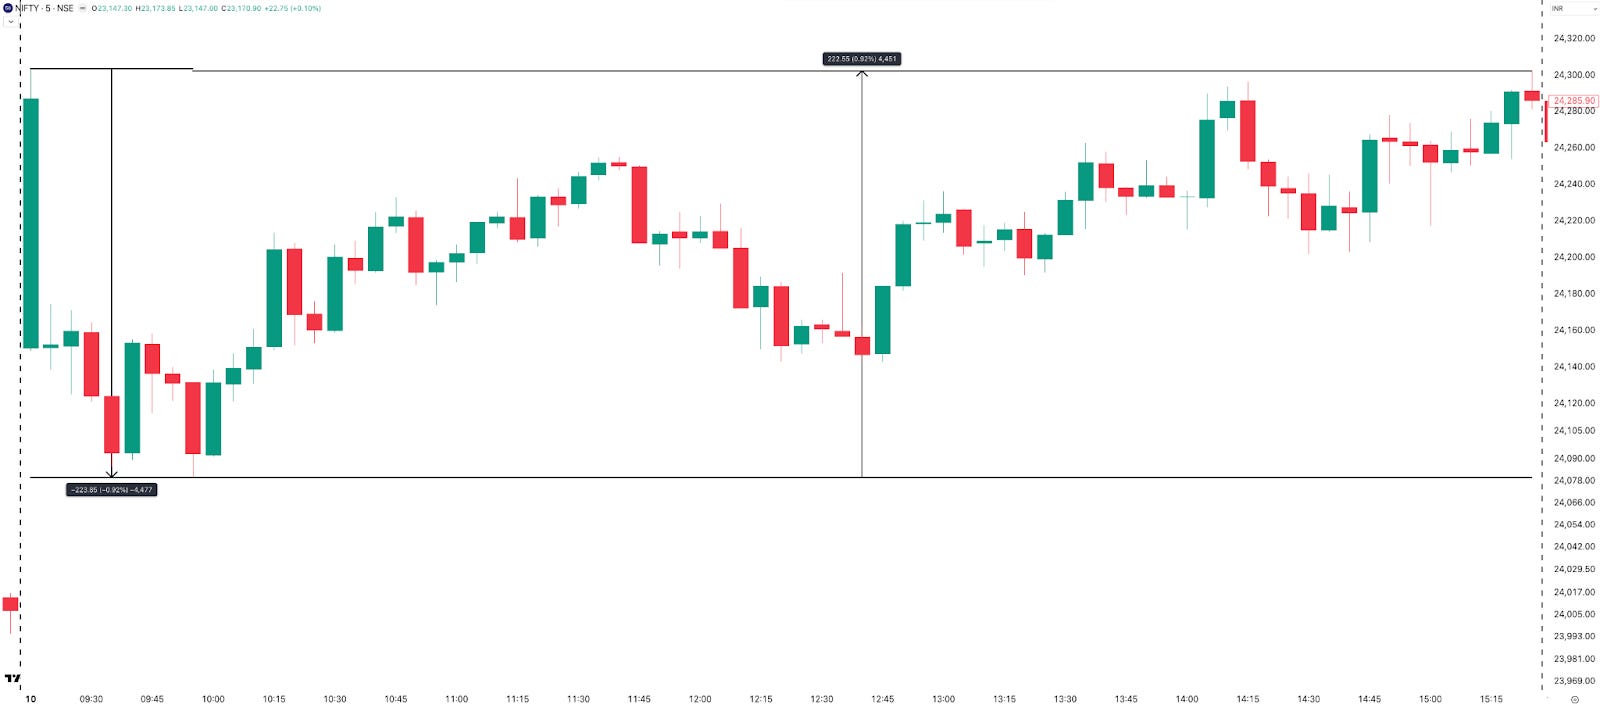
After a 279-point (1.17%) gap-up opening, NIFTY saw selling pressure almost immediately — falling 0.92% from the top in the first 45 minutes, before recovering nearly 0.9% and closing the day up 0.97%. Outside the initial burst of volatility, the session was relatively manageable for straddle and strangle traders, with the ATM straddle opening around 202 points. The overnight crush over the past couple of weeks has been substantial — on expiry day, the overnight premium decay exceeded 150 points, highlighting the risk premium option writers are demanding to hold positions overnight.
SENSEX Weekly Expiry (12-Mar, Thursday)
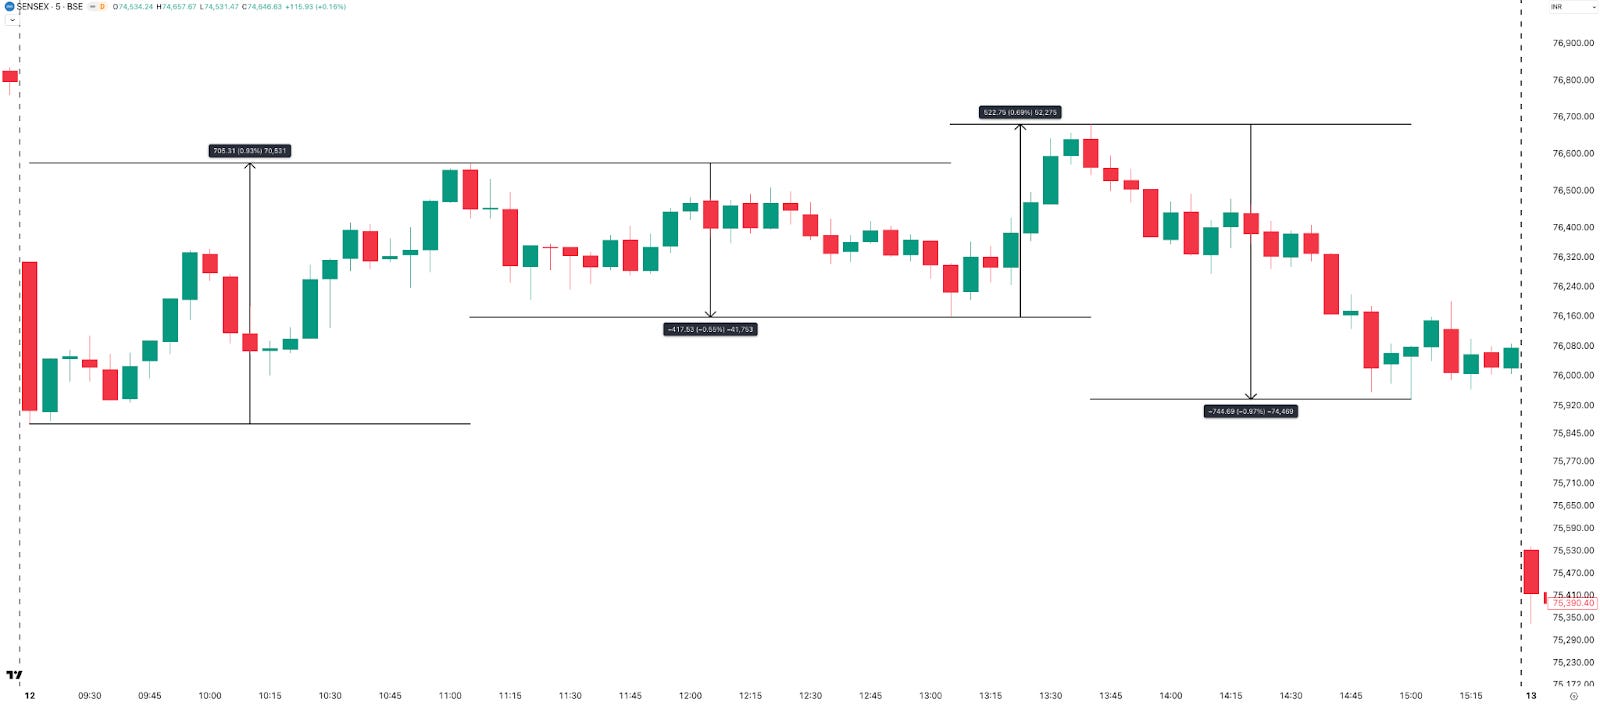
A difficult day to navigate. After a 0.64% gap-down open, SENSEX swung in multiple directions throughout the session: up 0.93% by 11 AM, down 0.55% by 1 PM, up again 0.7% by 1:40 PM, then down nearly 1% into the close. The ATM straddle opened around 575 points, but realizing gains amid the constant reversals was genuinely tough. In high-premium environments like this, even simpler setups may deserve a fresh look.
INDIAVIX
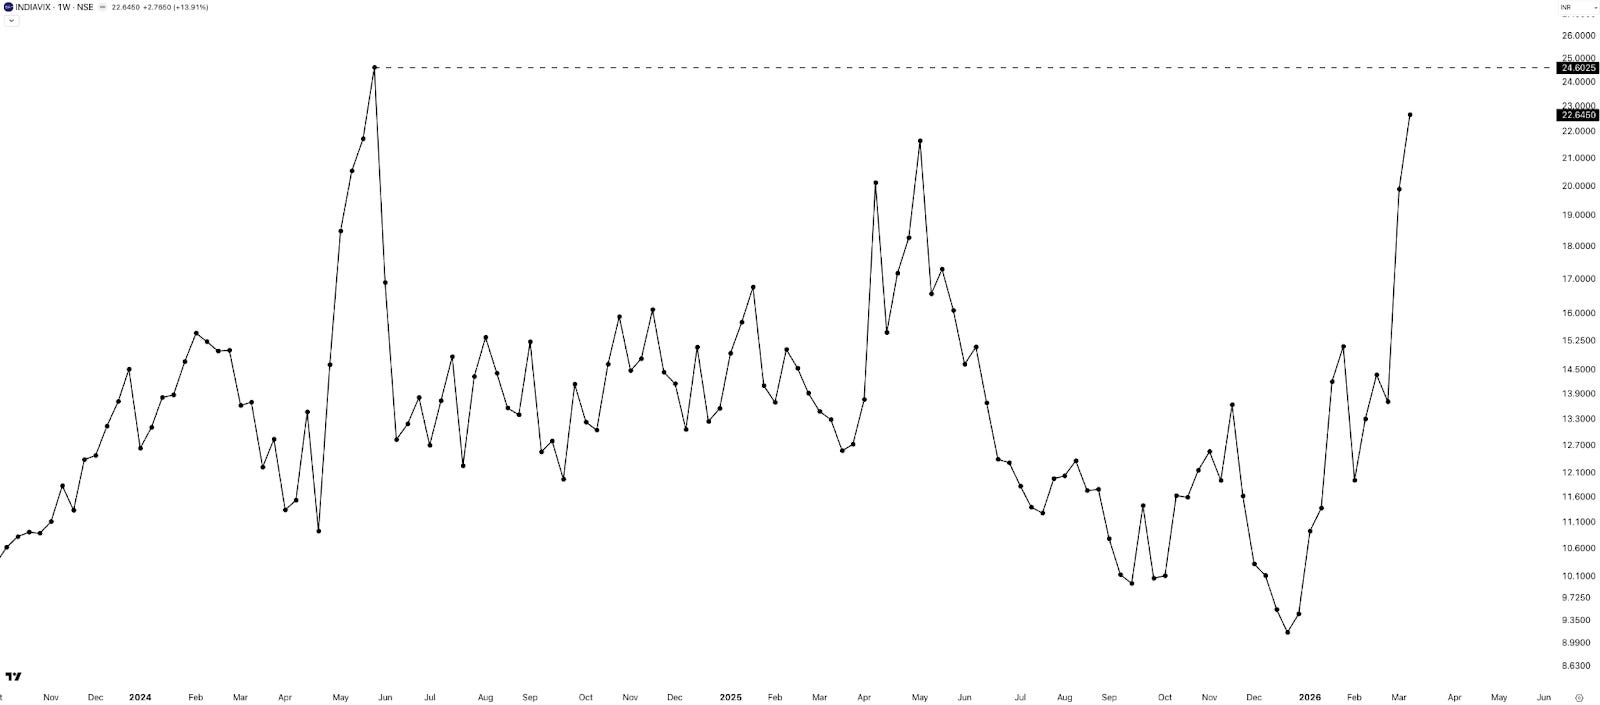
Following last week’s sharp spike, INDIAVIX rose another 14% to close at 22.65 — approaching the levels seen during the 2024 General Election results, when VIX peaked around 24.6.
VIX is mean-reverting in the long run, but the pain comes when it keeps rising before it reverts. There’s no fixed timeline for when that happens. Elevated VIX inflates option premiums, makes backtested strategies feel less reliable in real time, and generally makes trading tougher. It also, eventually, creates some of the best entry points — for those who manage risk and survive the rising-vol phase.
Commodities
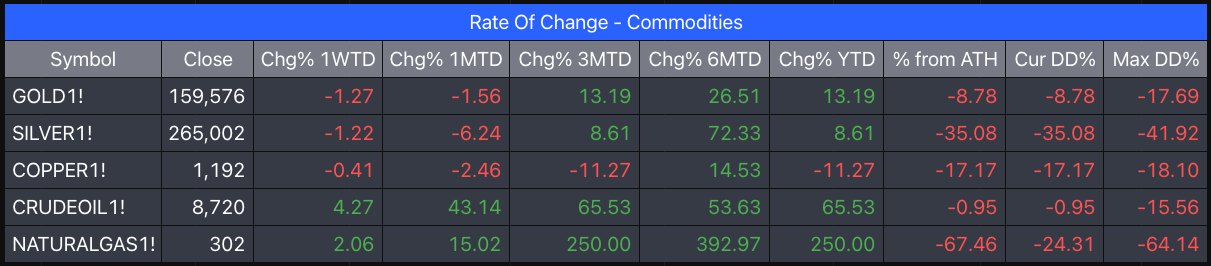
Similar to last week, both equity markets and precious metals fell while energy continued its run.
- Crude Oil: +4.27%
- Natural Gas: +2.00%
- Gold: ~–1%
- Silver: ~–1%
- Copper: flat
The rupee hit a new low of 92.4 against the dollar this week. A weaker rupee compounds the impact of rising crude — India imports roughly 50% of its oil from the Middle East, making a sustained energy rally a direct contributor to a larger import bill, further currency pressure, and rising inflation.
For an explainer of sorts on what Crude is and how it is connected with Natural Gas and the India story you may want to watch this daily brief episode.

Summary
Week 11 saw the sell-off deepen sharply. BANKNIFTY led with nearly 7% down, followed by SENSEX (–5.5%), NIFTY (–5.3%), and MIDCPNIFTY (~–4.2%). NIFTY’s weekly fall was the largest since June 2022, underscoring the intensity of the decline.
Volatility expanded further — wider daily ranges, sharp intraday swings, and indices staying well below key moving averages. Not a single sector closed in the green, reflecting broad-based weakness. INDIAVIX rose to 22.65, keeping option premiums elevated across the board.
The structure remains firmly bearish — rising volatility, weak breadth, and every rally getting sold into.
What Caught Our Attention This Week
1. Why Europe Doesn’t Have a Tesla — Pieter Garicano A blog post on Works in Progress examining the structural and institutional reasons behind Europe’s failure to produce a Tesla-scale EV company. There may be lessons in there that translate beyond Europe. Read here →
2. How to Deal with Uncertainty — Matt Davella Emmy-nominated filmmaker Matt Davella made this video during COVID about preparing for and living through uncertainty. Highly relevant in the current market context. Watch here →
What to Expect Next Week
Next week is a full five-day trading week with no major scheduled events on the calendar.
The markets remain in a difficult place. “Invest when there is blood on the streets” — but what if the blood is our own? These are the moments that test both conviction and temperament. Seasons change, though. There is spring after winter. Keep SIPs and long-term investments going — and stay steady.
If you find this series useful, don’t forget to subscribe to the newsletter.
Until then — stay curious, stay steady, and enjoy your weekend.