Welcome to another edition of Weekly Market Metrics. I am Sandeep Rao.

We’re in Week 12 of 2026, and after three consecutive weeks of sharp declines, markets appeared to have found a base — until Thursday. Out of nowhere came news of HDFC Bank’s Chairman’s resignation, the stock cracked 5%, and it dragged the indices down with it. Despite all that drama, most indices ended the week essentially flat. For index investors still on the sidelines, this pullback offers a reasonable opportunity to start nibbling in.
NIFTY
Weekly
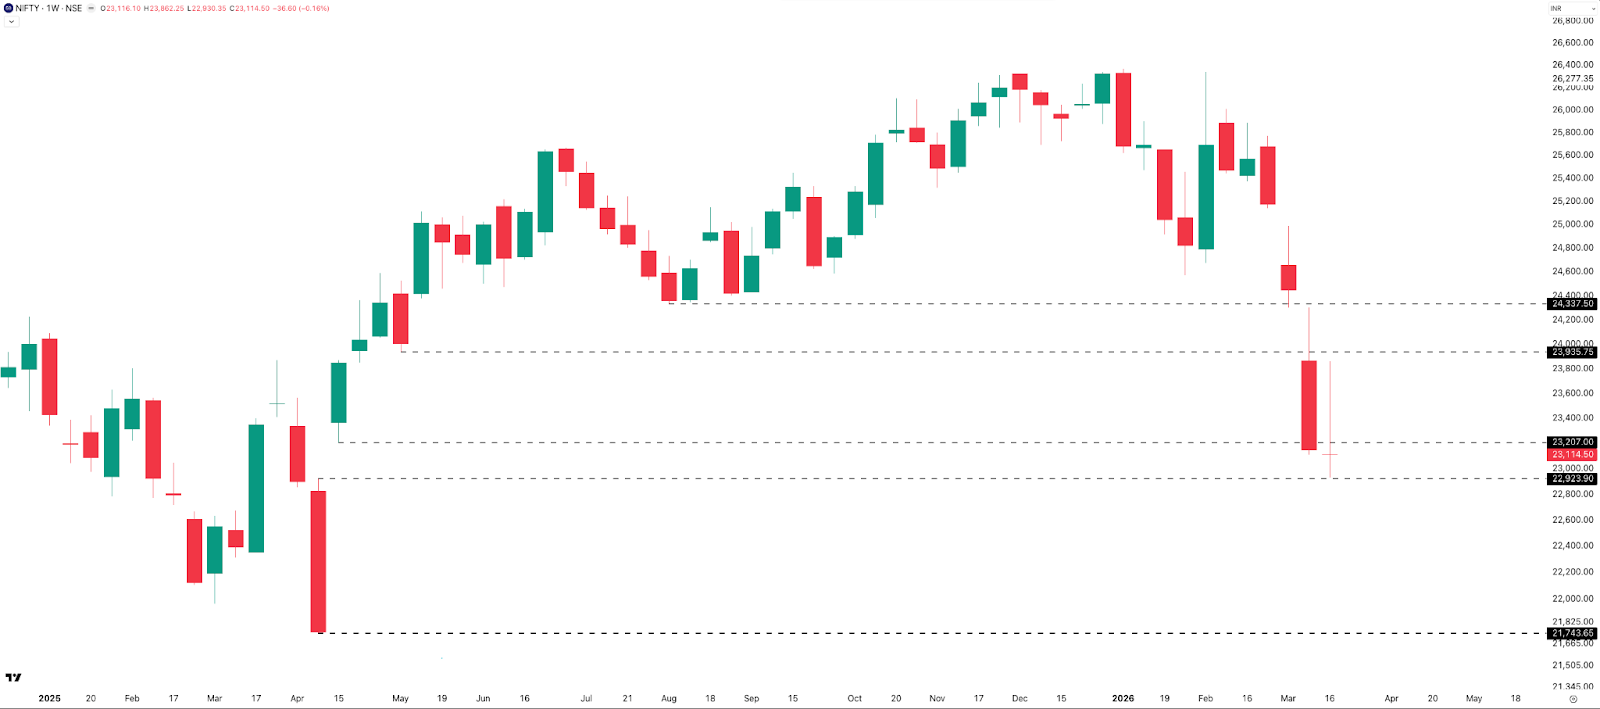
NIFTY closed the week almost exactly where it opened — losing just 37 points (–0.16%) to close at 23,114 . That flat close masks what was a turbulent week underneath: a high of 23,862 and a low of 22,930, a weekly range of 932 points (~4%) .
The 22,900 support level flagged last week held almost perfectly, with NIFTY bottoming at 22,930 before pulling back. Support continues at 22,900 , followed by 21,750 . Resistance sits in the 23,900–24,000 zone, then at 24,350 . The bias for the coming week remains bearish to sideways — with sharp moves possible in either direction depending on developments in the US–Israel–Iran situation.
Daily
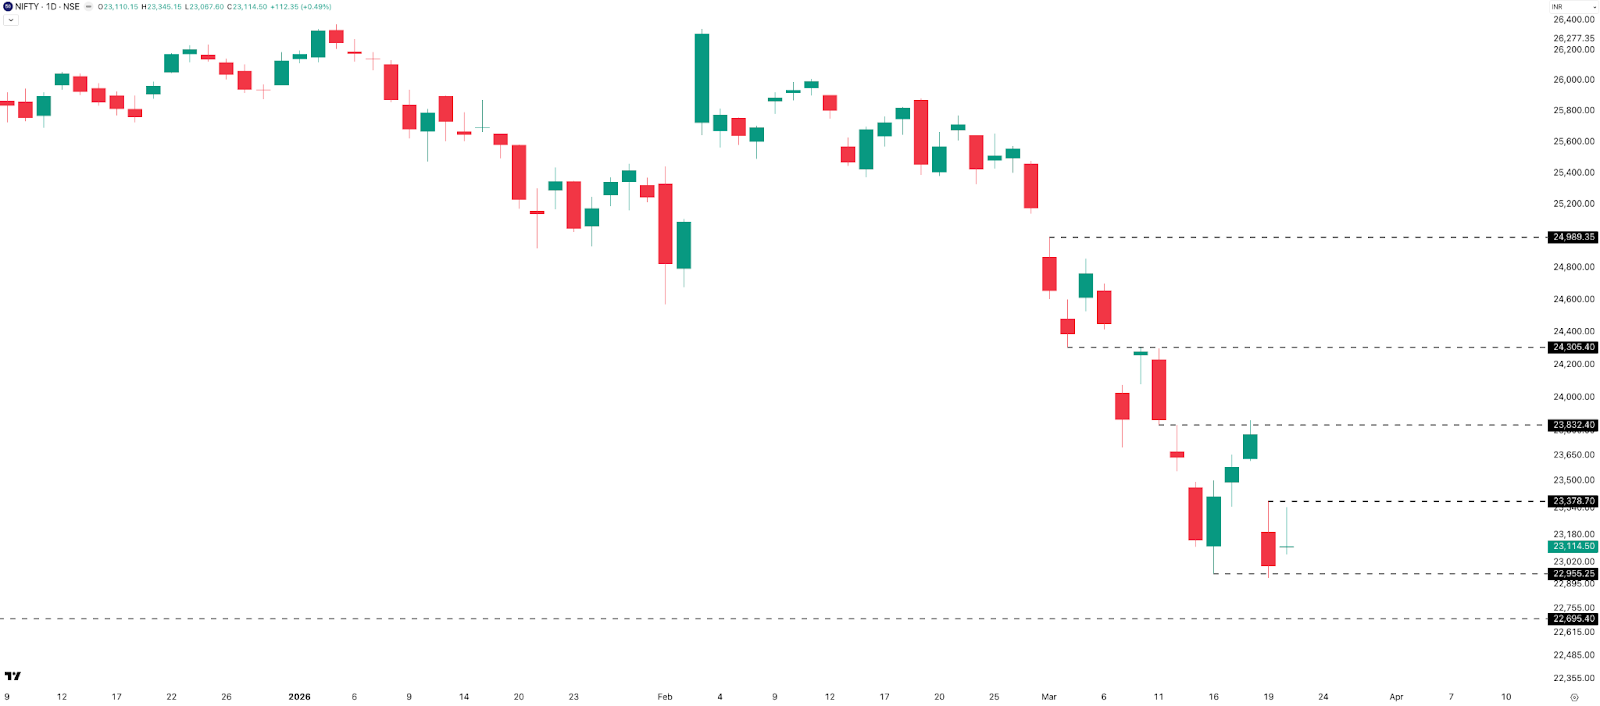
Three green candles to start the week gave bulls some cause for optimism. Then Thursday arrived: a 580-point (2.5%) gap-down, a breach of 23,000, a new weekly low at 22,930, and a close of –3.36% — the largest single-day decline since the 2024 General Election result day on 4 June 2024, when the market fell 5.93%.
That was 1 year and 9 months ago. Friday partially recovered, closing up ~0.5% on a gap-up open.
This kind of price action makes one thing clear: lower timeframe analysis loses reliability in these conditions. Higher timeframes and key support/resistance levels are the more useful anchors. Daily supports: 22,900 and 22,700 . Resistances: 23,400 , 23,850 , and the 24,300 zone.
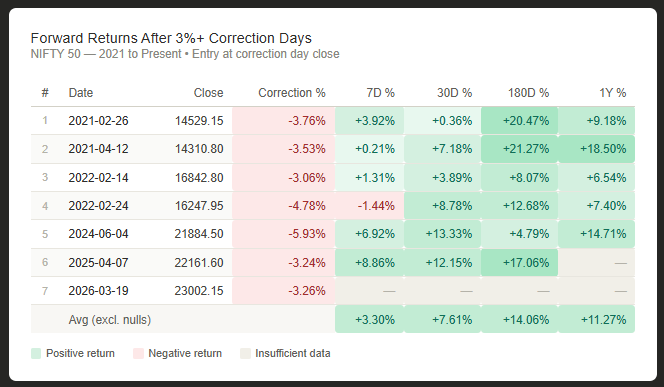
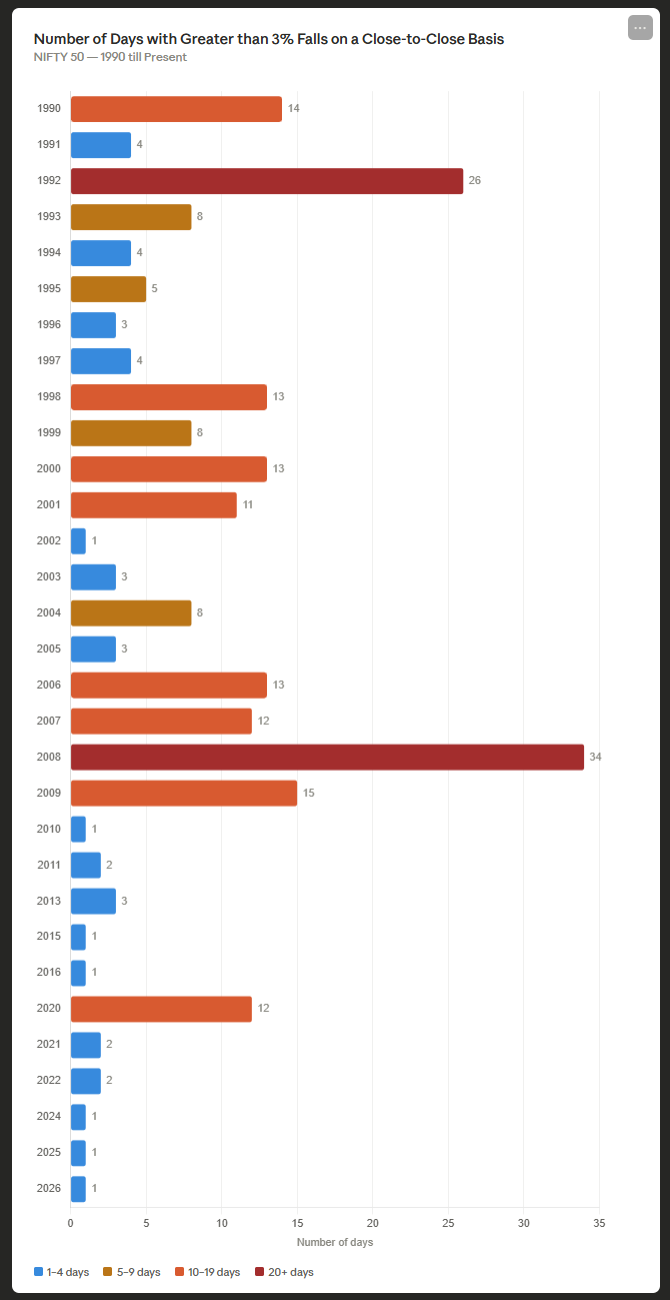
A quick look at history puts the Thursday move in context. A –3% daily close was relatively common pre-2009, but the era of quantitative easing largely suppressed such moves — barring 2020. Looking at forward returns after similar –3%+ days in NIFTY data: outcomes are broadly positive most of the time at the 6-month and 1-year marks. The sample size is small, and this year could yet be an exception — but the historical base rate is reassuring.
Hourly
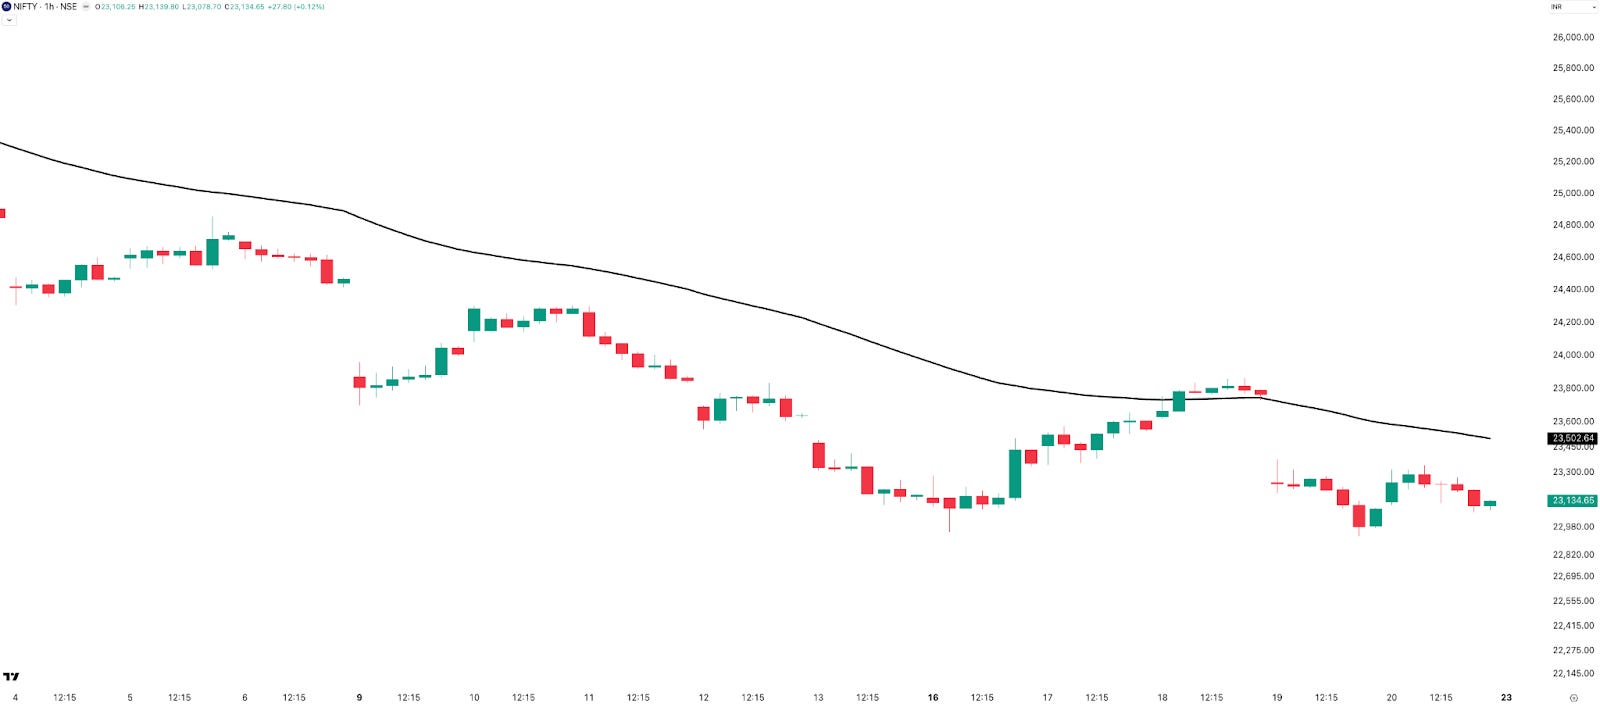
The hourly downtrend that began on 25 February finally ended on Wednesday — after nearly three weeks, one of the longest sustained hourly downtrends in recent memory. Thursday’s gap-down erased a portion of those gains, and price is once again sitting well below the 50 EMA, keeping the short-term structure weak.
Range Till Expiry (24-Mar, Tuesday)

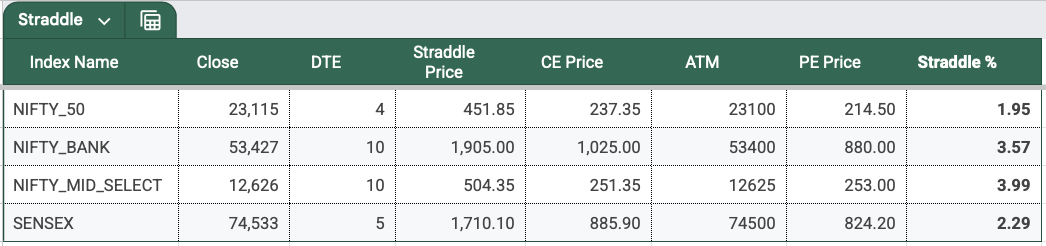
NIFTY’s 1DTE ATM straddle premium closed at 452 points — down 48 points from last week’s 500 — implying approximately a 1.95% move on either side.
Expected expiry range: 23,567 on the upside | 22,663 on the downside — a roughly 900-point band priced in across the weekend and two trading days.
Open Interest
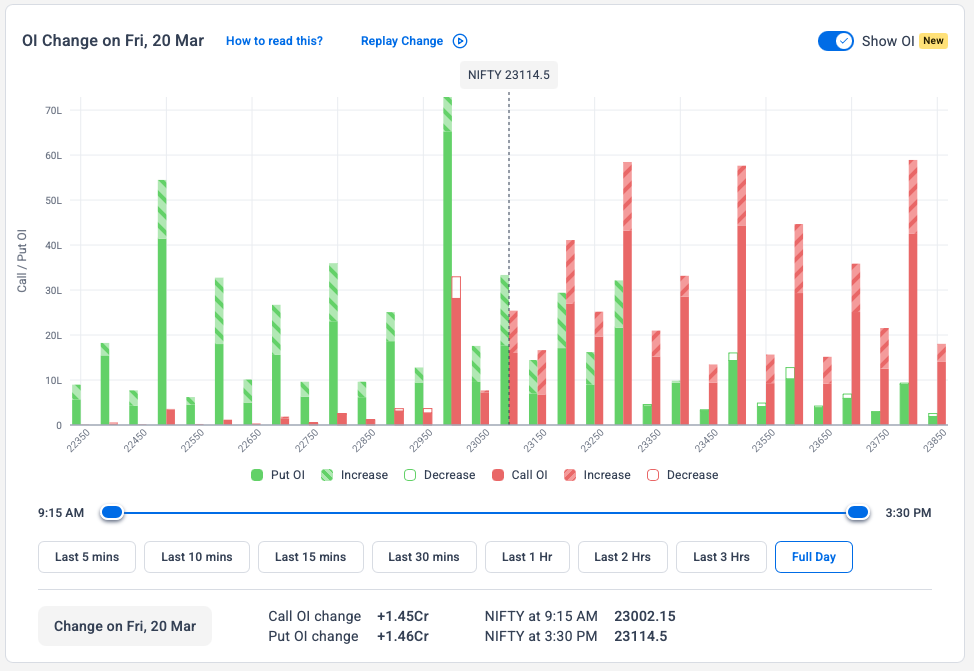
The 23,000 PE has the highest open interest on the put side. On the call side, 23,300 , 23,500 , and 23,800 CE strikes stand out. As with last week, PE OI exceeds CE OI — suggesting the street expects the market to hold above 23,000. The 23,000–22,900 zone continues to emerge as the key support area.
SENSEX
Weekly
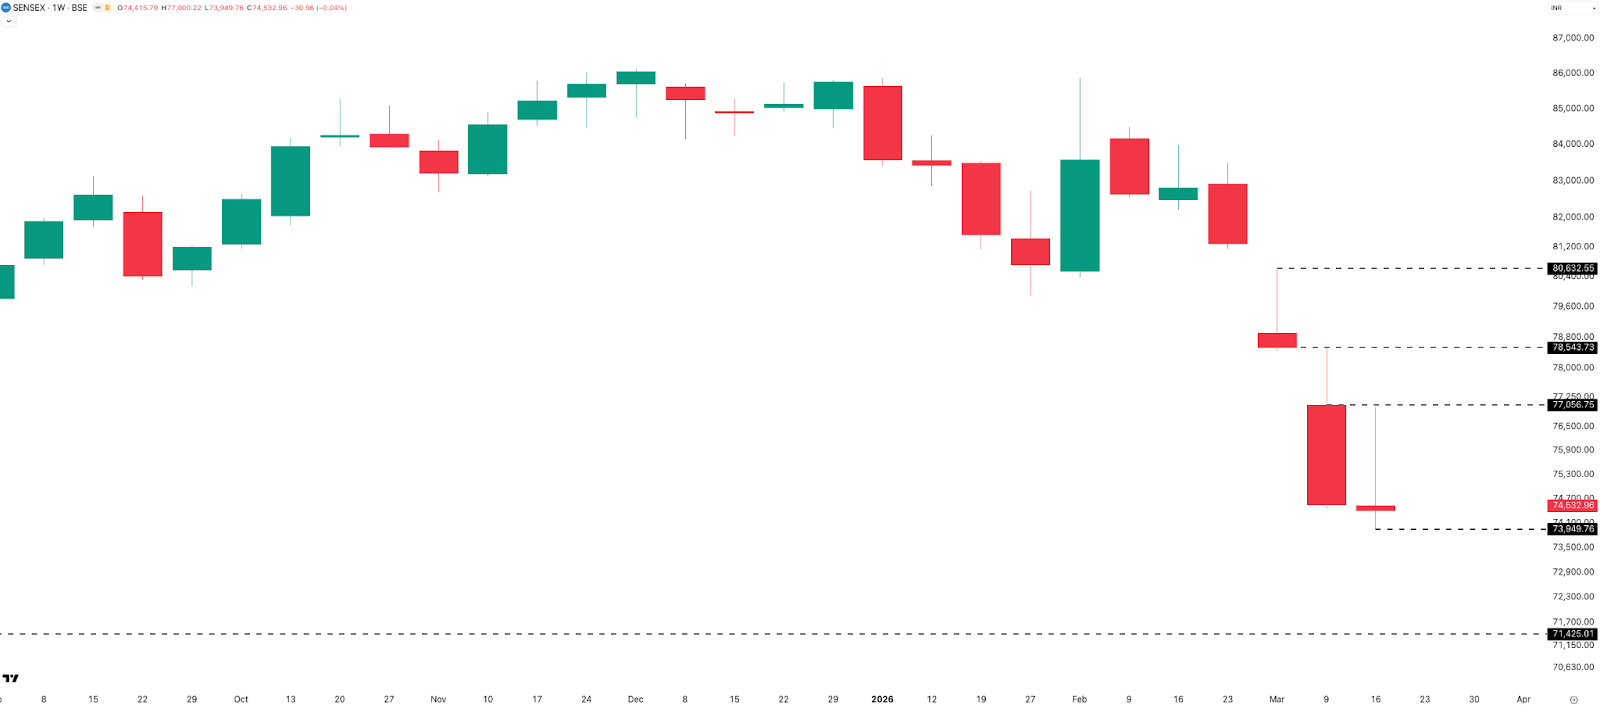
SENSEX lost just 31 points (–0.04%) to close at 74,532 — essentially flat. The weekly candle formed a tall upper wick, pointing to selling pressure near 77,000 , which remains key resistance, followed by 78,500 . Downside support sits near the weekly low of 73,900 . View for the coming week: bearish to sideways, in line with NIFTY.
Daily
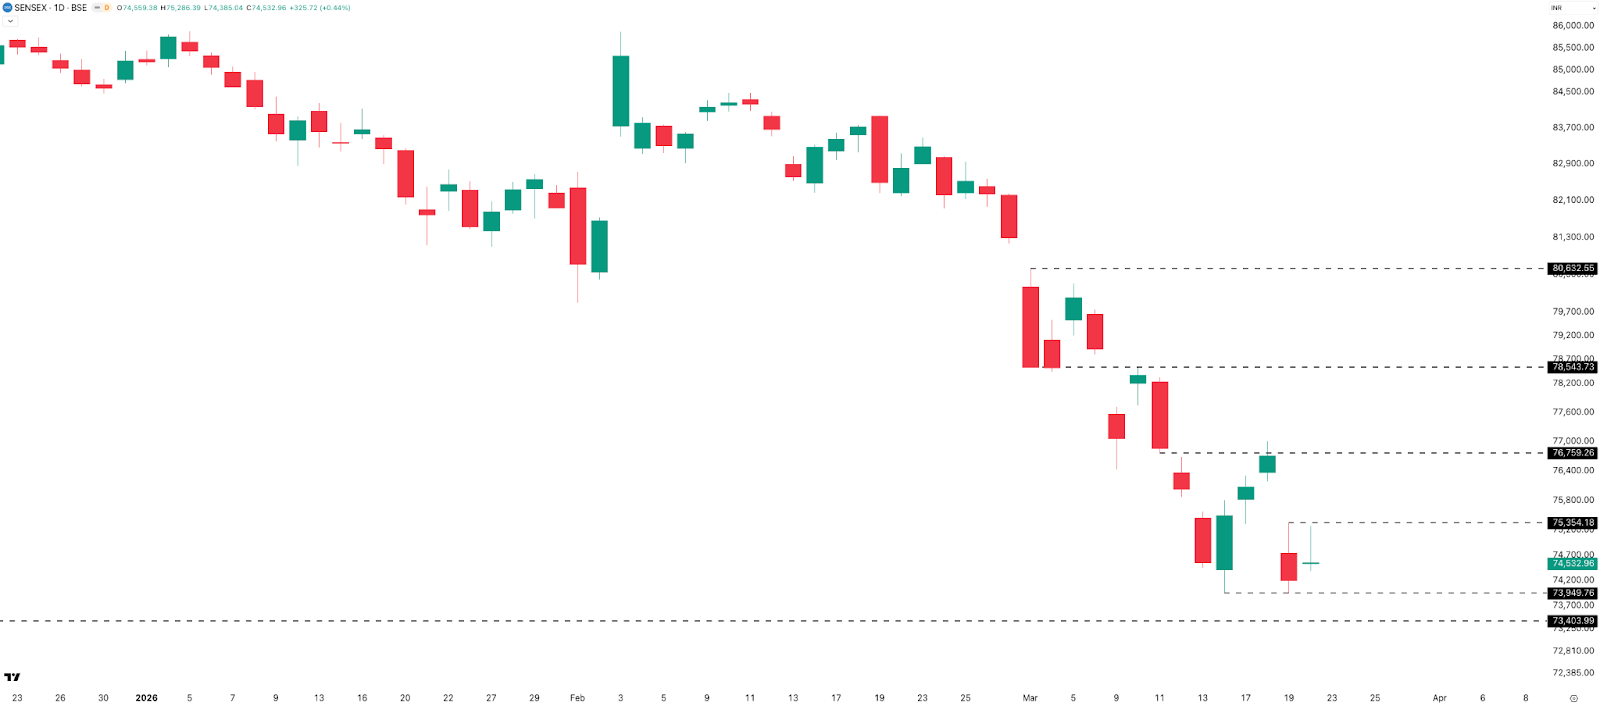
Similar pattern to NIFTY — three green candles, then a sharp –3.26% fall on Thursday, and a relatively quiet Friday. Supports: 73,900 and 73,400 . Resistances: 75,350 and 76,750 .
Range Till Expiry (25-Mar, Wednesday)
Note: The SENSEX expiry shifts from its usual Thursday to Wednesday, 25 March , as Thursday, 26 March is a holiday on account of Shri Ram Navami. This creates back-to-back expiries — NIFTY on Tuesday, SENSEX on Wednesday.
ATM straddle closed at 1,710 points — down 368 points from last week’s 2,078 — implying a 2.29% move on either side.
Expected expiry range: 76,243 on the upside | 72,823 on the downside — broadly 72,800–76,250 .
BANKNIFTY
Daily
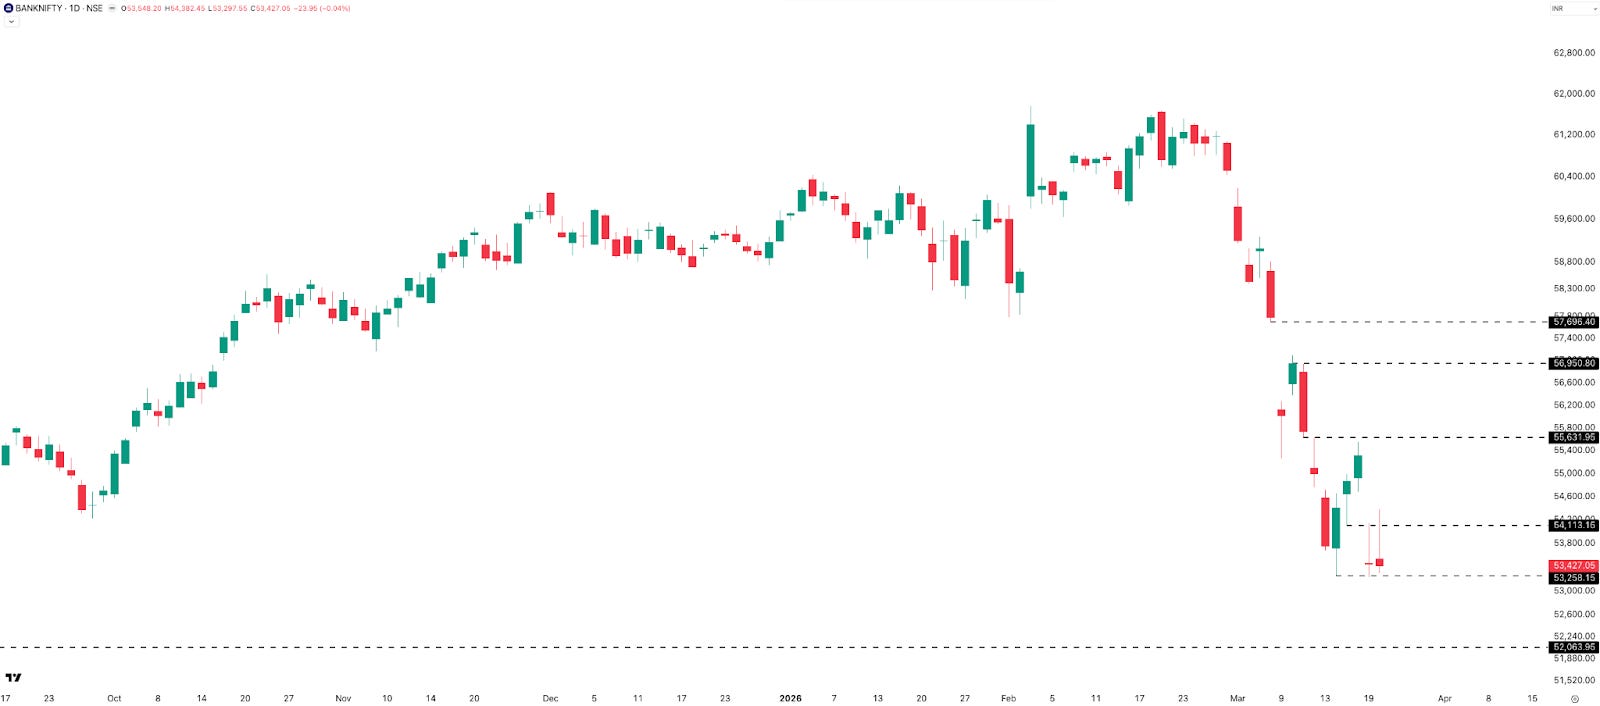
Thursday’s 3.35% gap-down in BANKNIFTY was driven almost entirely by HDFC Bank’s chairman exit amid ethical concerns. For the week, BANKNIFTY lost 331 points (–0.62%) to close at 53,427 , with a weekly range of 2,313 points (4.16%) — lower than last week but still reflecting elevated volatility.
Supports: 53,250 (this week’s low), then 52,000 . Resistances: 54,100 , 55,650 , 56,950 . The overall view remains bearish, heavily influenced by the overhang around HDFC Bank.
Hourly
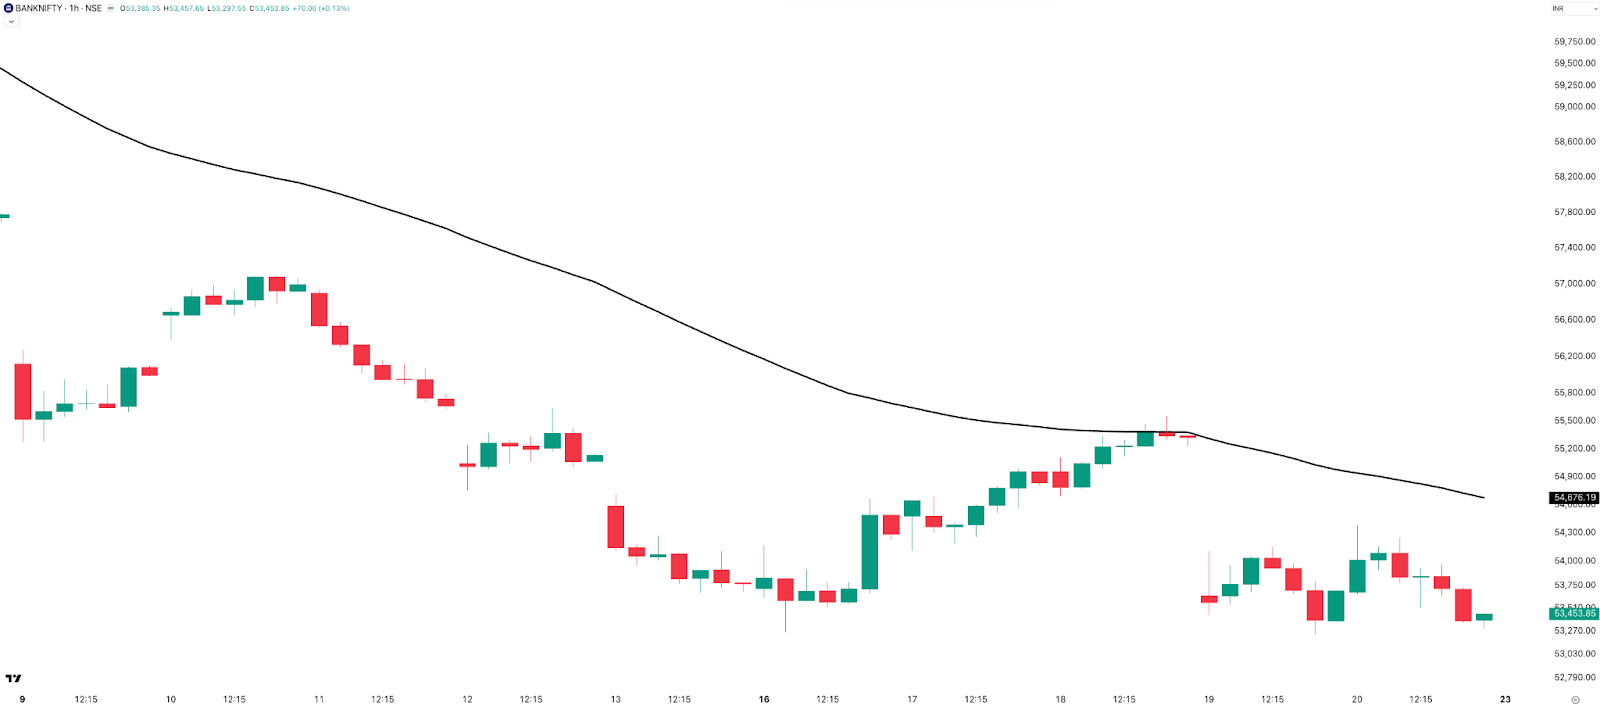
The downtrend that began in the last week of February ended on Wednesday — a move covering over 5,000 points, one of the largest sustained directional moves on the hourly chart in a long time. Thursday’s gap-down pushed price back below the 50 EMA. The key question now: does a new trend develop from here, or does the index enter a choppy consolidation phase after such an extended directional run?
Rate of Change (ROC) — Weekly Snapshot
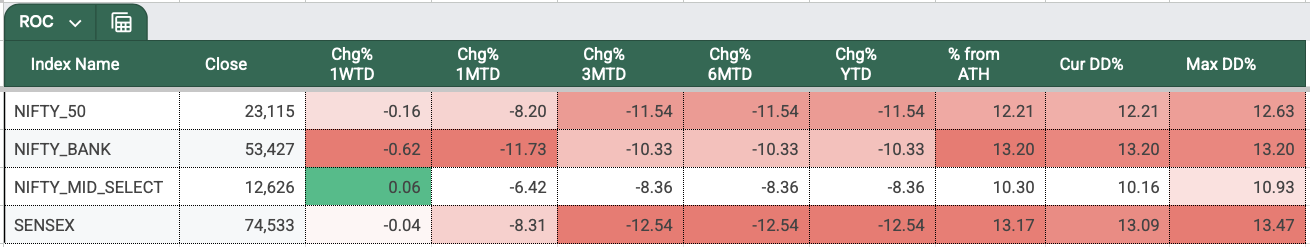
The red is lightening. BANKNIFTY led losses at –0.62% , followed by NIFTY at –0.16% and SENSEX at –0.04% . MIDCPNIFTY ended marginally positive at +0.06% — effectively flat.
Year-to-date: SENSEX –12.54% , NIFTY –11.54% , BANKNIFTY –10.33% , MIDCPNIFTY –8.36% . At this pace, March 2026 is on track to be one of the worst March months since 2020.
Sectors
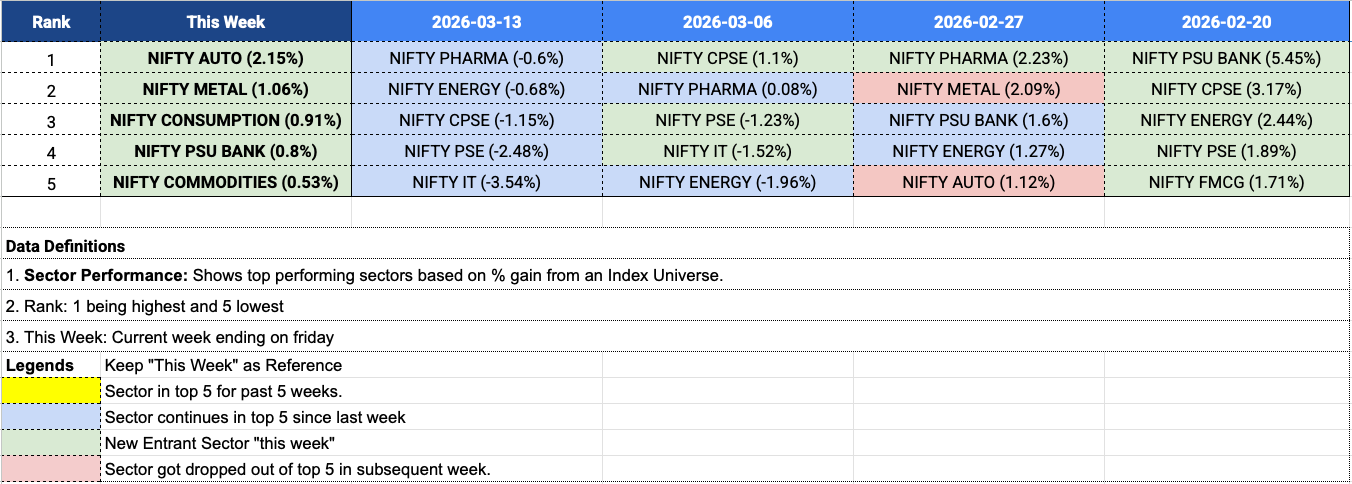
An entirely new top-five this week: Auto (+2.15%) led, followed by Metal (+1.06%) , Consumption (+0.91%) , PSU Bank (+0.80%) , and Commodities (+0.53%) . Pharma, which had been a consistent outperformer, stepped back this week. Auto, PSU Banks, and Metals have reappeared — worth watching if this rotation continues.
Ranges & Expiries
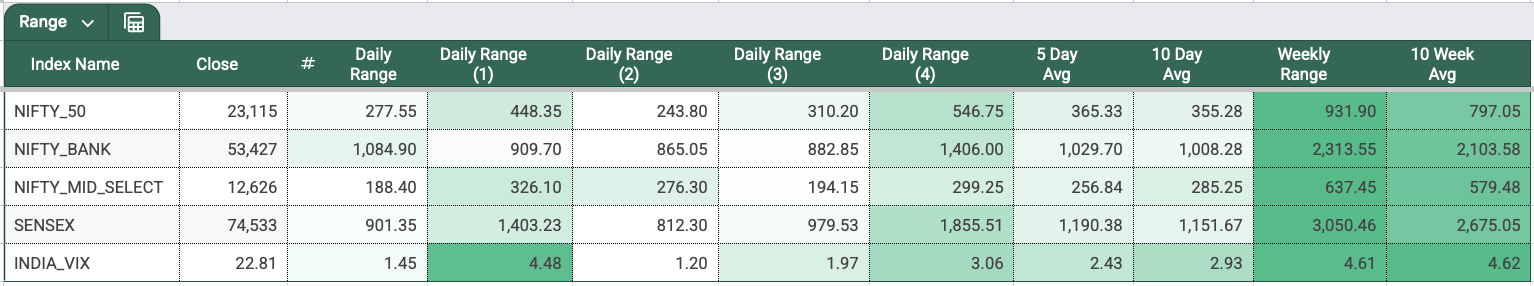
NIFTY’s 5-day average daily range rose further to 365 points , up from 345 last week. All five sessions this week saw ranges exceeding 1%, with Monday recording the highest at 2.38% , followed by Thursday at 1.92% . Notably, Thursday’s massive daily fall came largely via an overnight gap — meaning Monday, not Thursday, actually produced the widest intraday range.
NIFTY Weekly Expiry (17-Mar, Tuesday)
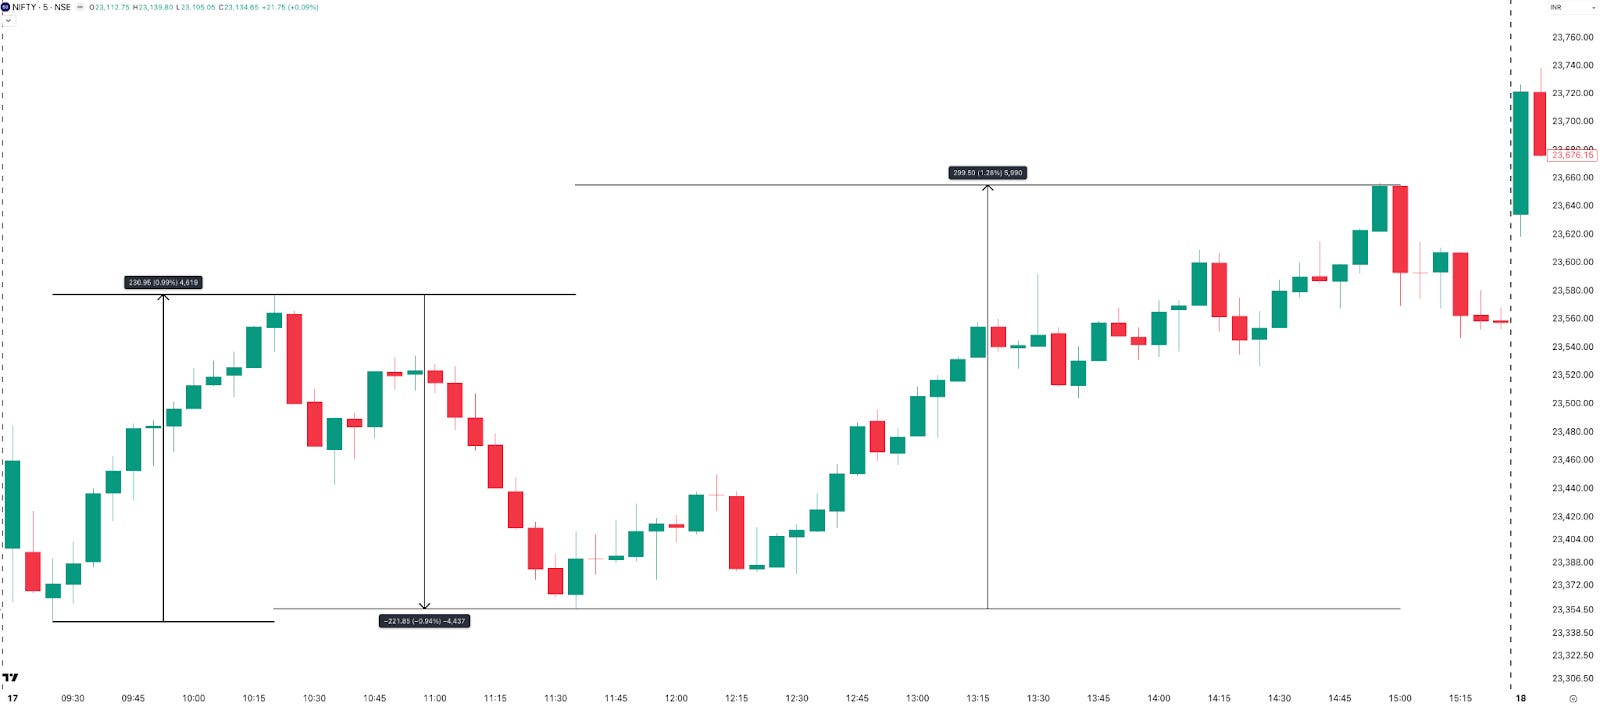
After an 84-point gap-up open, NIFTY trended higher through the day with one notable 221-point pullback between 10:20 and 11:35 AM. The index had already moved 230 points before that pullback, then rallied another 300 points to break the day’s high, closing at 23,581 (+0.74%). The ATM straddle opened at just 170 points — a relatively easy day for sellers, particularly those who built positions early.
SENSEX Weekly Expiry (19-Mar, Thursday)
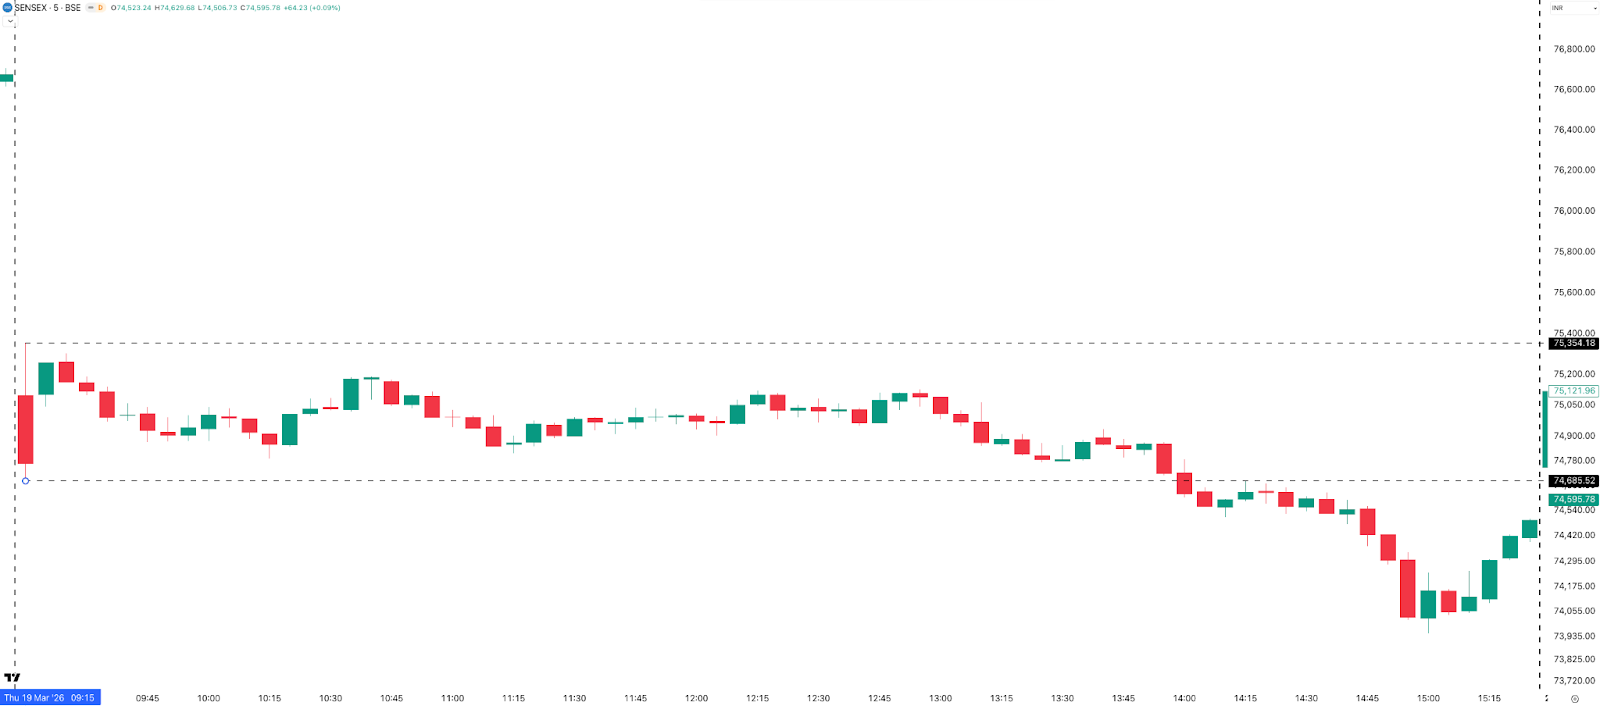
A much tougher session. SENSEX gapped down 1,953 points (2.55%) at the open, with straddle premiums around 600 points — elevated, but not nearly enough to reflect the scale of the gap. The high and low of the first 1-minute candle held until 2 PM — and that first candle’s range alone was 668 points, wider than the straddle premium at open. Post 2 PM, the index dropped 735 points then recovered 550. Unless positioned after 2 PM, making money on 0DTE options would have been very difficult.
INDIAVIX
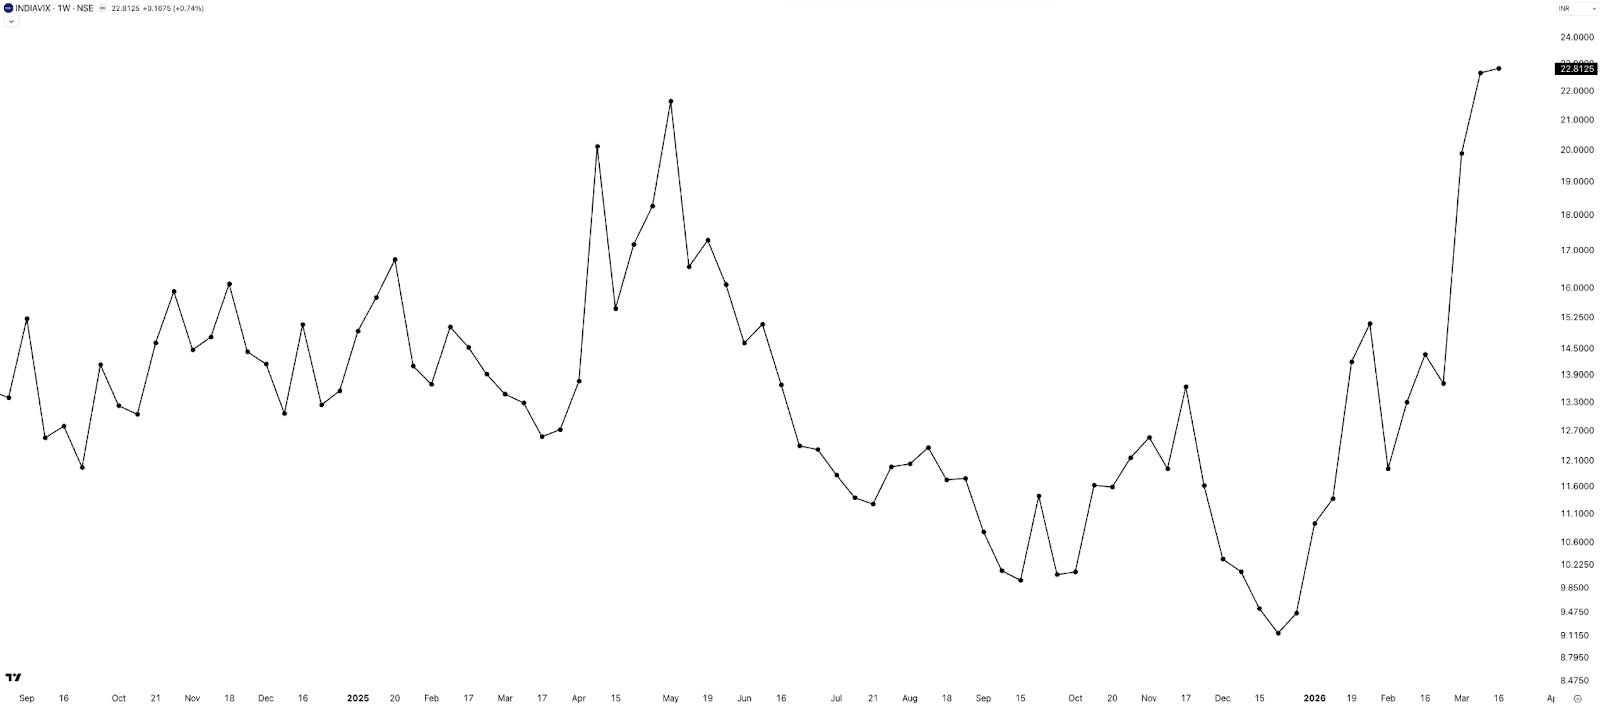
Moving to INDIAVIX for the week.
INDIAVIX edged up another 0.74% to close at 22.81 — continuing its week-on-week climb. Elevated volatility is uncomfortable, particularly since it tends to accompany falling markets. But it’s also the phase that historically offers some of the best entry points for both traders and investors. This too shall pass, and volatility will revert to the mean — as it always has.
Commodities
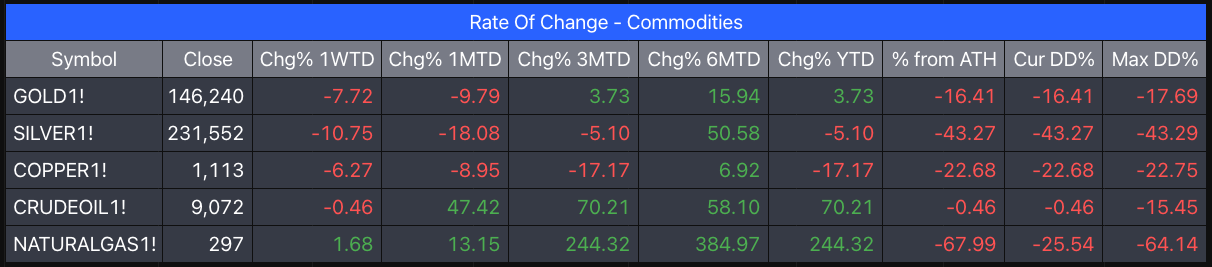
A notable week for precious metals — not in a good way. Despite equity markets ending flat, gold and silver both fell sharply. Theory says gold acts as a hedge; it does most of the time, but not always, and this week was a reminder of that.
- Silver: –10.75%
- Gold: –7.72%
- Copper: –6.27%
- Crude Oil: flat
- Natural Gas: flat
Summary
Week 12 saw markets pause after three brutal down weeks, with indices closing largely flat — but with substantial intraday volatility underneath. Sectorally, leadership rotated toward Auto, Metals, and PSU Banks, while Pharma cooled off. INDIAVIX stayed elevated, keeping option premiums high. Precious metals saw sharp corrections despite the equity market stabilising.
The structure remains bearish to sideways , with markets trying to find a base but still reacting sharply to news flow.
What Caught Our Attention This Week
1. “India Built the World’s Back Office. A.I. Is Starting to Shrink It.” — The New York Times India’s IT and BPO sector is a $300 billion industry employing over six million people — built over 25 years on cost-effective, English-speaking white-collar labour. AI agents that can code, handle customer service, and manage HR tasks at a fraction of the cost are now a genuine threat to that model. Worth reading for the perspective it offers on structural risk. Read here →
2. How Laws of Thermodynamics Govern Our Life — Krish Ashok A characteristically nerdy and enjoyable video exploring how fundamental physics shapes everyday life. Recommended if you enjoy that kind of rabbit hole. Watch here →
3. A Meme Worth Sitting With A sharp, wordless reminder that no matter how carefully you plan, something small and unforeseeable can upend everything. Pairs well with the old saying: if you want to make God laugh, tell him about your plans. View here →
What to Expect Next Week
Next week is a four-day trading week — Thursday, 26 March is a holiday on account of Shri Ram Navami. The SENSEX expiry shifts to Wednesday, creating back-to-back expiries: NIFTY on Tuesday (24th) and SENSEX on Wednesday (25th). No major scheduled events on the calendar.
Markets look likely to consolidate and chop at these levels for a while. For index investors, the long-term thesis remains intact. The arc of index investing is long — but it bends upward.
One last note: this weekend marks six years since 23 March 2020, the day NIFTY closed –12%. A date worth remembering — not just for the market context, but as a reminder of how fragile things can be, and how a single microscopic entity can alter the course of history. Lest we forget.
With that, we wrap up this week’s Weekly Market Metrics.
If you find this series useful, don’t forget to subscribe to the channel - and yes do share it with your friends.
Until then — stay curious, stay steady, and enjoy your weekend.