Welcome to another edition of Weekly Market Metrics. I am Sandeep Rao.
We are in Week 13 of 2026, and the streak continues. Five consecutive red weeks on NIFTY. The weather isn’t helping the mood either — near heat-wave conditions across several parts of the country, and it’s only March.
General sentiment around the war appears to be slowly improving, with most analysts watching for some form of ceasefire signal. The markets, however, aren’t listening. The same pattern plays out every week: pullbacks sharp enough to make it feel like bottom ban gaya — and then another leg down that erases those gains just as quickly.
The coming week is also packed with important deadlines and market structure changes — make sure you don’t skip the closing section.
NIFTY
Weekly
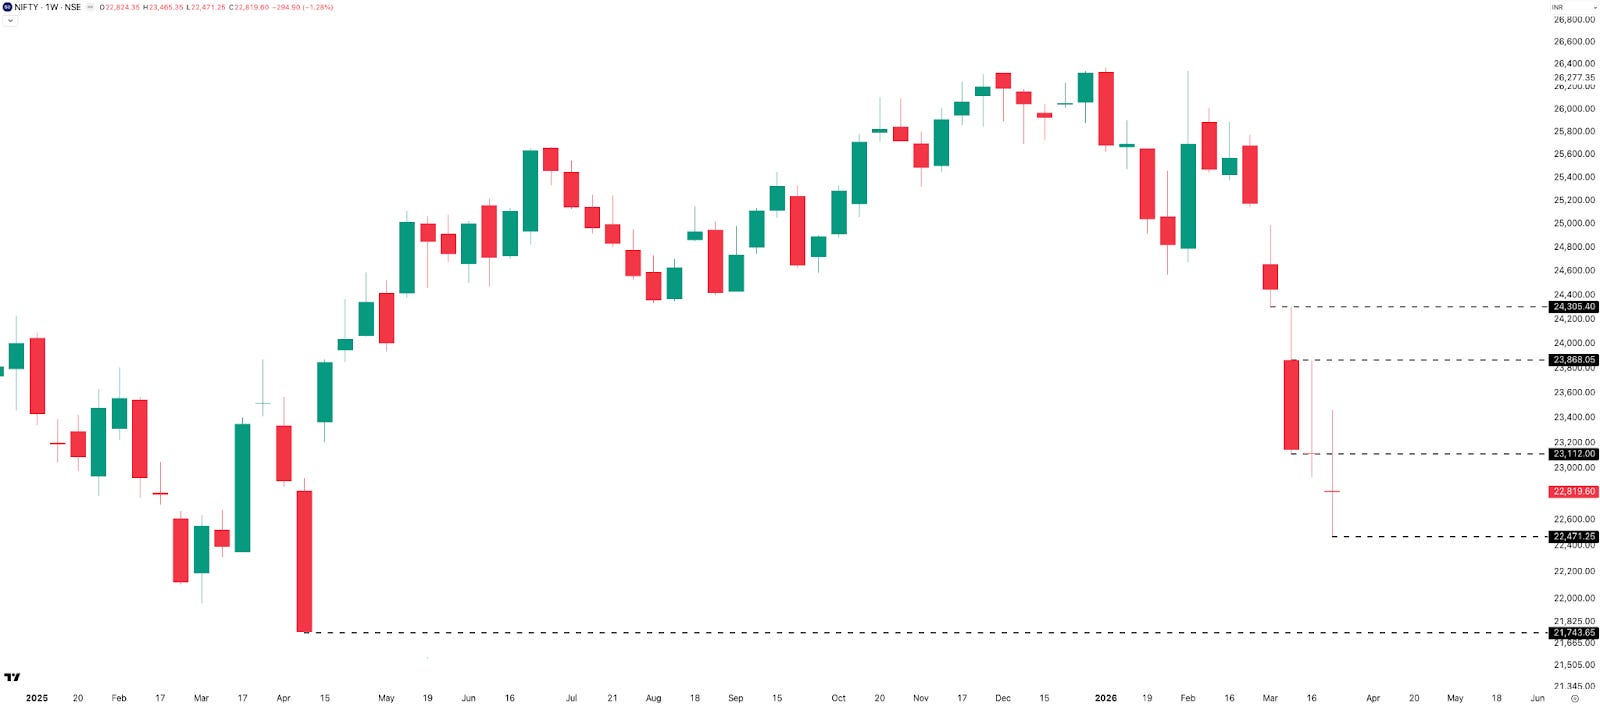
NIFTY made a ~1,000-point (4.25%) range this week, touching a high of 23,465 and a low of 22,471, before closing at 22,820 — down 295 points (–1.28%) from last week’s close. The pattern remains unchanged: sharp pullbacks that feel like bottoms, followed by another leg lower.
Resistance sits at 23,100 , followed by 23,850 . Support is at this week’s low of 22,470 , then 21,750 . The bias for the coming week remains bearish to sideways — unless DJT thinks otherwise.
Daily
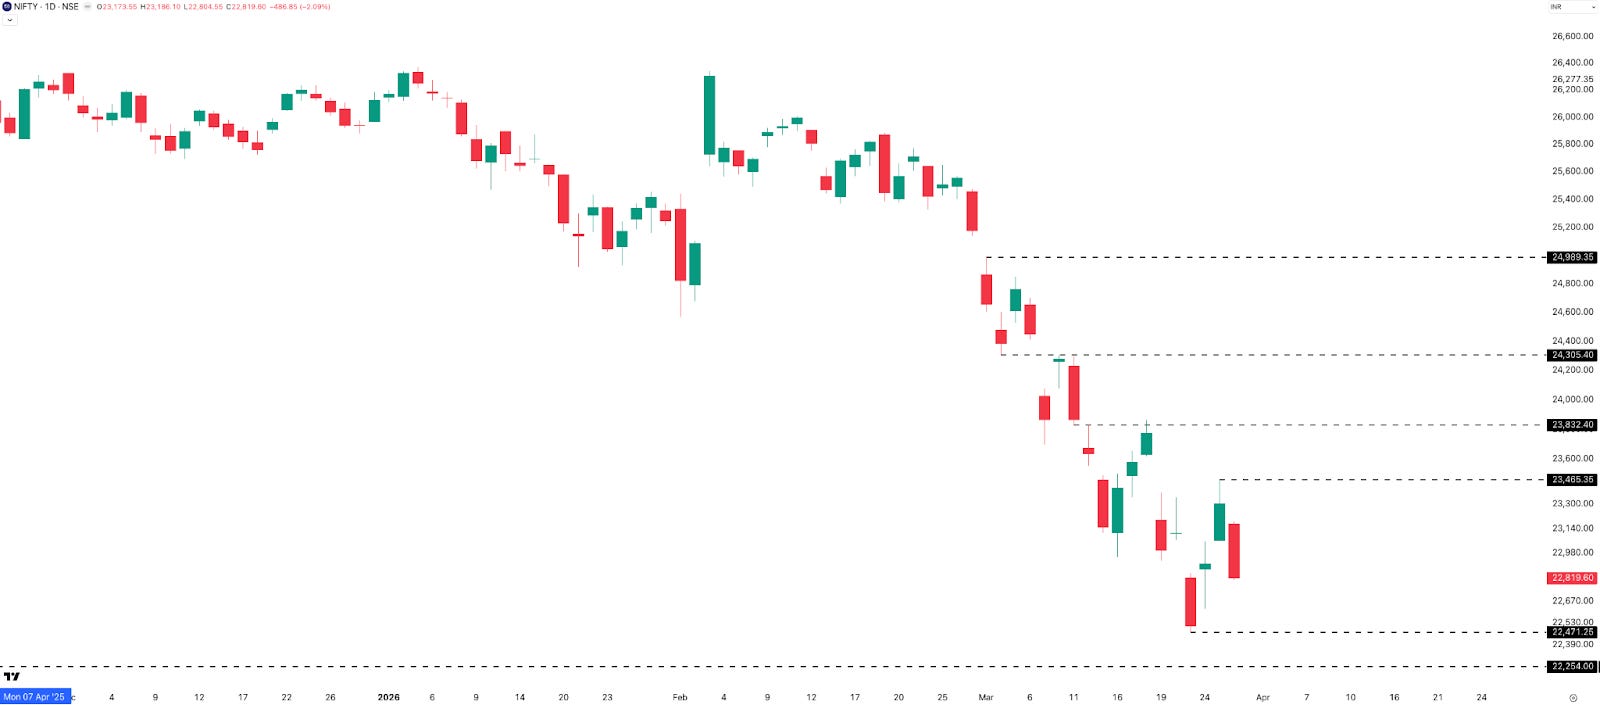
Monday and Friday were red days; Tuesday and Wednesday were green, posting decent up moves of 1.78% and 1.72% respectively. Friday then undid most of that with a gap-down and follow-through selling — the same script as recent weeks. In conditions like these, support and resistance levels are less reliable as anchors than usual. Based on recent price action: resistance at 23,465 and 23,850 ; support at 22,470 and 22,250 .
Hourly
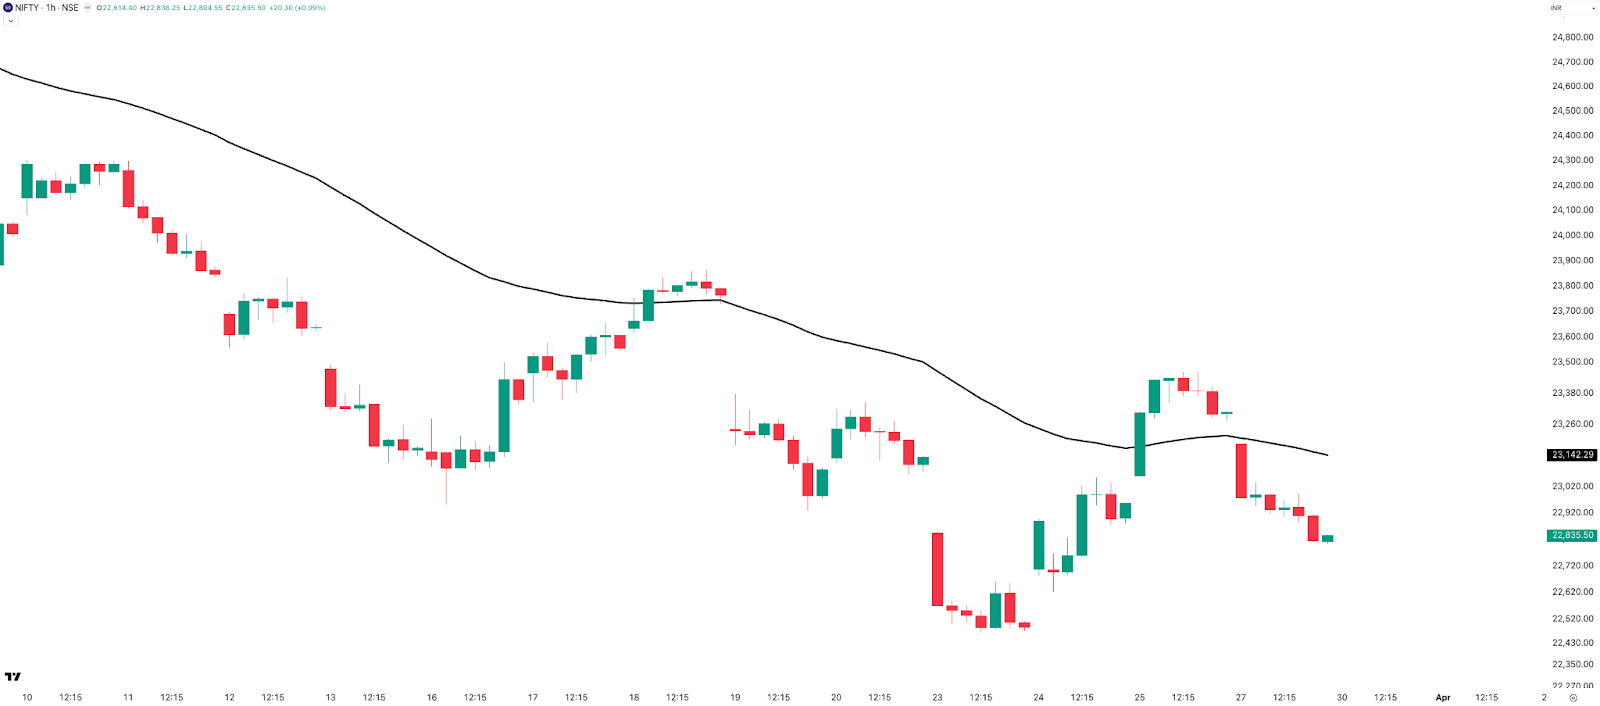
After nearly three weeks of a clean downtrend, the hourly chart is now showing choppiness. Price oscillated around the 50 EMA on Wednesday and Friday, eventually closing below it on Friday — indicating the short-term structure remains weak.
Overnight vs. Intraday Moves
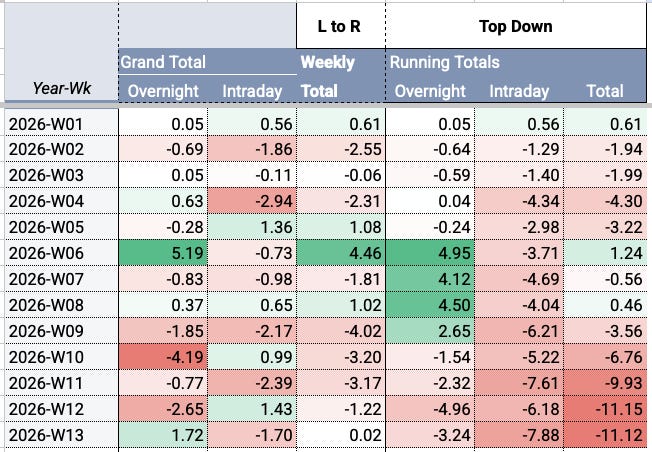
An update on the 2026 overnight vs. intraday breakdown — a data point worth revisiting. Up until Week 8 (end of February, before the conflict escalated), cumulative overnight moves were in the green. Since then, repeated sharp gap-down openings have pushed total overnight moves to –3.24% by end of Week 13. Intraday moves have consistently remained in the red throughout — from –4.04% at Week 8 to –7.88% by end of Week 13. The MIDCAP index tells a different story; that’s worth checking separately on the Market Metrics tracker sheet.
Range Till Expiry (30-Mar, Monday)
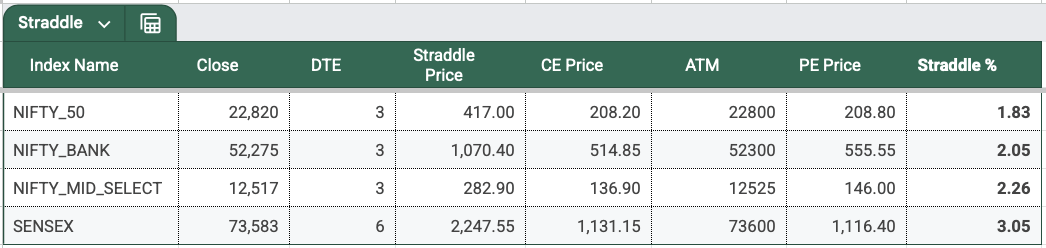
Note: The NIFTY monthly expiry falls on Monday, 30 March , as Tuesday, 31 March is a holiday on account of Shri Mahavir Jayanti.
ATM straddle premium closed at 417 points , implying approximately a 1.83% move on either side. Since this entire premium is being carried over a weekend that falls right before expiry, if markets open flat on Monday, a significant portion — possibly around 50% — could decay at the open itself.
Expected expiry range: 23,237 on the upside | 22,403 on the downside — roughly an 835-point band .
Open Interest
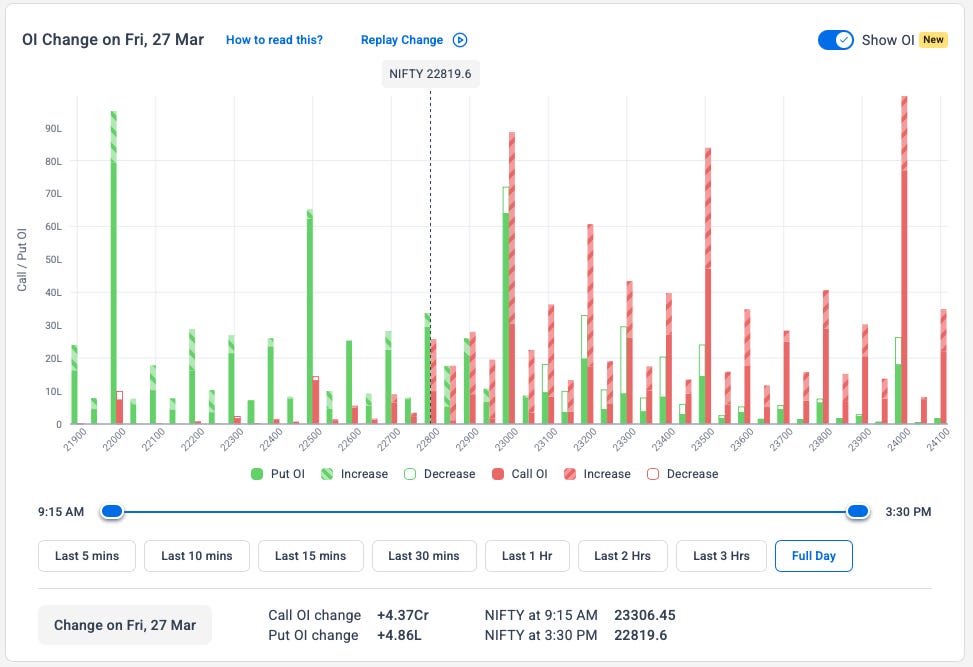
On the CE side, 23,000 , 23,500 , and 24,000 have significantly higher OI. On the PE side, 22,000 , 22,500 , and 23,000 are notable. The positioning suggests many participants are carrying straddles overnight, drawn by the 400+ point premium — but with markets gapping beyond the implied move consistently, carrying delta-neutral positions into the weekend is not a straightforward trade. Overall, OI suggests a slight negative bias, with 23,000 acting as the first resistance.
SENSEX
Weekly
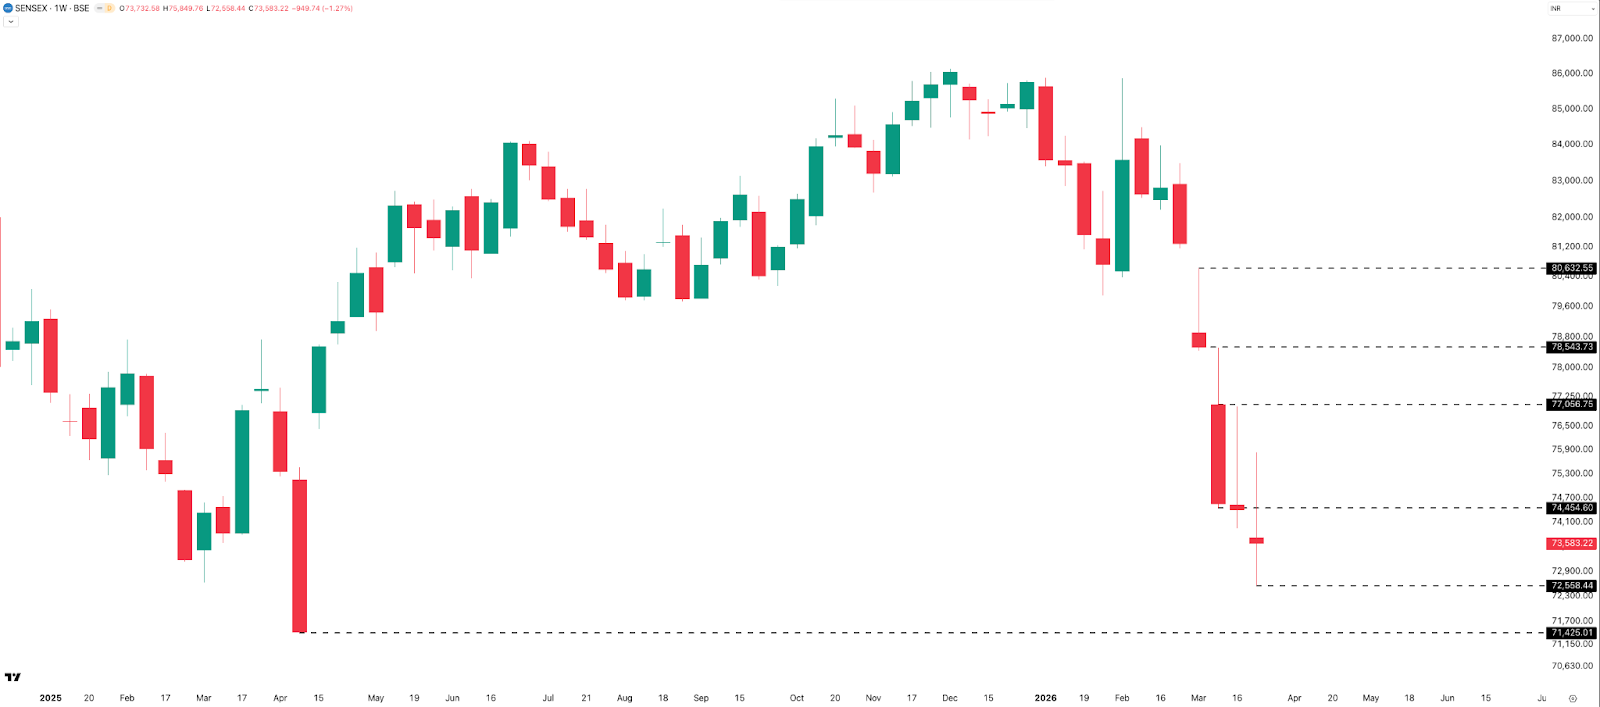
SENSEX lost 950 points (–1.27%) to close at 73,583 , with a weekly range of ~3,300 points (4.34%). Resistance is at 74,450 and 77,000 . Support sits near the weekly low of 72,550 , then 71,450 . View: bearish, in line with NIFTY.
Daily
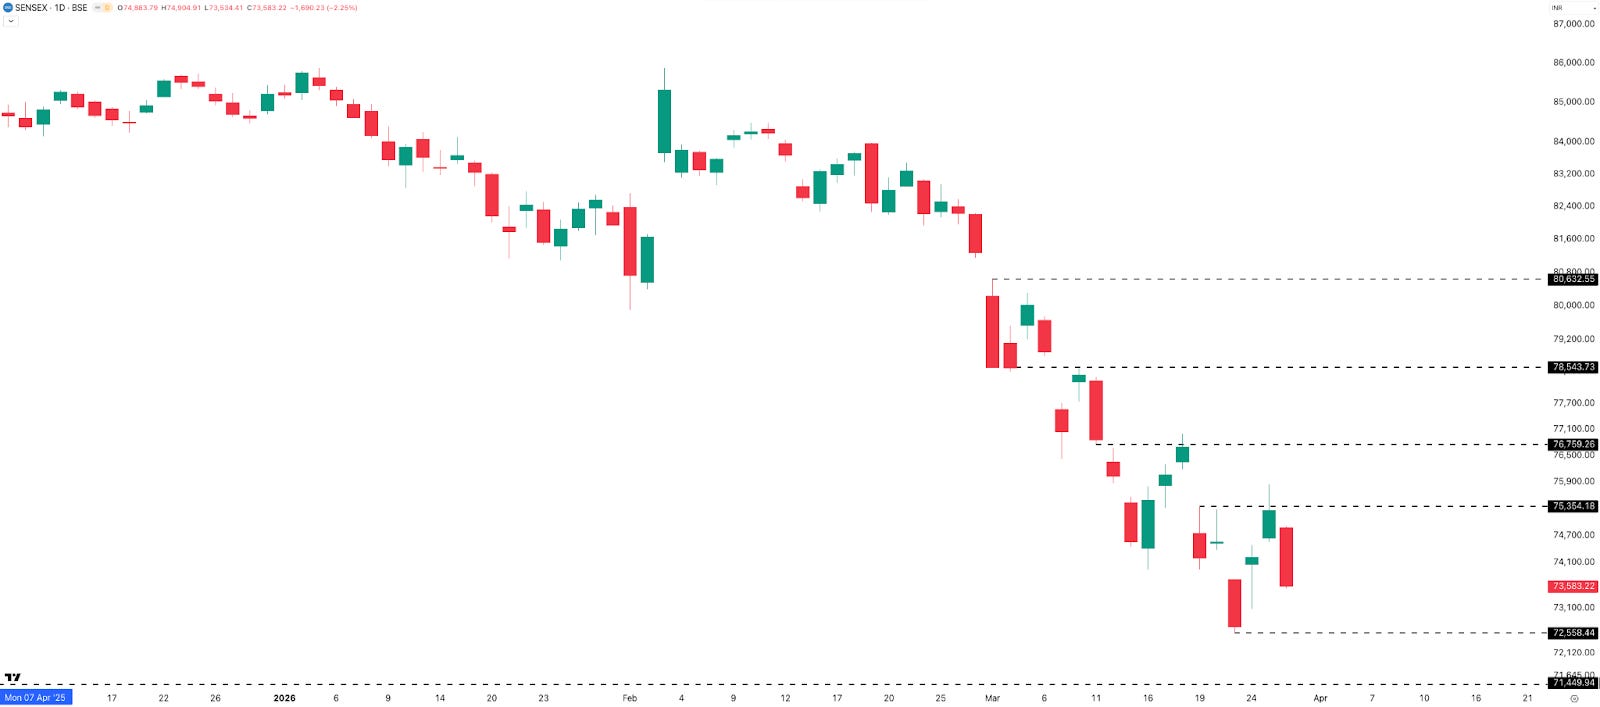
Mirror image of NIFTY — Monday and Friday red, Tuesday and Wednesday green. Supports: 72,550 and 71,450 . Resistances: 75,350 and 76,750 .
Range Till Expiry (2-Apr, Thursday)
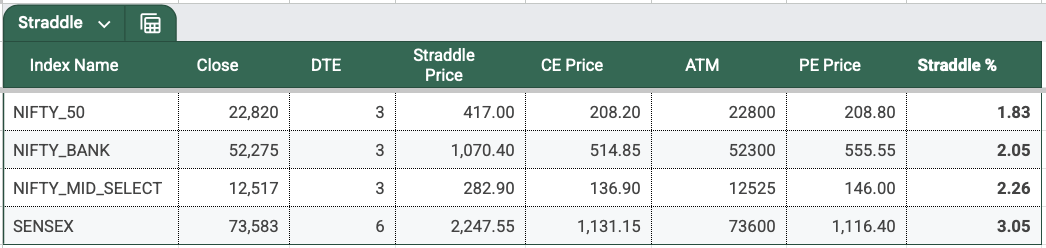
The next SENSEX weekly expiry falls on Thursday, 2 April — the first expiry of the new financial year.
ATM straddle closed at 2,248 points , implying approximately a 3% move on either side.
Expected expiry range: 75,830 on the upside | 71,336 on the downside — broadly 71,350–75,800 .
BANKNIFTY
Daily
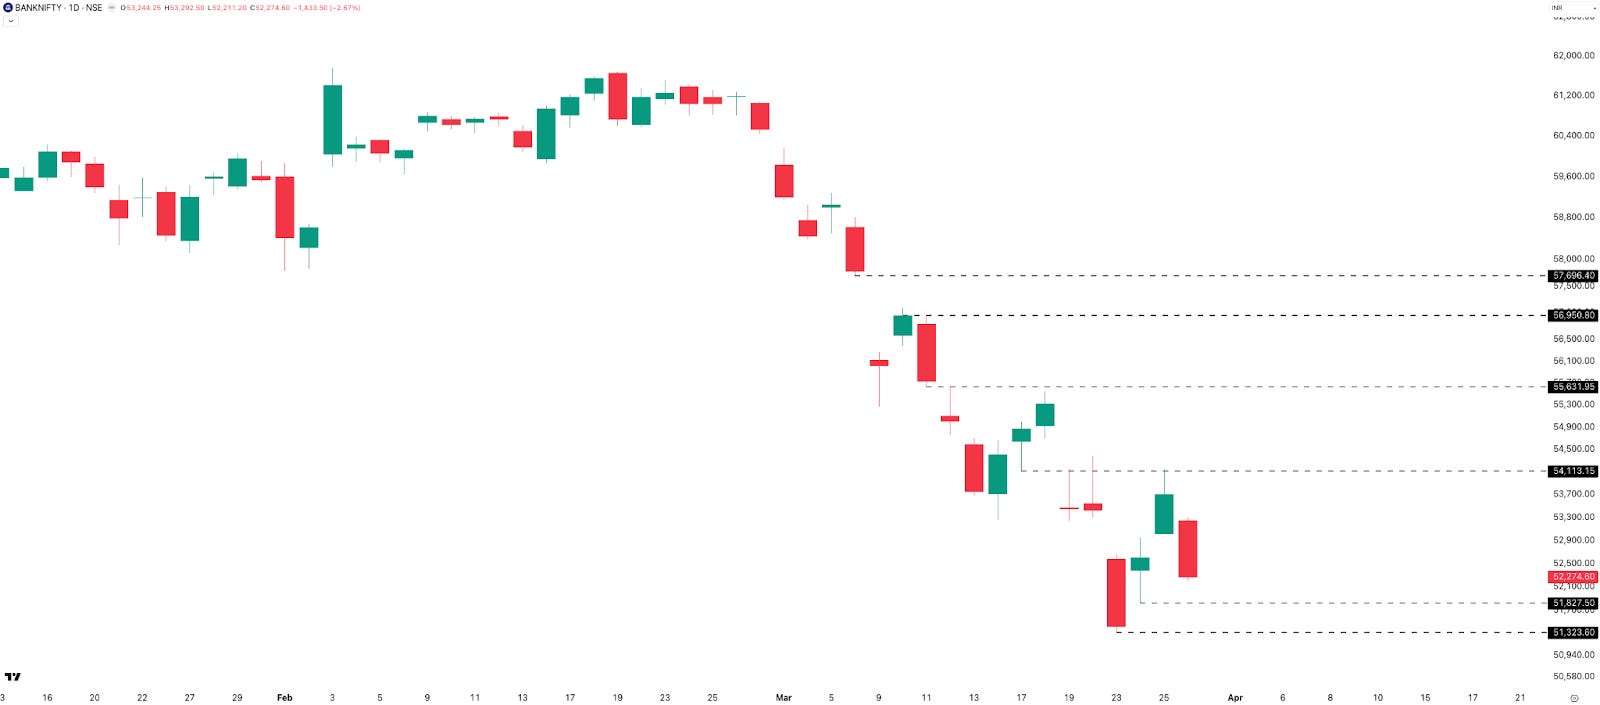
Monday saw a 2,000-point (3.72%) drop. Tuesday and Wednesday recovered 2.27% and 2.10% respectively, before Friday pulled it back down 2.67%. In the current regime, 2% daily moves on BANKNIFTY are becoming almost routine — the new normal.
For the week, BANKNIFTY lost approximately 1,150 points (–2.16%) to close at 52,274 . Weekly range: 2,822 points (5.5%). Supports: 51,800 and 51,300 . Resistances: 54,100 , 55,650 , 56,950 . Overall view: bearish.
Hourly
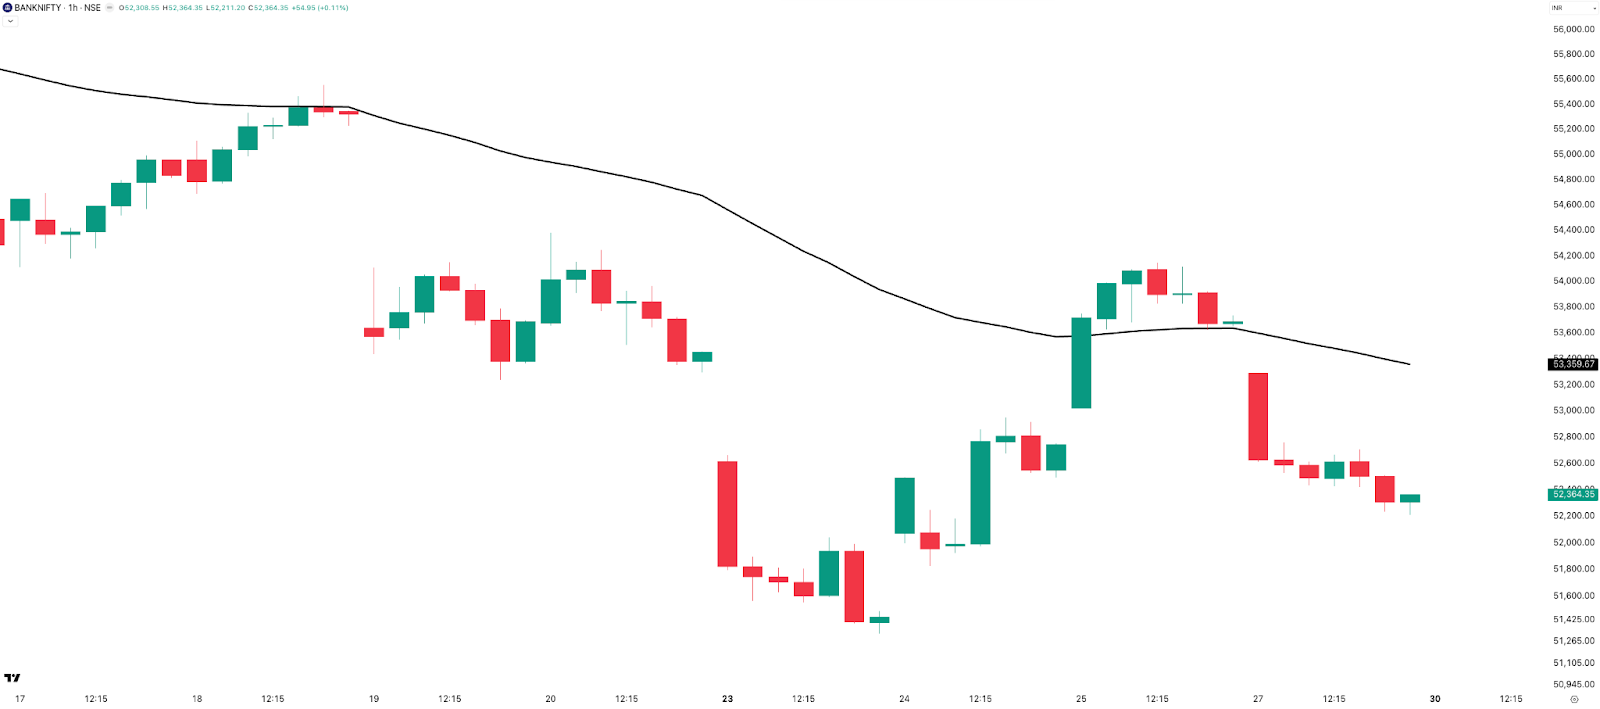
Similar to NIFTY — after a clean extended downtrend, the hourly chart is now choppy. Price ended the week below the 50 EMA, maintaining a bearish short-term bias.
Rate of Change (ROC) — Weekly Snapshot

Week 13 deepened the red. NIFTY fell 1.28% , SENSEX 1.27% , MIDCPNIFTY 0.86% , and BANKNIFTY led losses at 2.16% .
Year-to-date: NIFTY and BANKNIFTY are down 12–13% ; MIDCPNIFTY is down approximately 9% . March 2026 is now tracking as one of the worst March months since March 2020 — the index is down 7.44% for the month. All three months of 2026 have closed in the red.
Sectors
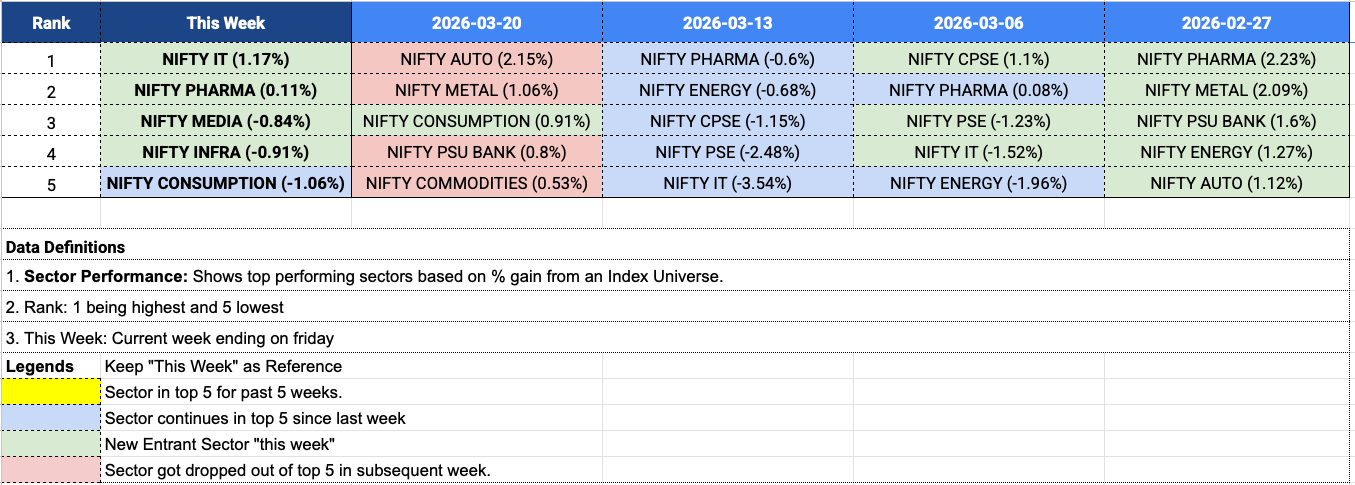
Four new entrants this week. IT (+1.17%) and Pharma (+0.11%) made a comeback after stepping back last week. The remaining three in the top five were all negative: Media (–0.84%) , Nifty Infra (–0.91%) , and Nifty Consumption (–1.06%) — the last of which carried over from last week. Banks, which dominated sector leadership in 2025, appear to have fizzled. For now, Pharma continues to hold up relatively well.
Ranges & Expiries

NIFTY’s 5-day average daily range stood at 374 points — roughly unchanged from last week’s 365, and equivalent to approximately a 1.63% average daily move . This week, Tuesday registered the highest range across indices, even though the indices closed green that day.
NIFTY Weekly Expiry (24-Mar, Tuesday)
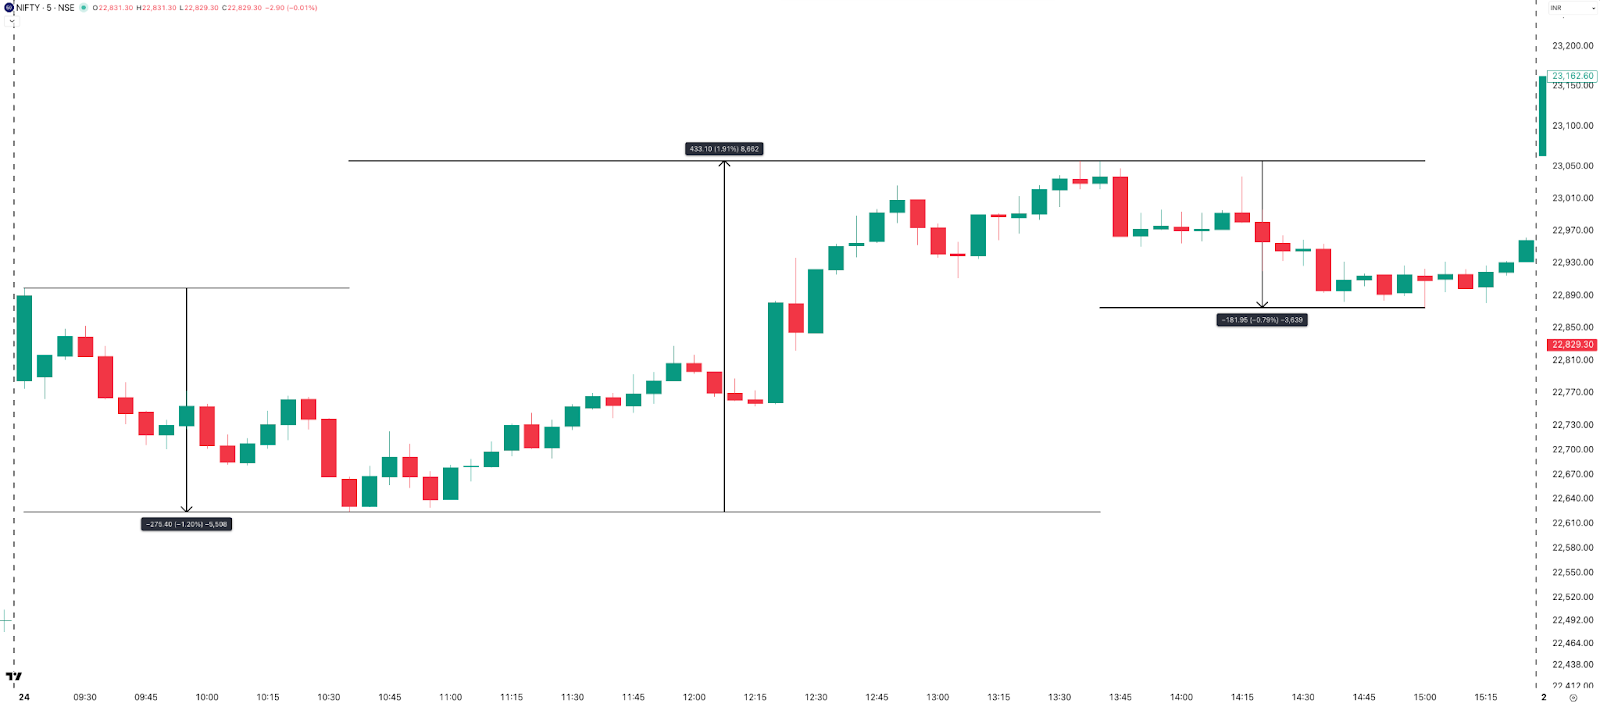
NIFTY opened with a 400-point (1.78%) gap-up on 0DTE. The ATM straddle opened around 223 points at 9:16 AM, but intraday moves were erratic: 275 points down, then 433 points up, then 181 points down. The index ultimately closed 400 points above the previous day’s close — but effectively the entire move came from the overnight gap, with no meaningful directional follow-through during the session. Not the easiest day for option sellers; long gamma on 0DTE continues to be rewarding in volatile conditions, and buyers with the right positioning likely had a decent day.
SENSEX Monthly Expiry (25-Mar, Wednesday)
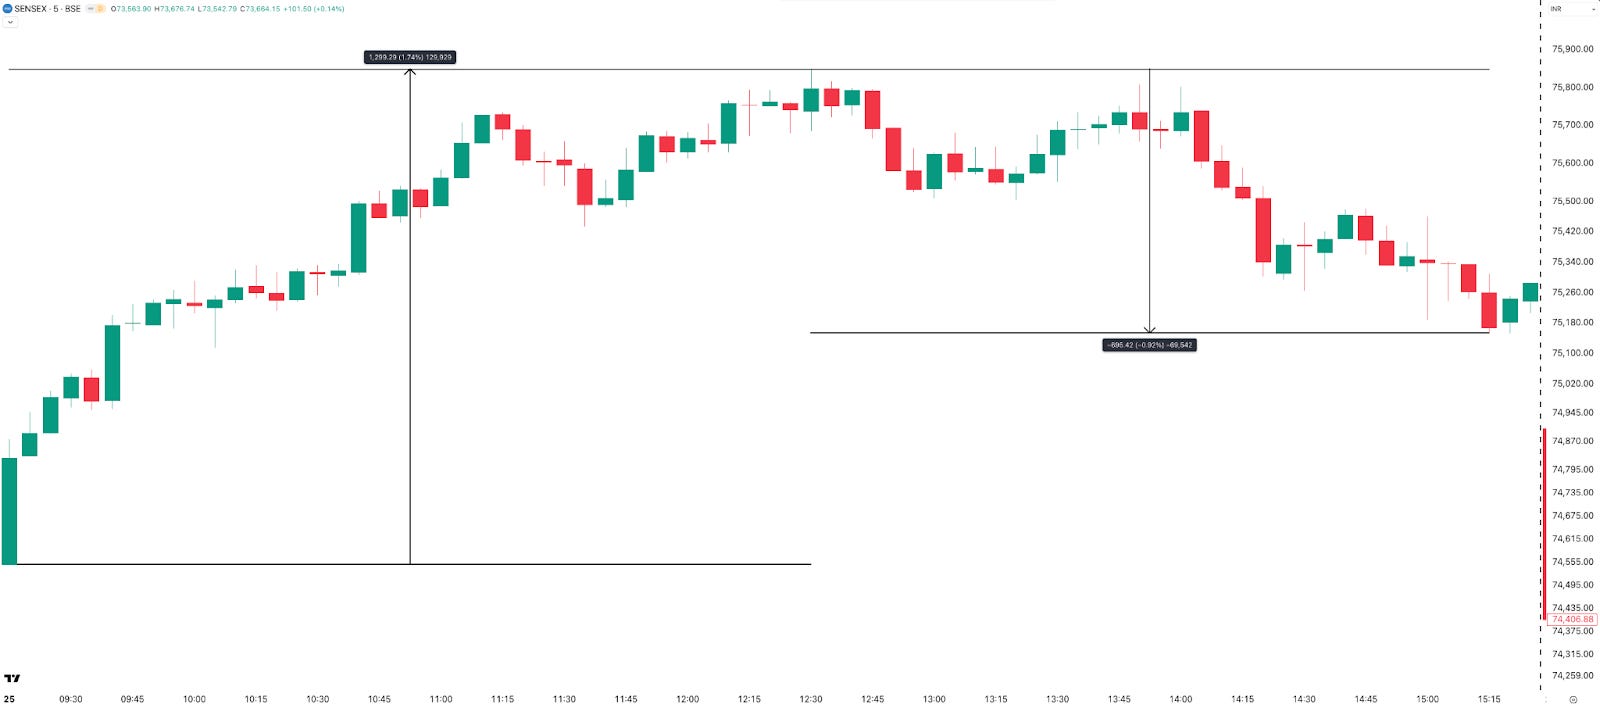
Back-to-back expiries this week — Thursday’s holiday shifted the SENSEX expiry to Wednesday. The ATM straddle opened around 560 points. From there, the index put in a clean one-way up move of 1,300 points (1.74%) until around 12:30 PM, followed by a 700-point pullback. SENSEX ultimately closed 1,205 points above the previous day’s close, including the 584-point gap-up opening. Delta-neutral strategies would have struggled with the sustained up move. The 9:20 straddle sellers, running with fixed stop losses on individual legs, likely had a strong day — a reminder that simplicity in strategy often outperforms complexity, in trading as in most things.
INDIAVIX
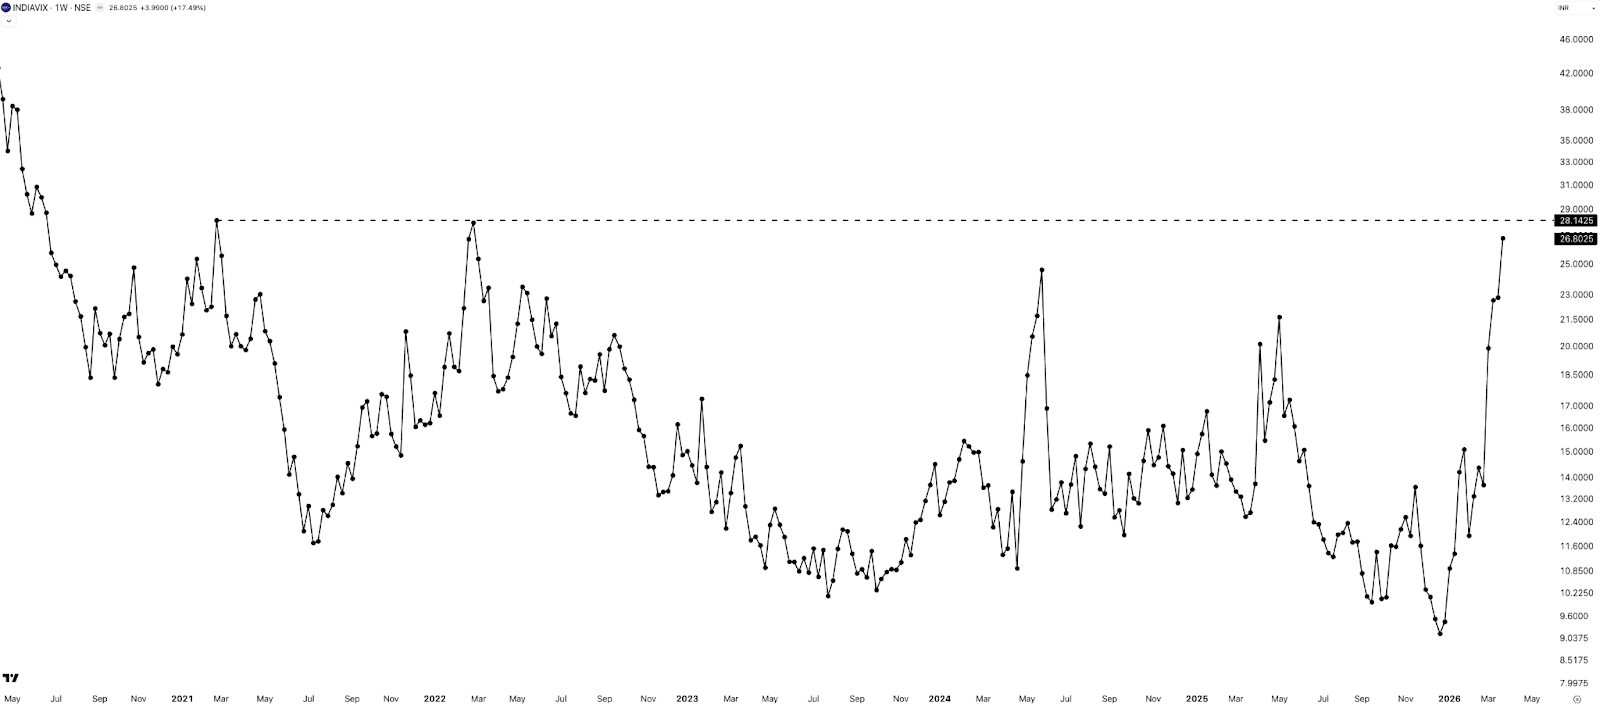
INDIAVIX closed at 26.80 this week — up 17.5% (4 points) from last week, and now at levels last seen in February 2021 and February 2022. The fear index is clearly reflecting the uncertainty the world is currently navigating, with the line between real and verified news increasingly difficult to draw.
The path from here depends heavily on the geopolitical situation. If the conflict continues or escalates, VIX may rise further despite India not being directly involved — global markets are too interconnected for that to matter. Any ceasefire or meaningful de-escalation, on the other hand, could trigger a sharp VIX compression.
Commodities
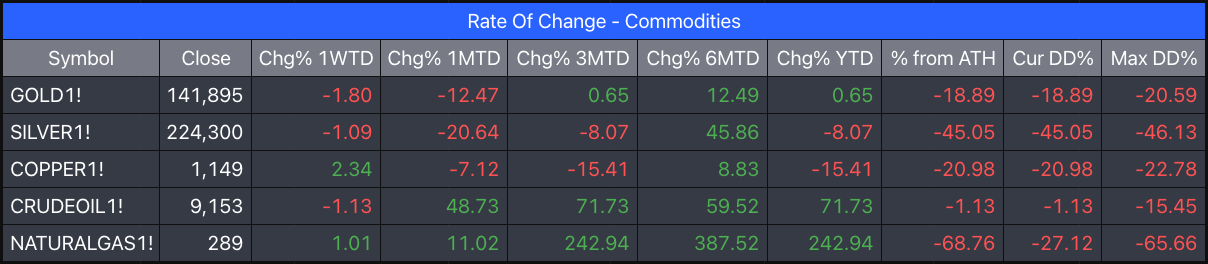
A muted week overall, but the month-to-date numbers for precious metals tell a starker story.
- Gold: ~–1% on the week; –12% month-to-date
- Silver: ~–1% on the week; –20% month-to-date
- Copper: +2.34%
- Crude Oil: –1%
- Natural Gas: +1%
Despite the extended weakness, Gold is showing some signs of strength on shorter timeframes — worth watching to see if a base forms here.
Summary
Week 13 extended the losing streak, with NIFTY logging its fifth consecutive red week. Despite the negative close, intraday volatility remained extreme — wide ranges, sharp pullbacks, and the same pattern of rallies getting sold into. INDIAVIX spiked to 26.8, overnight moves have turned firmly negative post the geopolitical escalation, and all three months of 2026 now sit in the red. Sectorally, IT and Pharma showed early signs of resilience, but broader sentiment remains weak. Structure: bearish to sideways , heavily news-flow dependent.
What Caught Our Attention This Week
1. The Economic Consequences of the Iran War — Noah Smith Noah Smith, American commentator and former finance professor at Stony Brook, examines the consequences of the current conflict. His core argument: this is a “war of choice” with no clear exit strategy — a self-inflicted wound that damages global stability. Essential reading for a sober perspective on what this conflict means beyond the headlines. Read here →
2. Intermission Podcast — Asian Paints Series Ken has launched an Acquired-style podcast called Intermission , and the first set of episodes covers Asian Paints in depth. If you enjoy business history told as a story, this should be on your list. Listen here →
What to Expect Next Week — Important Dates & Changes
Next week is a three-day trading week with two market holidays: Tuesday, 31 March (Shri Mahavir Jayanti) and Friday, 3 April (Good Friday).
- Several things are happening simultaneously:
- Monthly expiries: On Monday, 30 March — NIFTY50, MIDCAPNIFTY, BANKNIFTY, and FINNIFTY all expire. SENSEX expires on Thursday, 2 April . Expiry dates for several indices have shifted due to the two holidays — worth double-checking your positions.
- NSE index rejig: Multiple NSE indices are going through their periodic reconstitution on 30 March . You can find a quick explainer on what’s changing here →
- New financial year: The week marks the beginning of FY 2026–27. FY26 was a difficult year for most equity investors — hopefully the next one turns out better.
- Kite Connect static IP deadline: If you use APIs for algo trading, the deadline to link a static IP to your Kite Connect account is 1 April . You would have received a communication about this already — don’t leave it for the last minute.
With that, we wrap up this week’s Weekly Market Metrics.
If you find this series useful, don’t forget to subscribe to the channel - and yes, do share it with your friends.
Until then — stay curious, stay steady, and enjoy your weekend.
