Welcome to another edition of Weekly Market Metrics. I am Sandeep Rao, and we’re now in Week 15 of 2026.

It’s been quite an interesting week — on multiple fronts. On one hand, there are signs of a possible ceasefire taking shape, but at the same time, we’re still seeing some escalations, like the recent bombings in Lebanon.
And then, zooming out, two completely different kinds of milestones stand out. We have the Artemis program pushing the boundaries of human exploration — taking us back towards the Moon. And in parallel, Anthropic continues to advance AI with its latest model Mythos, expanding what machines can reason and create.
So we have this strange contrast: on one end, we’re exploring the frontiers of science and intelligence, literally and digitally. And on the other hand, we’re still deeply tribal in how we deal with conflict and geopolitics.
Back to more mundane things like markets. We did see a decent bounce through the week, recovering close to 6% from the recent lows. In a way, markets seem to be focusing more on resilience rather than the noise around.
A note on structure: starting this week, we’ll begin with what happened last week and then move to what we expect in the coming week. The other sections remain the same.
Section 1 — What Happened Last Week
Rate of Change (ROC) Across Indexes
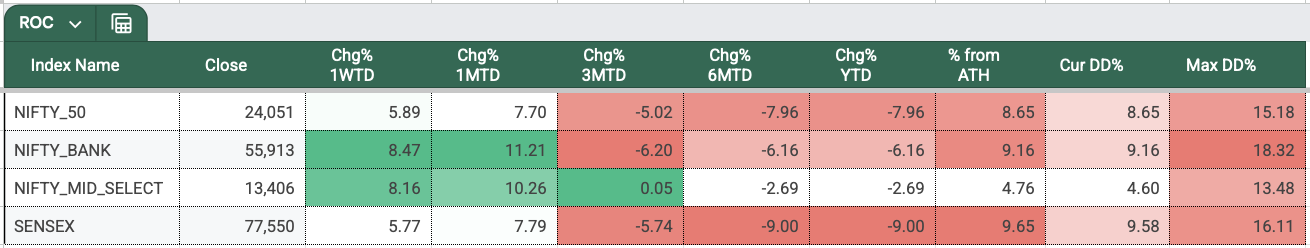
This week, all four indexes we track — Nifty, Bank Nifty, Midcap Nifty, and Sensex — finally closed in the green, after being in the red for close to six weeks. Bank Nifty led the pack with a solid 8.47% gain, followed closely by Midcap Nifty at 8.16%, while Nifty and Sensex climbed about 5.9% and 5.8%, respectively.
It’s a welcome change after we just sat through one of the worst monthly crashes in over five years in March.
This bounce was largely expected given how much the market fell last month. Now, we just have to see if this momentum continues for the rest of April. But I would like to temper expectations — we aren’t really out of the woods yet. On a year-to-date basis, all four indices are still in the red. Midcap Nifty is down the least, followed by Bank Nifty. Nifty is down about 8%, and Sensex is down 9% for the year.
NIFTY
Weekly
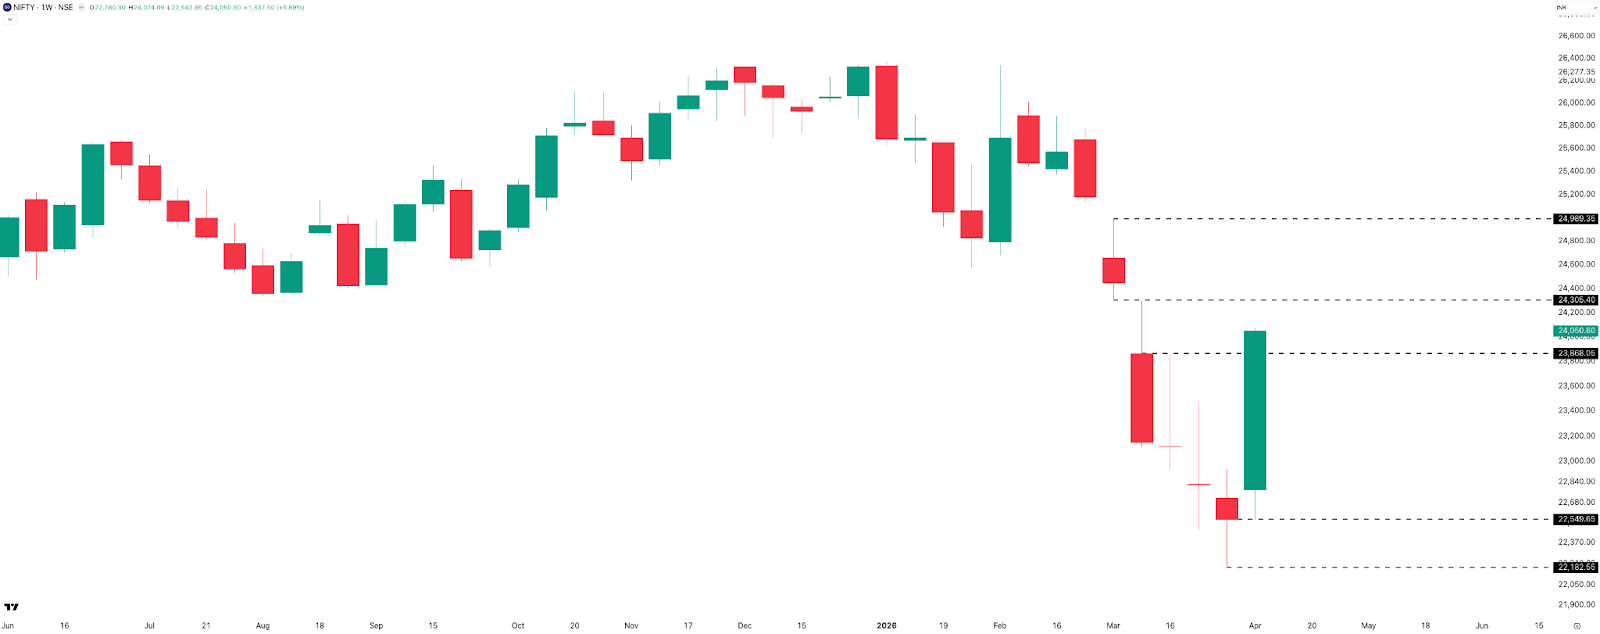
This week formed a strong Marubozu candle, piercing through almost every resistance discussed last week. The only level left standing is that 24,300 mark. The index comfortably closed above 24,000, ending at 24,051 — a massive jump of 1,338 points or 5.9%.
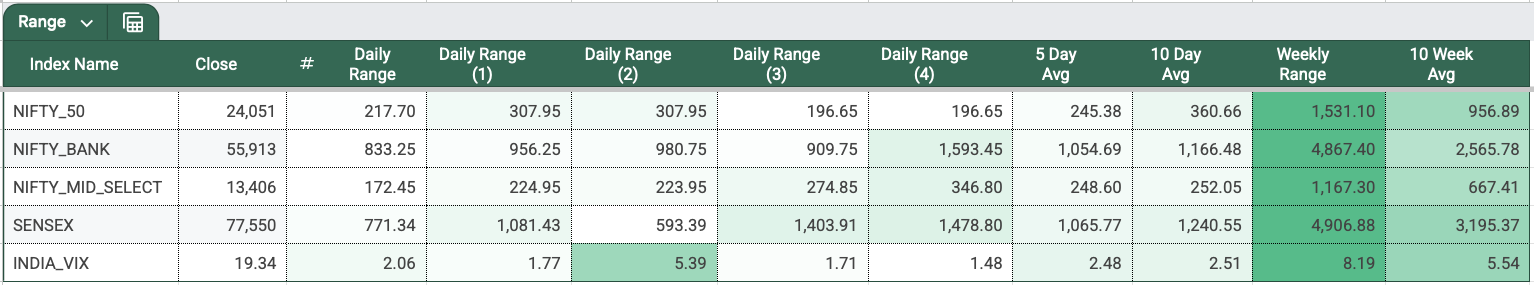
The weekly range was a huge 1,531 points, which is about 6.36% of the spot price. We finally got the range expansion we were looking for, and it happened decisively on the upside.
Daily
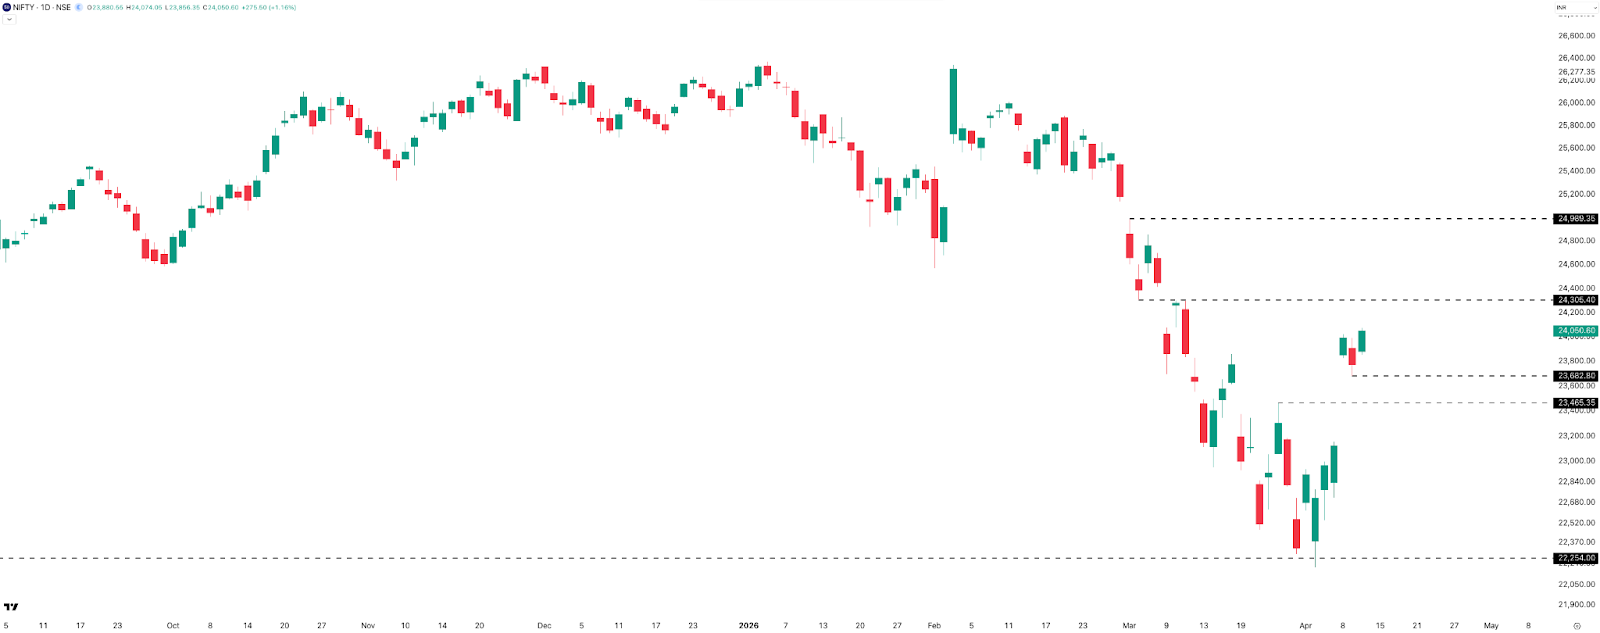
We saw four green candles on the daily timeframe. Monday started strong with a +1.12% gain, followed by a steady +0.68% on Tuesday. Wednesday was the standout — the ceasefire announcement triggered a massive 730-point gap up, a huge 3.16% move, and it ended the day at +3.78%. Thursday was the only red day of the week, seeing a minor pullback of -0.93% toward the 23,700 level. However, we regained momentum on Friday with a solid +1.16% upmove to take the index above 24,000.
Hourly
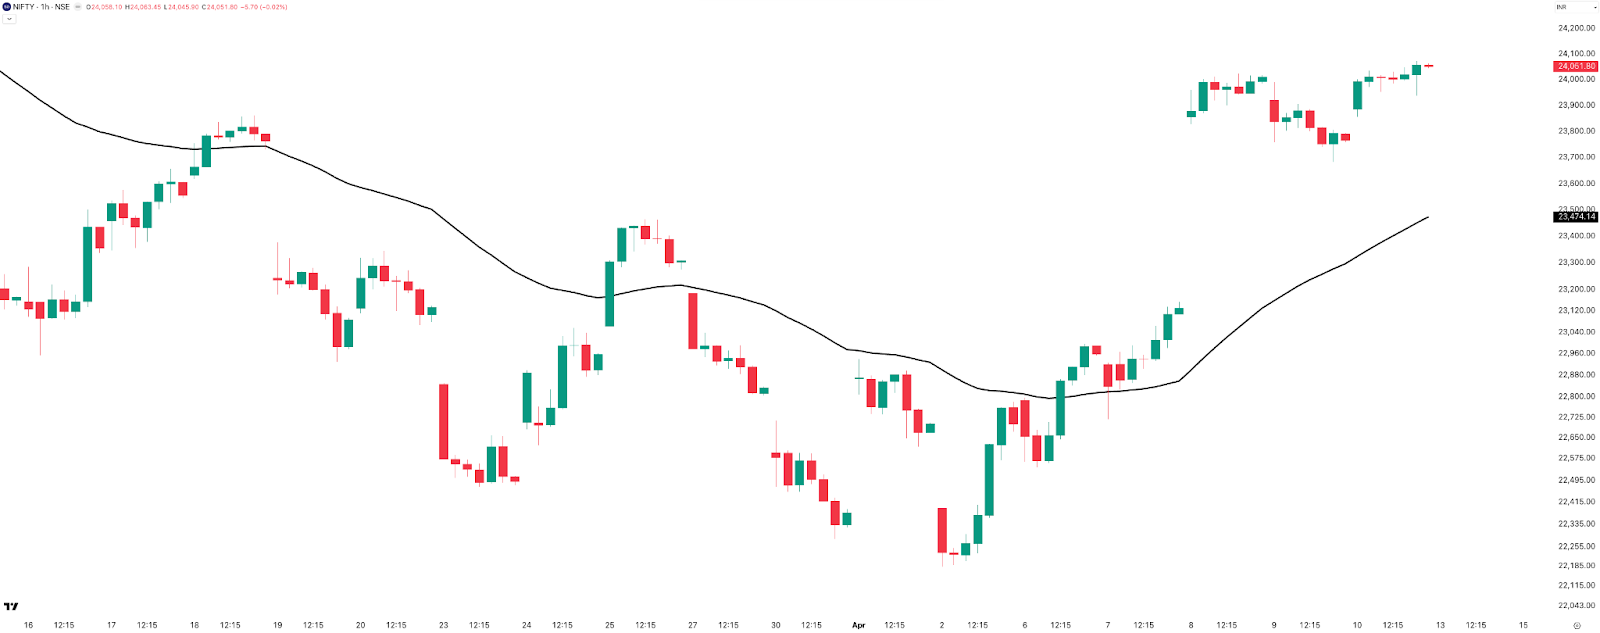
The index crossed the 50 EMA on Monday and chopped around on Tuesday. But after Wednesday’s massive gap, the price is now sitting way above that EMA. Short-term trend followers likely made some decent money on that Wednesday move. Now, we’re facing the classic dilemma: will the EMA catch up to the price, or will the price pull back to the EMA? Personally, I’m hoping for the former, but let’s see how it plays out.
Nifty Weekly Expiry — Tuesday, 7 April
The ATM straddle opened with a premium of 210, but the day’s range ended up being more than twice that. Non-directional players likely struggled to manage their positions, but it was a great day for directional traders, as the index consistently made a series of higher highs and higher lows throughout the session.
SENSEX
Weekly
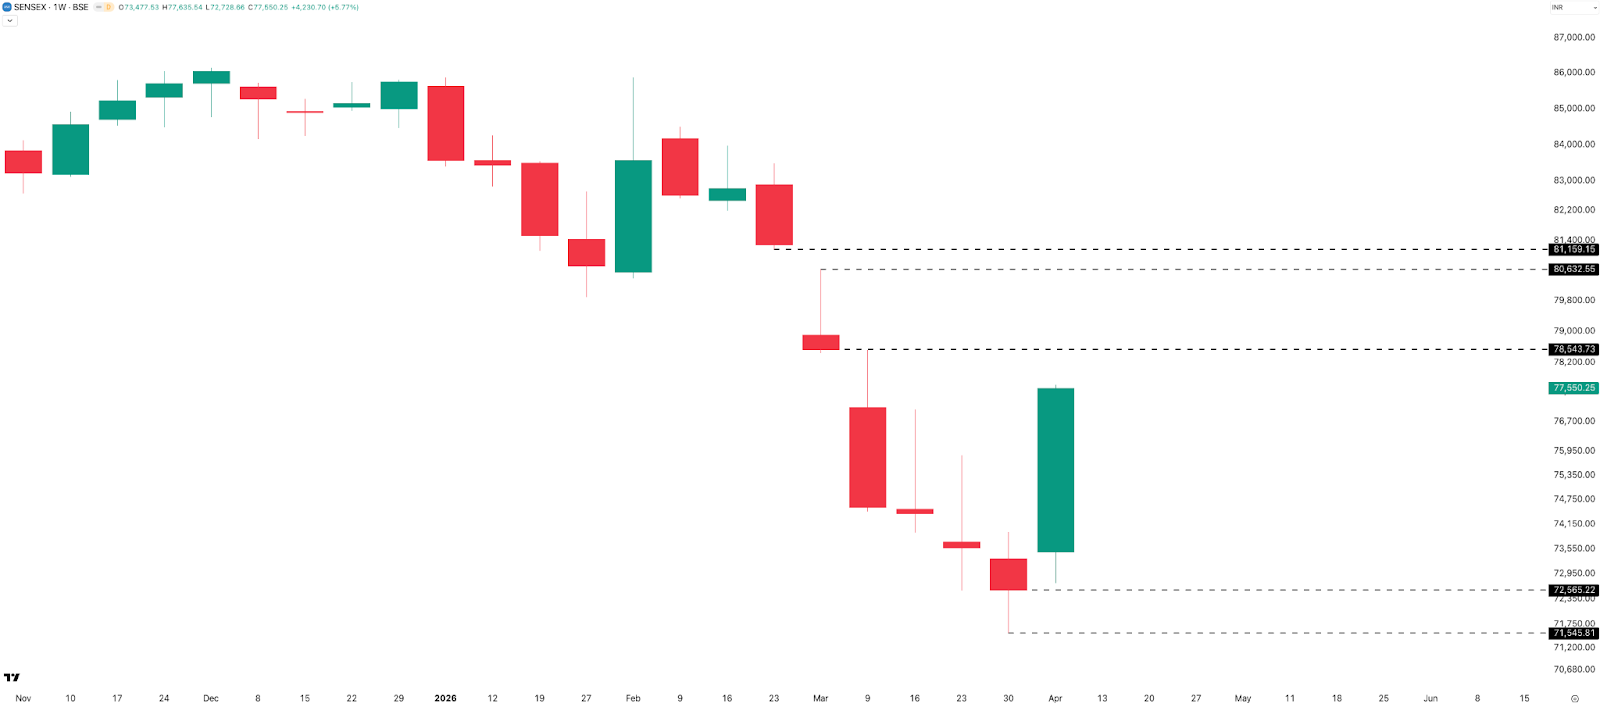
Similar to Nifty, the Sensex weekly candle was a strong green Marubozu, gaining 4,230 points or 5.77%. The weekly range for Sensex was even more impressive at 4,907 points, which is about 6.33% of the spot price.
Daily
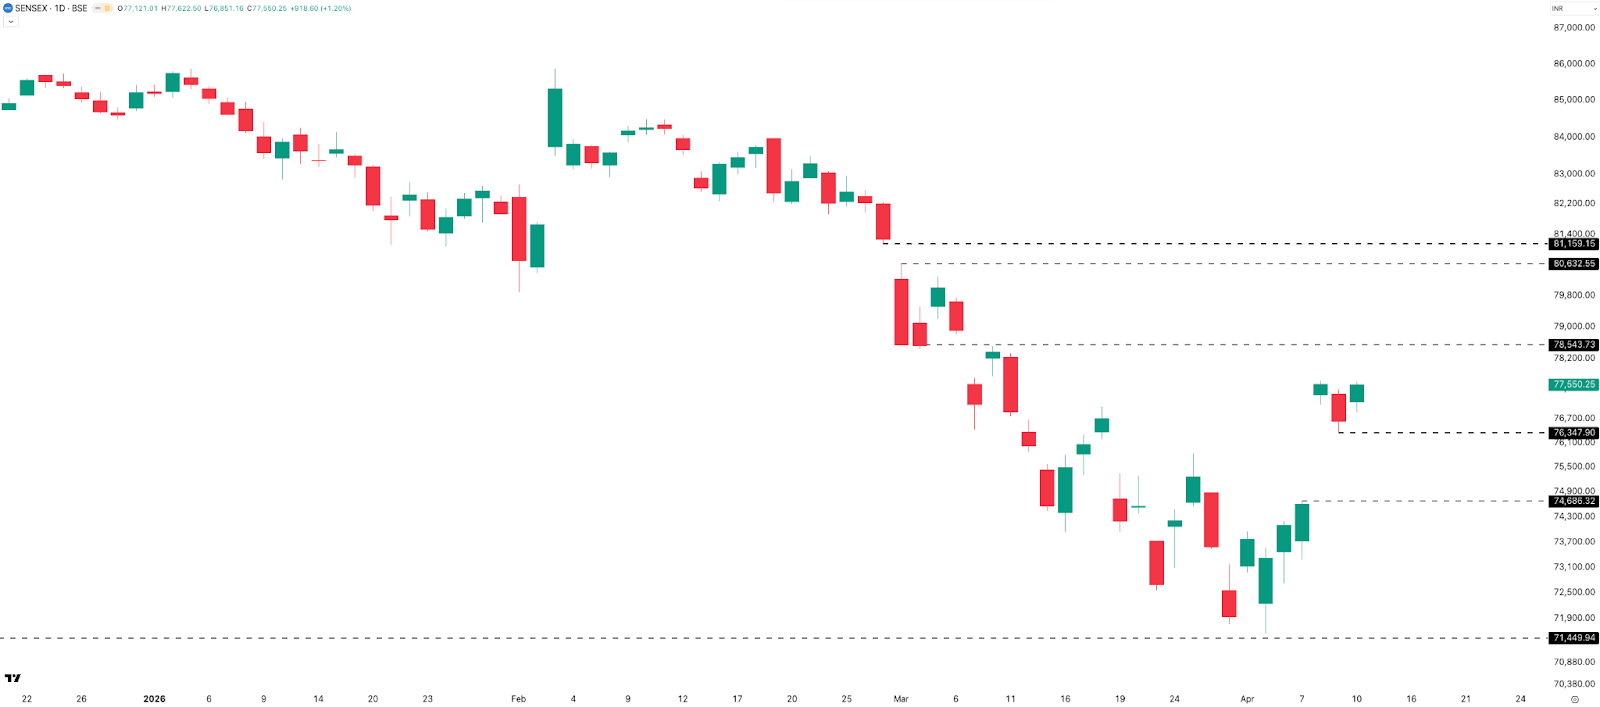
Sensex wasn’t quite able to close above Wednesday’s high of 77,635 — something Nifty managed to pull off. Other than that, the price action was almost identical across both indices. That was really the only notable difference between them this week.
Sensex Weekly Expiry — Thursday, 9 April
It was a relatively smooth expiry, except for a chaotic first hour where the index swung wildly in both directions. After that initial volatility, it settled into a consolidation phase until about 2 PM. It turned out to be a great day for sellers, but a tough one for buyers — especially considering the ATM straddle opened around 530 and spiked 100 points in that first hour alone.
BANK NIFTY
Weekly
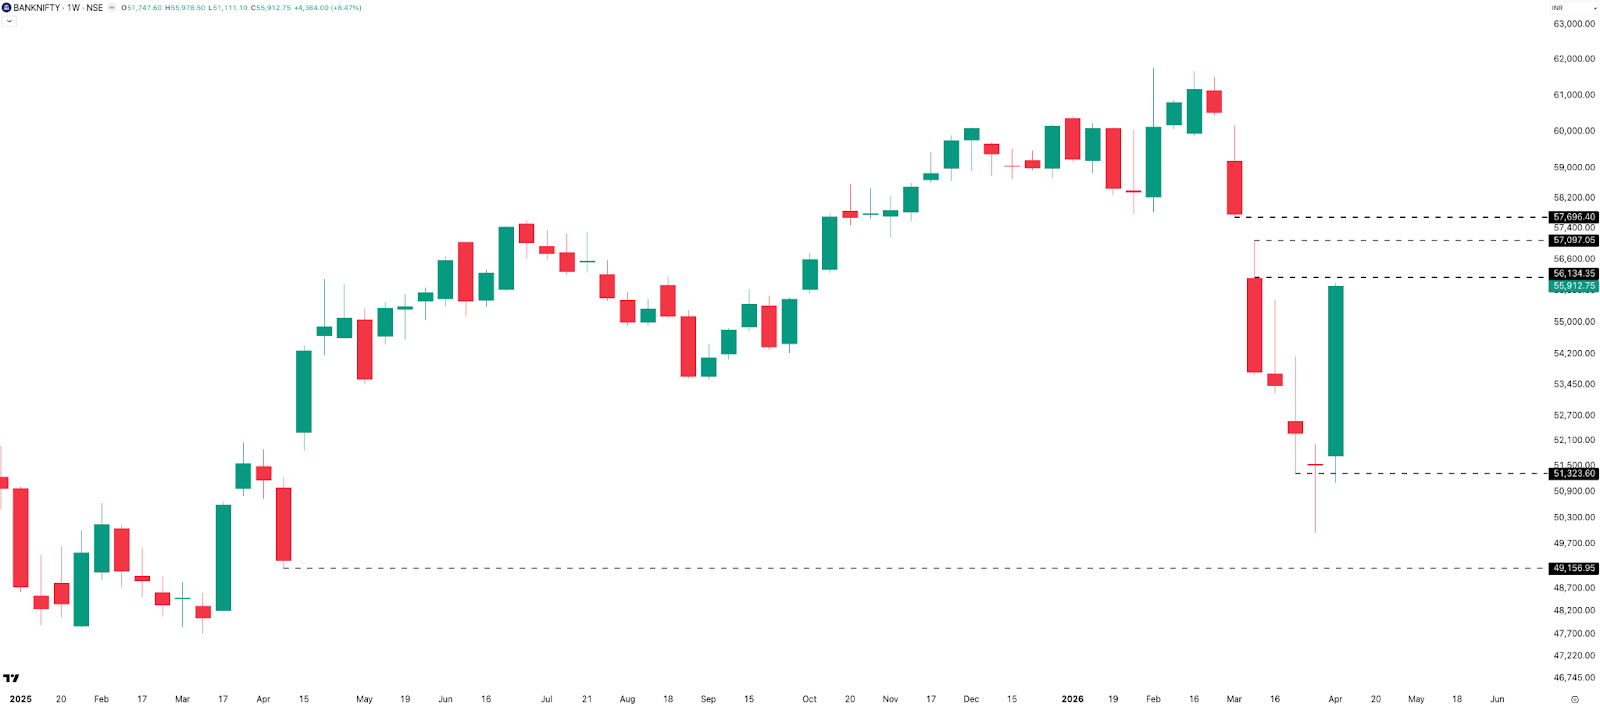
The index gained 4,364 points, or 8.47%, for the week, forming a solid green candle and closing right near the week’s high. Those upper and lower wicks that have dominated the weekly chart for the last three weeks are finally gone, replaced by pure bullish momentum.
Daily
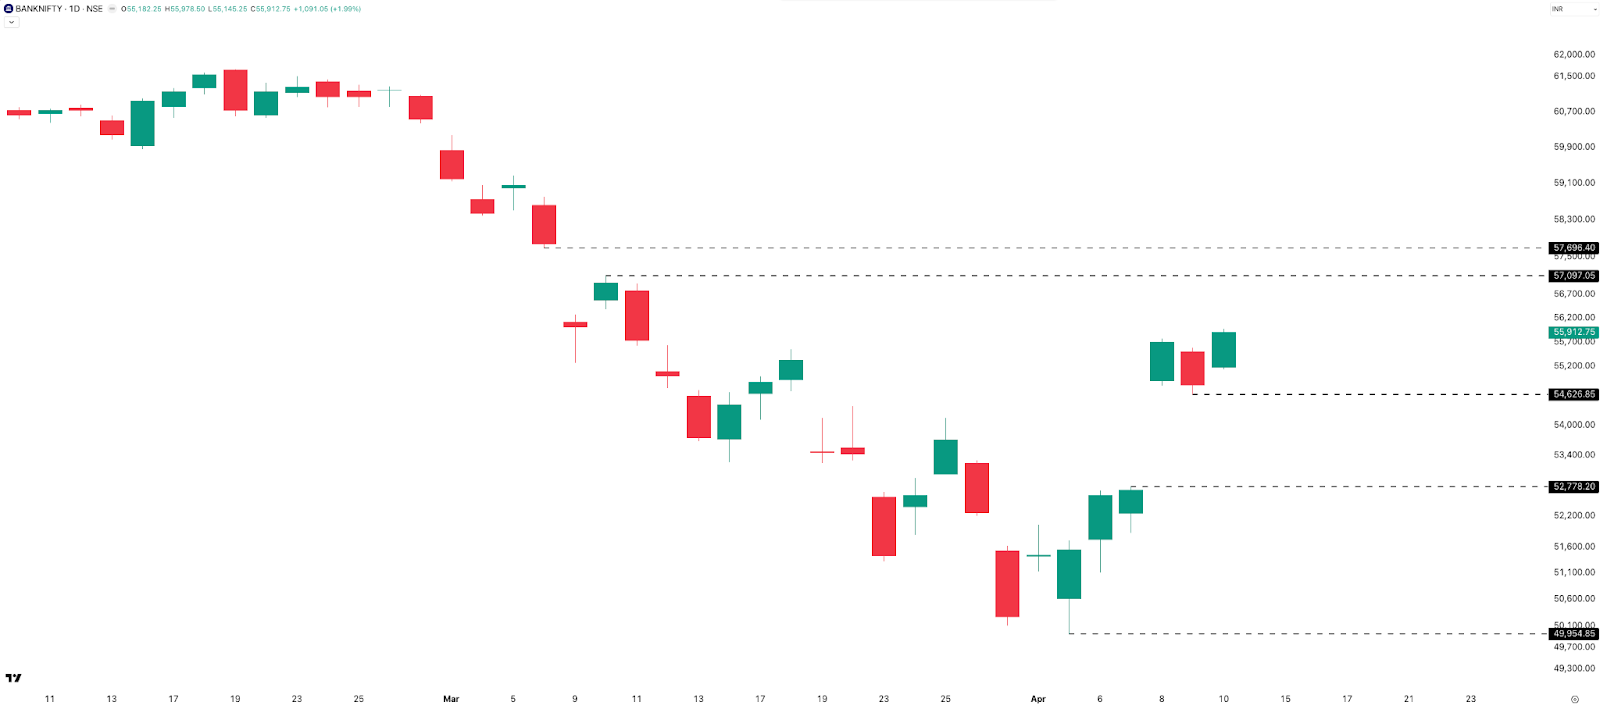
The pattern mirrors Nifty and Sensex, but the percentage move for the week was significantly larger. The Wednesday gap-up on Bank Nifty was especially massive, clocking in at 4.15%.
Hourly
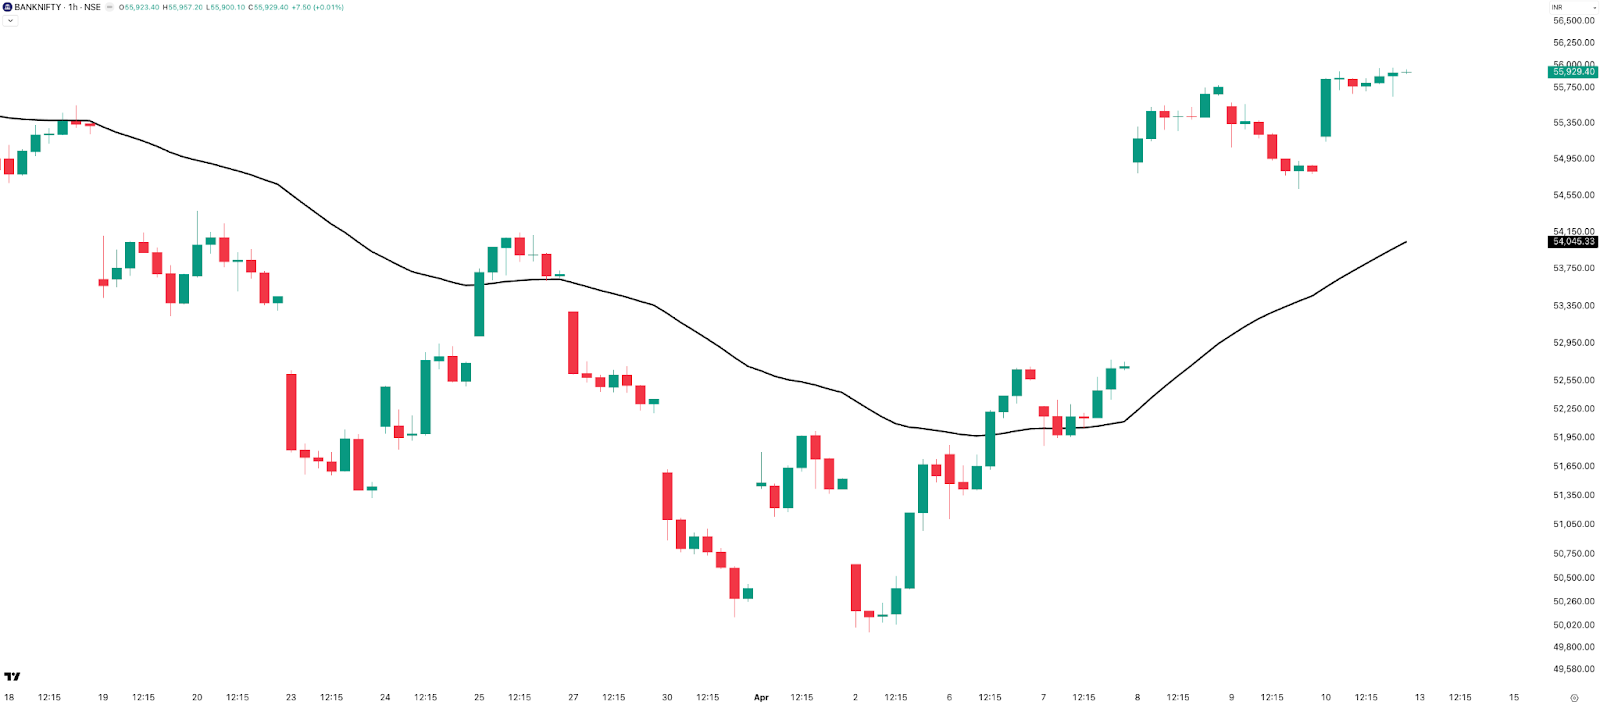
Bank Nifty stayed below the 50 EMA on Monday and chopped around through Tuesday, before finally breaking and staying above it from Wednesday onwards. By the end of the week, the index is sitting well above the EMA. Because of this, the short-term trend-following bias for both Nifty and Bank Nifty is now firmly long.
Section 2 — What to Expect in the Coming Week
(While talking about all levels for weekly and daily charts, refer to previous charts and highlight those levels.)
NIFTY
On the weekly charts, resistance sits at 24,300, followed by the psychological 25,000 mark. For support, we’re looking at 23,850, and then down at 22,550, which was this week’s low.
On the daily timeframe, resistance levels remain the same as the weekly. Our primary support is the 23,700–23,450 zone, where that massive gap still remains unfilled.
Based on the straddle price, the expected range for the upcoming expiry is between 24,330 and 23,773.
Also, keep in mind that Nifty’s next expiry has been moved to Monday, 13 April . This is because the market will be closed on Tuesday, 14 April, in observance of Dr. Babasaheb Ambedkar Jayanti.
The overall bias for Nifty is definitely bullish, especially since we managed to close right near the week’s high.
SENSEX
The straddle premium suggests a range of about 1,400 points in either direction, giving us a rough playing field between 78,950 and 76,150.
On the weekly chart, resistance is pegged at 78,550, followed by a major zone between 80,650 and 81,150. For support, we’re looking way down at the 72,700–72,500 area.
On the daily chart, that gap between 76,350 and 74,700 should act as a solid support zone. On the upside, resistance sits at 78,550 and then at 80,600.
Just like Nifty, the overall bias for Sensex remains firmly bullish heading into the new week.
BANK NIFTY
On the weekly chart, resistance sits at 56,150, with a higher supply zone between 57,100 and 57,700. On the flip side, supports are comfortably placed at 51,300 and 49,150.
On the daily timeframe, that gap zone between 54,600 and 52,800 is the key area to watch — it should act as solid support. Resistance aligns with the weekly view, specifically that heavy 57,100–57,700 zone.
Directional Bias Summary
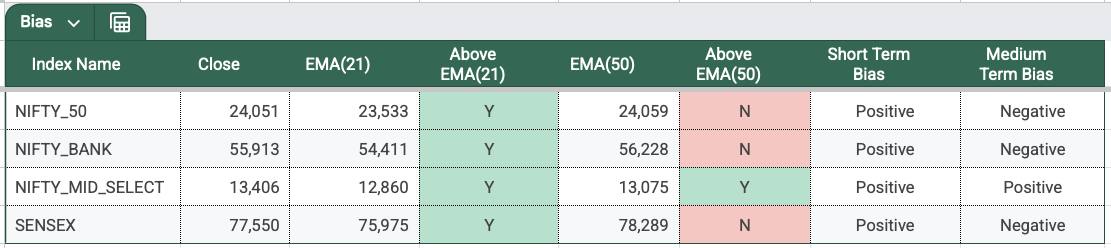
Looking across the board, all four indices now show a positive short-term bias. However, only Midcap Nifty has moved into a positive medium-term bias, while the other three remain negative for now.
What this tells us is that while this week’s massive upmove has definitely shifted sentiment to positive, the indices still haven’t cleared the 50 EMA on the daily timeframe. Until we see a decisive close above that, we can’t quite call this a return to strong bullish momentum.
India VIX
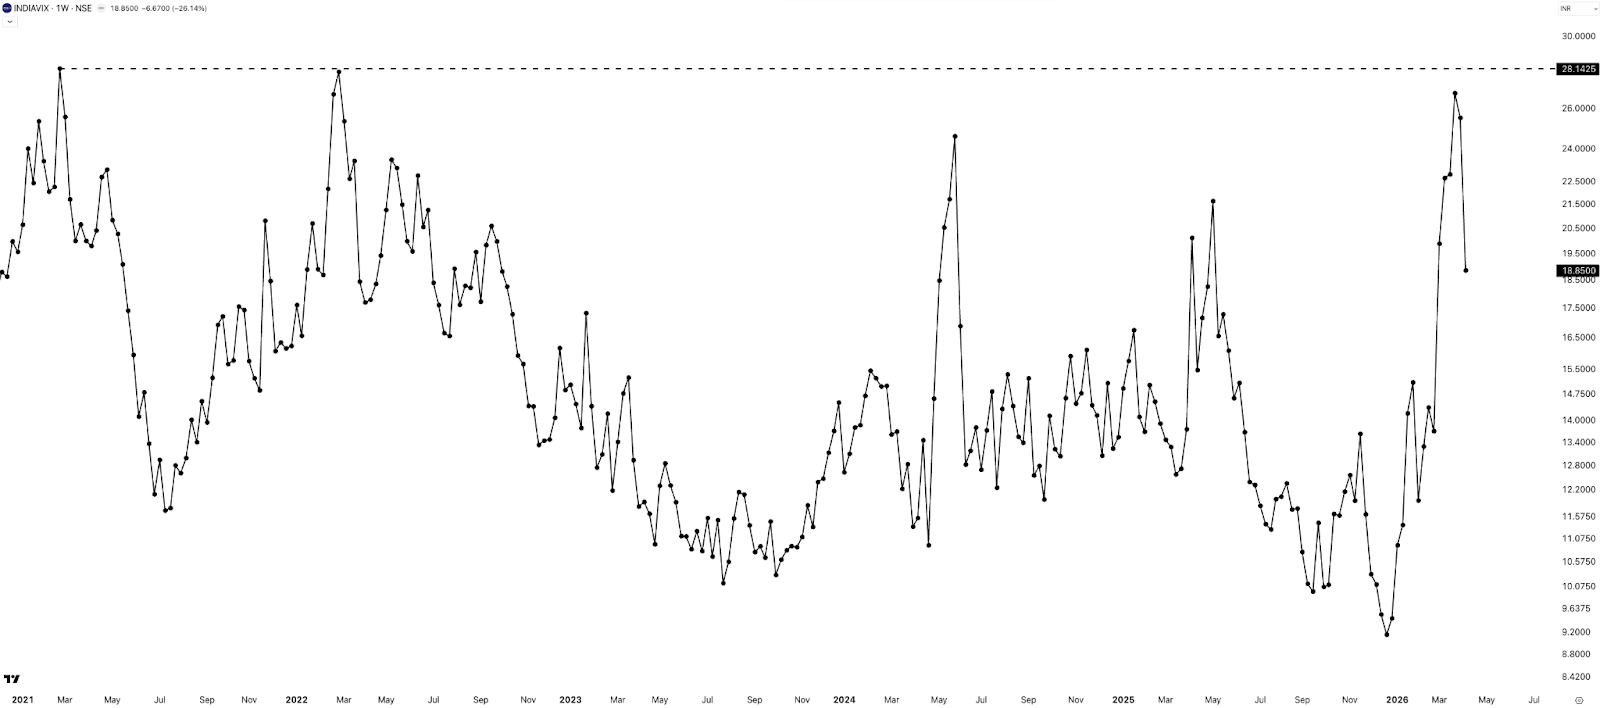
VIX saw a massive drop of 26% this week, finally closing below 20 at 18.85. This market upmove definitely helped cool things down.
Hopefully, this is the start of the VIX returning to its mean — meaning we should see volatility gradually fall while the market steadily rises. Usually, these periods where the VIX cools off are great for short vol traders. Let’s see, fingers crossed. I wish trading was that simple, but for now, staying hopeful.
Sectoral Performance
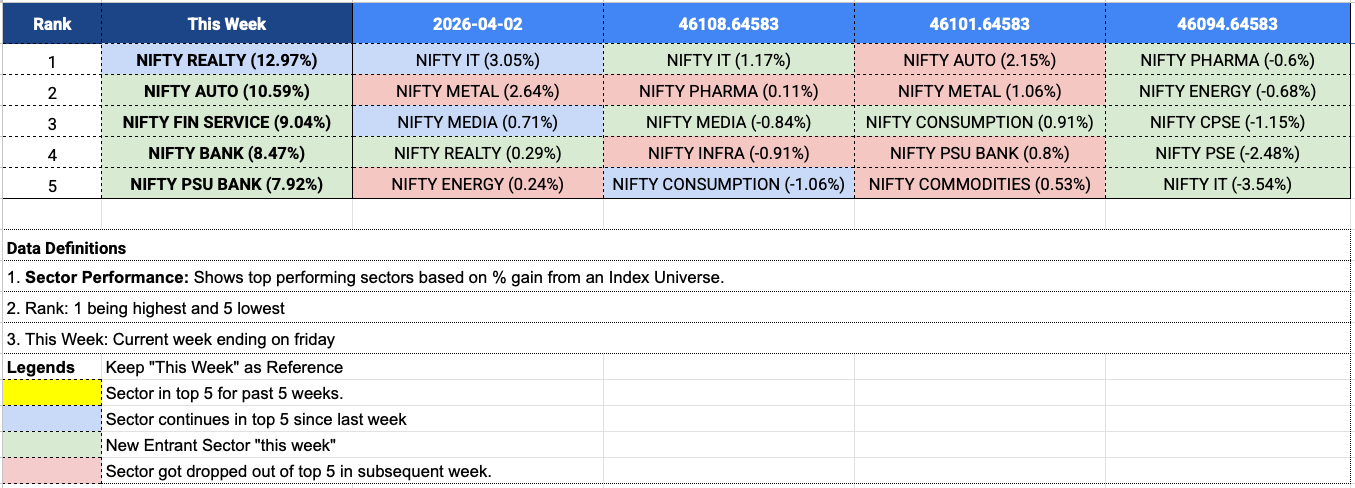
This week’s sectoral performance is definitely worth looking at. Realty topped the charts at 12.97%, followed by Auto at 10.6%, FinServ at 9%, Bank Nifty at 8.5%, and PSU Bank at 8%.
It’s been a long time since we’ve seen numbers like these in sectoral charts. If you are an equity trader, these are the sectors worth watching. Usually, there’s some kind of trend persistence in sectors — it plays out for a few weeks at least before the cycle changes and other sectors come in.
For instance, IT was trending up for the past couple of weeks, and then this week, with all the positivity around, Realty kind of came back. We may see the IT cycle back again. Let’s see.
Commodities
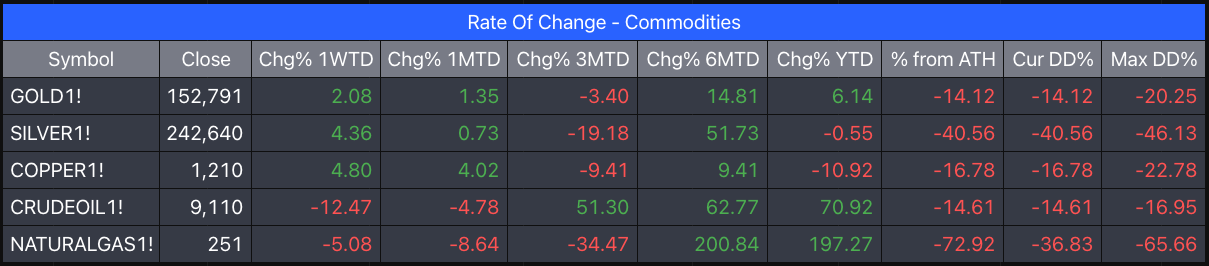
The leaders of the pack this week: Industrials (copper) at 4.8%, silver at 4.36%, and gold at 2.08%.
With the uncertainty around the war settling down, crude is now down by close to 12%, and natural gas is down as well by 5%. As I’ve always said, crude and natural gas are both extremely mean-reverting products — if they shoot up, many macro pressures usually bring them back down.
Summary
After six consecutive red weeks, markets finally saw a strong bounce, with Nifty gaining close to 6% and Bank Nifty leading from the front with an 8%+ move. The recovery was sharp, driven largely by mid-week momentum and sustained follow-through.
Volatility cooled off meaningfully, with VIX dropping below 20, and sectorally we saw strong participation from Realty, Auto, and Financials — indicating a clear risk-on phase.
That said, while sentiment has improved, markets are still near key resistance levels, and it remains to be seen whether this is the start of a fresh uptrend or just a relief rally.
What Caught My Attention This Week
- Read: My Quest to Solve Bitcoin’s Great Mystery — New York Times, by John Carreyrou and Dylan Freedman. The authors spent two years investigating who the person behind the name Satoshi Nakamoto really is. No spoilers here. And yes, in case you follow crypto, do also check out the two-part series on Crypto in India.
- Listen: The Knowledge Project — an interview with Vlad Tenev, Founder and CEO of Robinhood Markets. Vlad talks about everything from his childhood in hyper-inflationary Bulgaria to a future where AI agents may handle 100% of customer finances.
Events to Factor In
Next week is a four-day trading week — Tuesday, 14 April, is a holiday in observance of Dr. Babasaheb Ambedkar Jayanti, which moves the Nifty weekly expiry from Tuesday to Monday, 13 April . Other than this, there are no known events lined up.
With that, we wrap up this week’s Weekly Market Metrics.
If you find this series useful, don’t forget to subscribe to the channel - and yes, do share it with your friends.
Until then — stay curious, stay steady, and enjoy your long weekend.