Welcome to another edition of Weekly Market Metrics. I am Sandeep Rao, and we’re now in Week 16 of 2026.

It was one of those unusual weeks where two very different worlds lost their giants — one from the world of investing, especially emerging markets: Mark Mobius. And one from the world of music: Asha Bhosle. In that sense, it hasn’t quite been the best of weeks.
On the geopolitical front, though, there are some signs of progress — conversations around a potential ceasefire, with figures like JD Vance engaging in regional diplomacy, including a visit to Pakistan. And interestingly, despite all of this — or perhaps because of it — the market seems to be holding up quietly, absorbing the noise. Also, technically speaking, all indices are now trading above their 50 EMA on the daily timeframe, which could be seen as a bullish sign.
Before We Get to the Charts — A Data Point Worth Noting
Nifty Forward Returns After 15%+ Drawdowns — 20-Year Study
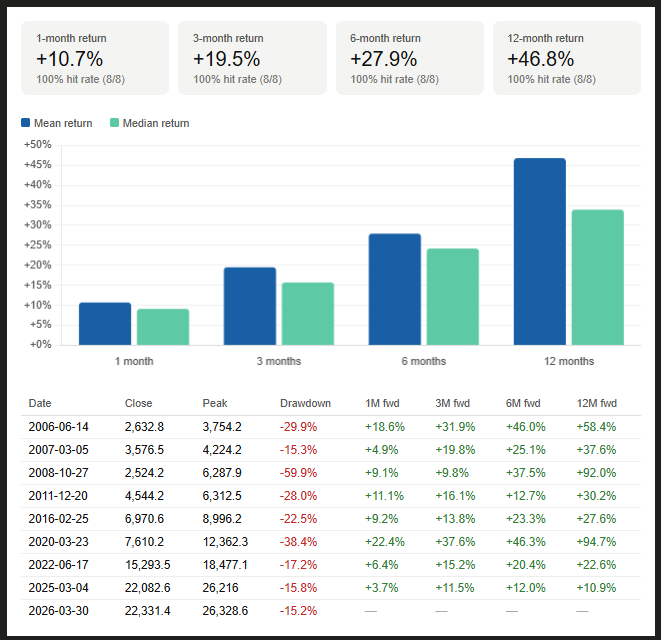
What this analysis does is identify all historical drawdowns over the past 20 years that were greater than 15% — every instance where the market corrected by 15% or more. From there, a simple question: what happens after the market bottoms out?
The forward returns from that low point — one month, three months, and beyond — have largely been positive across time frames.
A quick word of caution, though: this does not mean the market has necessarily bottomed. It’s entirely possible that what we’ve seen so far is just an initial drawdown, and there could be a deeper correction ahead. That’s exactly how larger drawdowns — 25%, 30%, even 50% — eventually play out. So while this data gives us useful context, treat it as a perspective, not a prediction. It tells us what has happened in the past — not what will happen in the future.
Section 1 — What Happened Last Week
Rate of Change (ROC) Across Indices

This week, all four indices closed in the green once again, marking two back-to-back weeks of gains. While this week wasn’t quite as explosive as the last — where Nifty surged 6% — it still posted a solid 1.26%. Midcap Nifty was the standout performer at 3.23%, while Bank Nifty and Sensex both finished up nearly 1.2%.
For April, the recovery has been impressive. Bank Nifty and Midcap Nifty have already delivered double-digit returns, with Nifty and Sensex trailing just behind, up nearly 9%.
In terms of the bigger picture, Nifty, Sensex, and Bank Nifty are still about 8–9% away from their all-time highs. Midcap Nifty, however, is the clear leader — sitting less than 2% away from its peak.
Following such a powerful move last week, another green closing this week confirms that the momentum is actually sustaining week-on-week.
NIFTY
Weekly
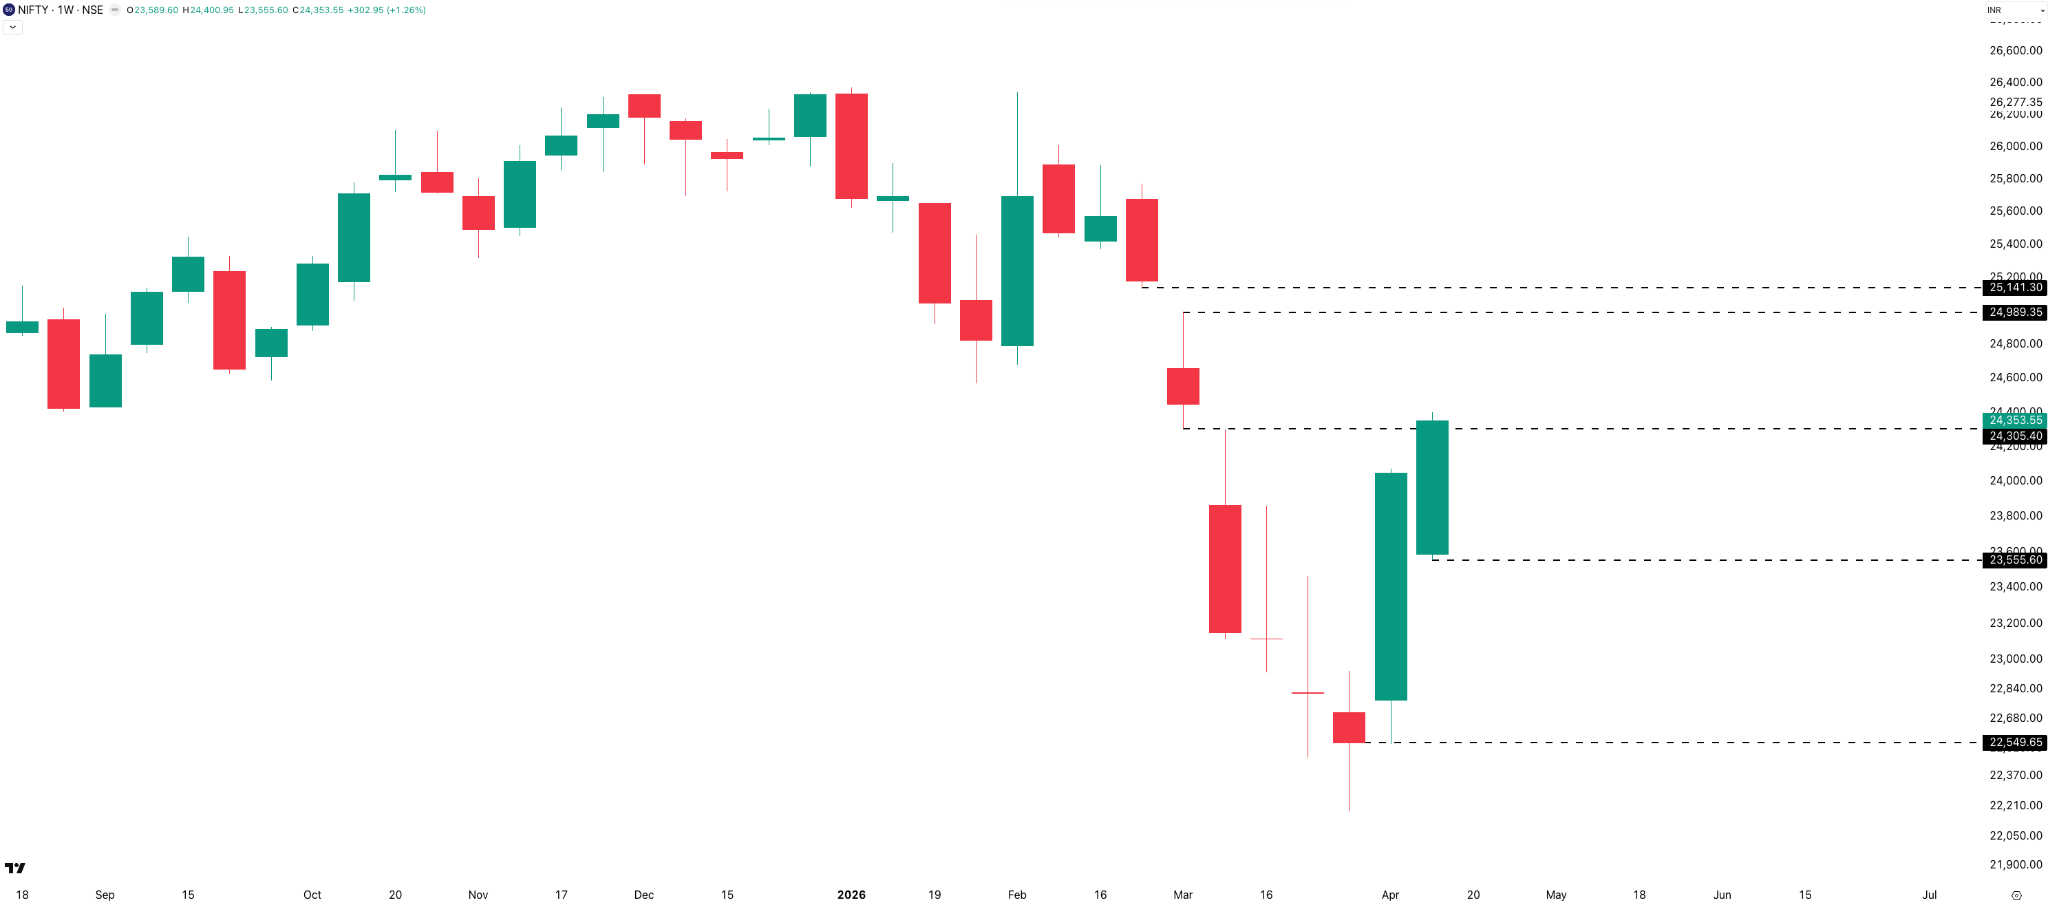
Following last week’s Marubozu candle, Nifty managed to close above its first weekly resistance of 24,300, ending the week at 24,354 — a gain of about 303 points, or 1.26%.
Interestingly, the weekly range shrunk significantly — from 1,531 points down to just 845. This is a clear sign that volatility is cooling off as the market moves higher. We’re seeing this reflected in the daily numbers too: the 10-day average daily range was 361 last week, but has now dropped to 260.
Daily
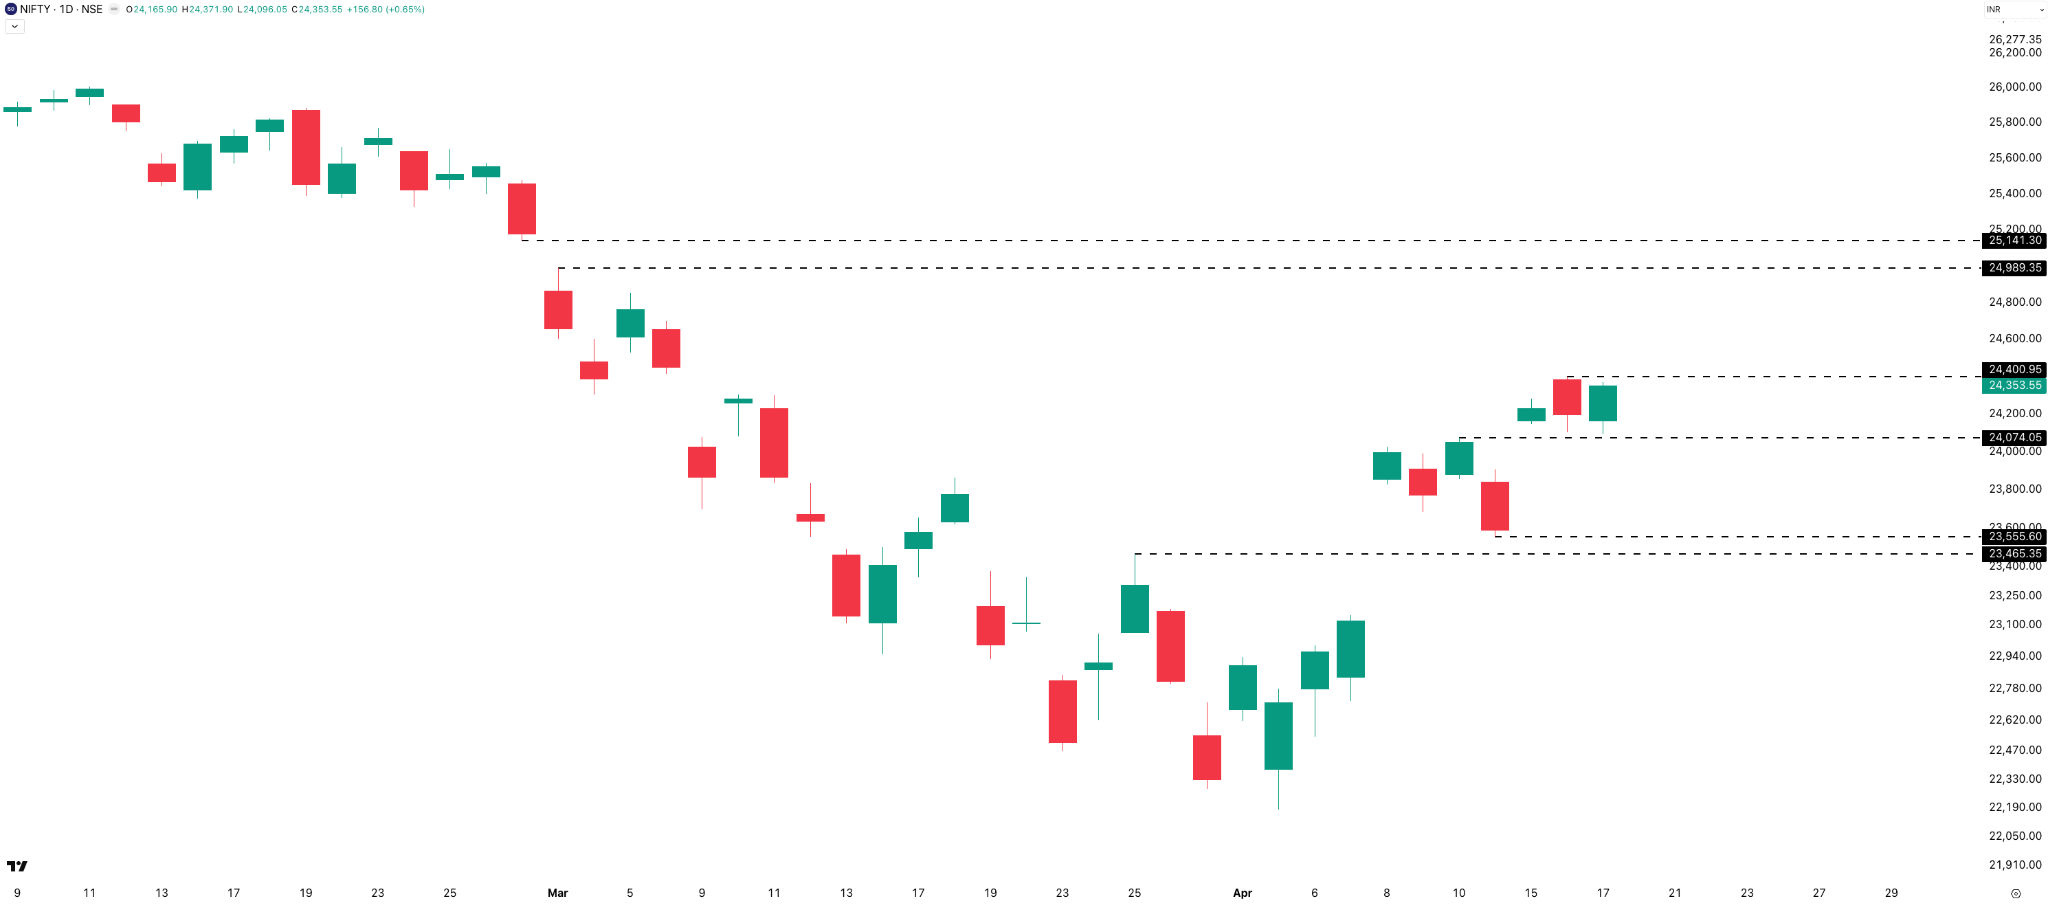
We saw a split with two green and two red candles in this shortened four-day trading week. Monday started down 0.86%, followed by a strong Wednesday at +1.63%, with 1.35% of that coming in the form of an overnight gap. Thursday saw a minor dip of -0.14%, and we closed the week on Friday up 0.65%.
It’s worth noting that while 1%-plus moves were the norm over the past few weeks, we’re seeing them much less often now. Daily ranges have stayed relatively tight — Monday’s range was 352 points, but Wednesday narrowed to just 135 points, followed by 300 points on Thursday and 276 on Friday.
Hourly
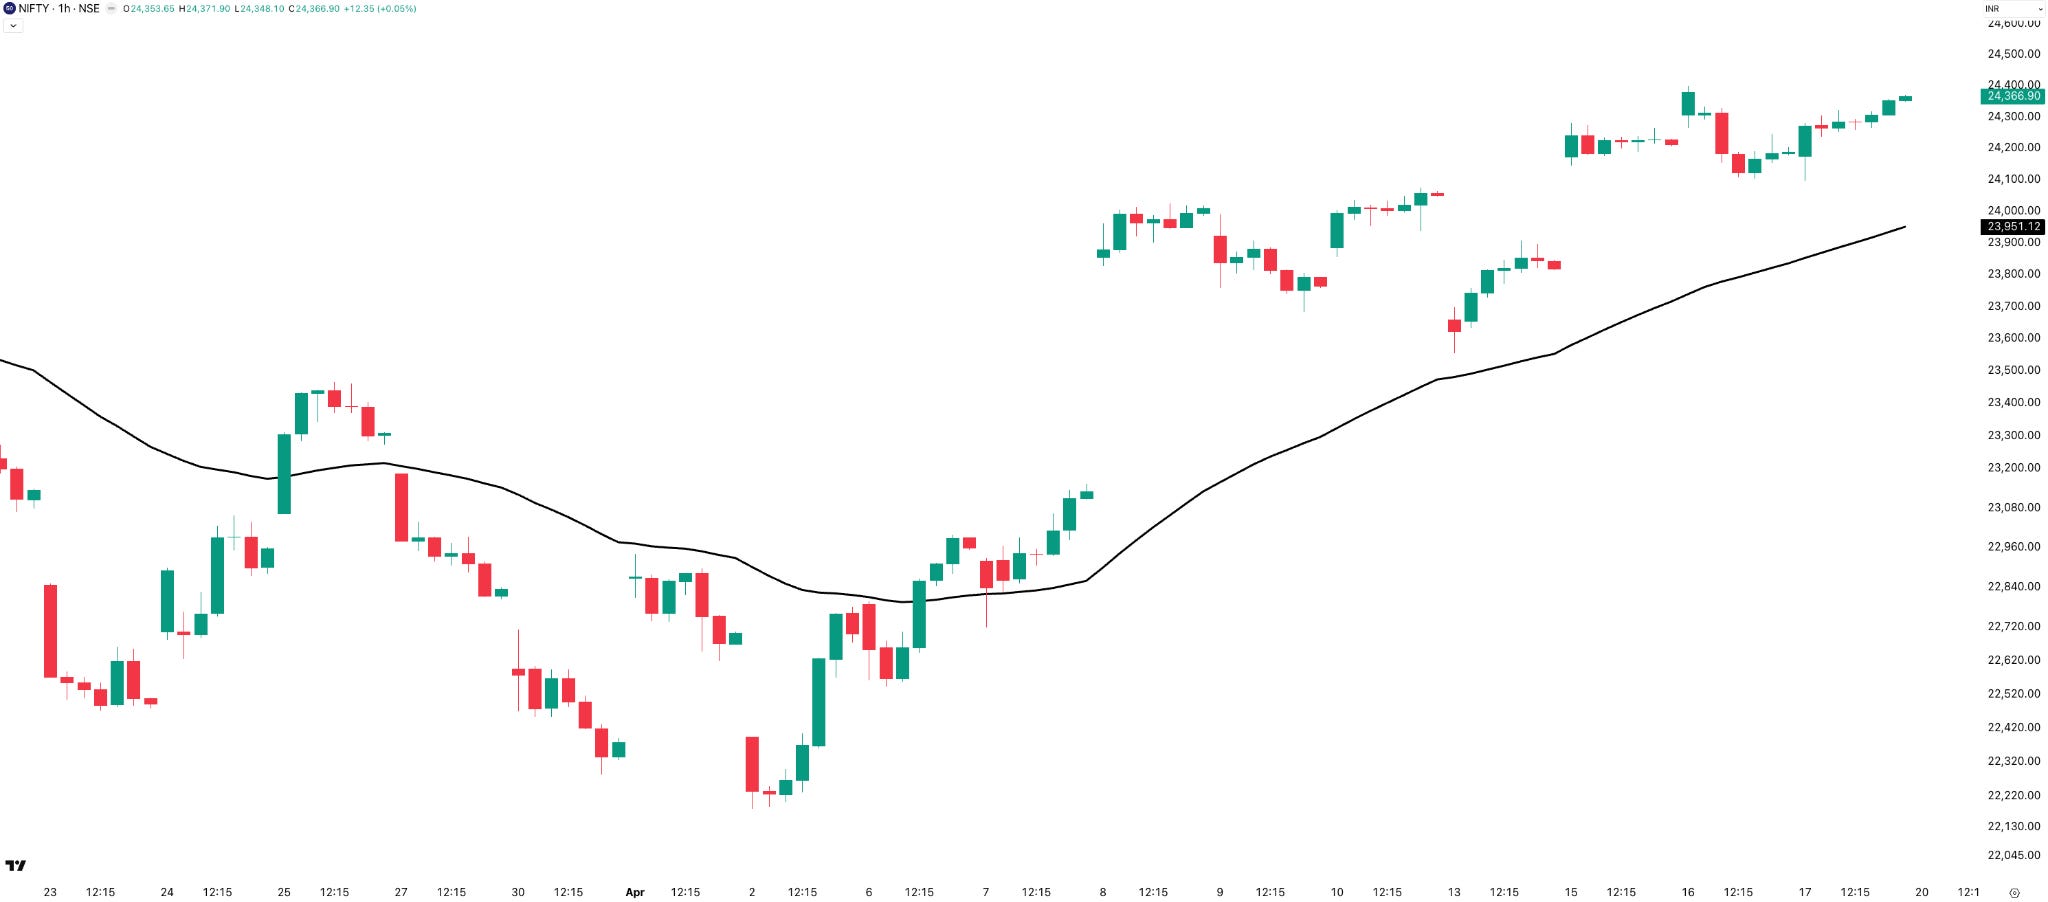
The index stayed above the 50 EMA throughout the entire week. Even with Monday’s gap-down opening, the EMA held firm and wasn’t breached. Short-term trend followers have really been in the sweet spot, continuing to pull in good gains all through April.
Last week, the question was whether the EMA would catch up to the price or whether price would pull back to the EMA. So far, we’re seeing the EMA catch up to the price — hoping that trend continues into next week as well.
Nifty Weekly Expiry — Monday, 13 April
The expiry opened with a significant 1.8% gap down, but surprisingly, the ATM straddle opened at a premium of just 186 points — even a gap of that size didn’t manage to spike the premiums. With a starting straddle of 186 points, the actual daily range ended up being 352 points. The one saving grace for traders was the clean price action — the index trended upward steadily without any major pullbacks. It was a tough session for non-directional sellers, but a great day for anyone playing the direction, whether buying or selling.
SENSEX
Weekly
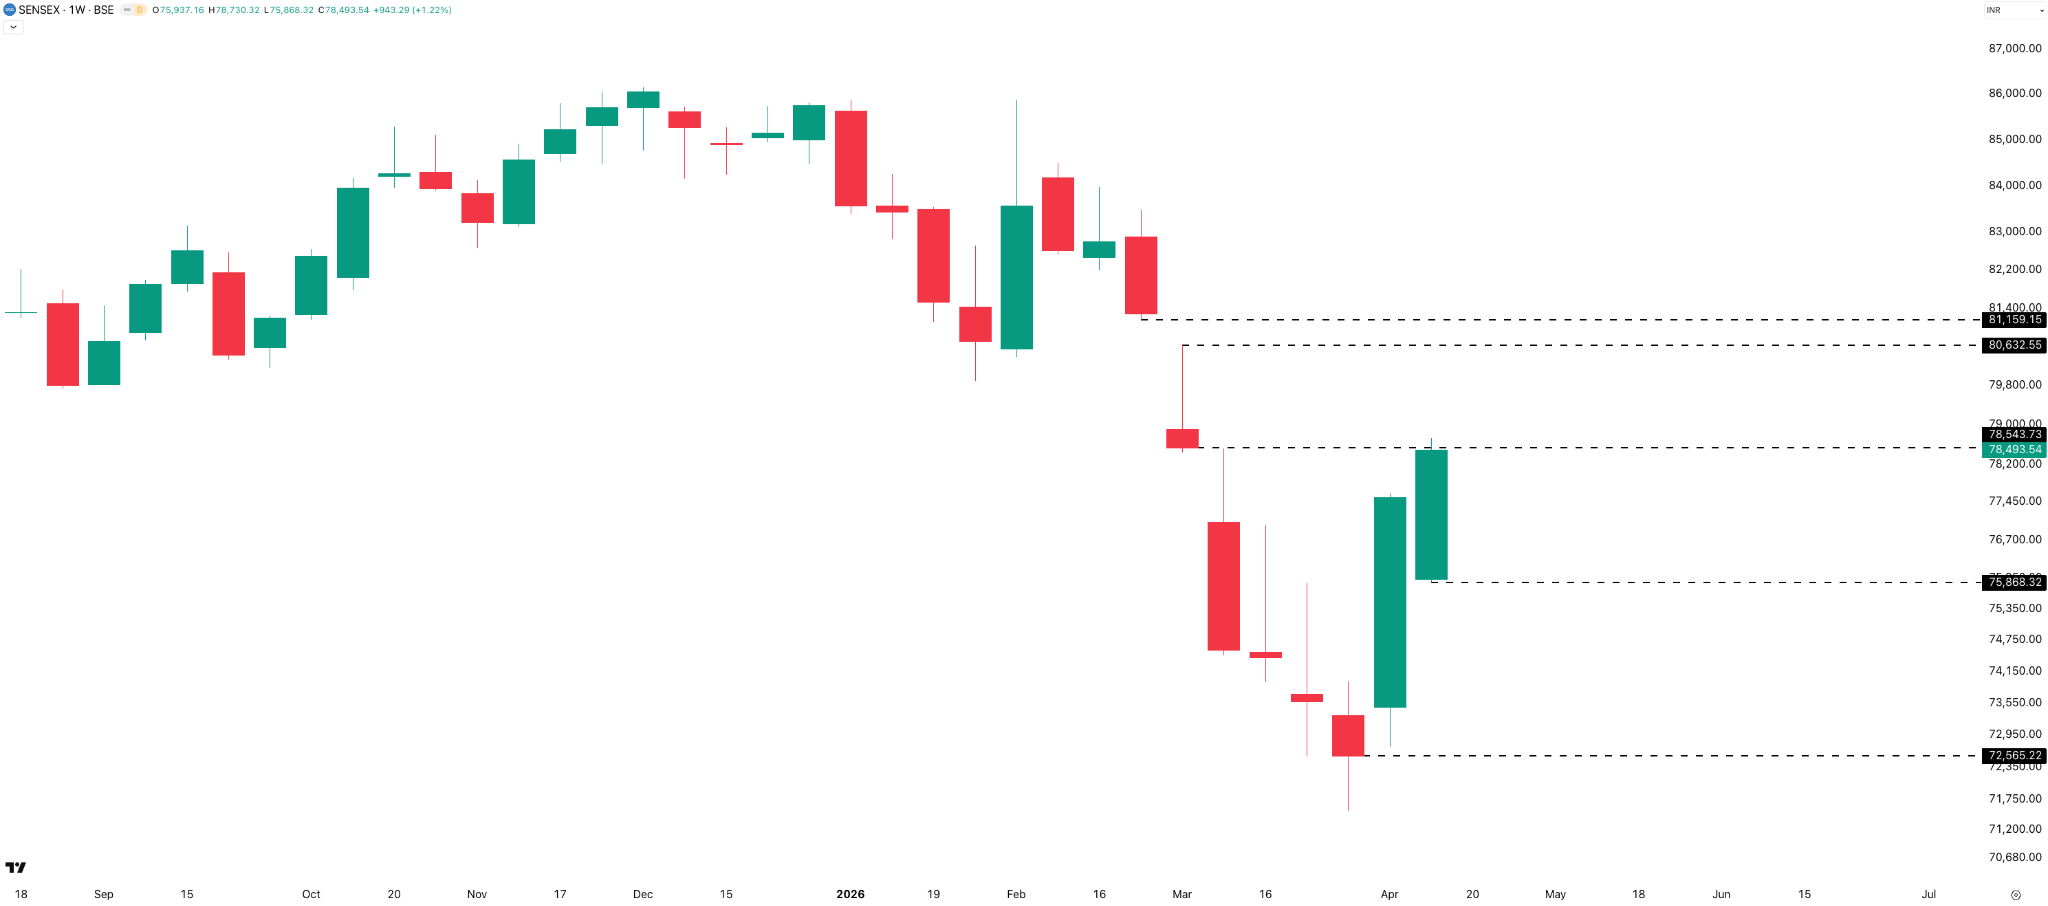
Similar to Nifty, the Sensex weekly candle closed right near that 78,550 resistance level, gaining 943 points or 1.22% to end near the 78,500 mark. Volatility cooled off here as well — the weekly range contracted significantly, dropping from last week’s massive 4,900 points to 2,862 points.
Daily
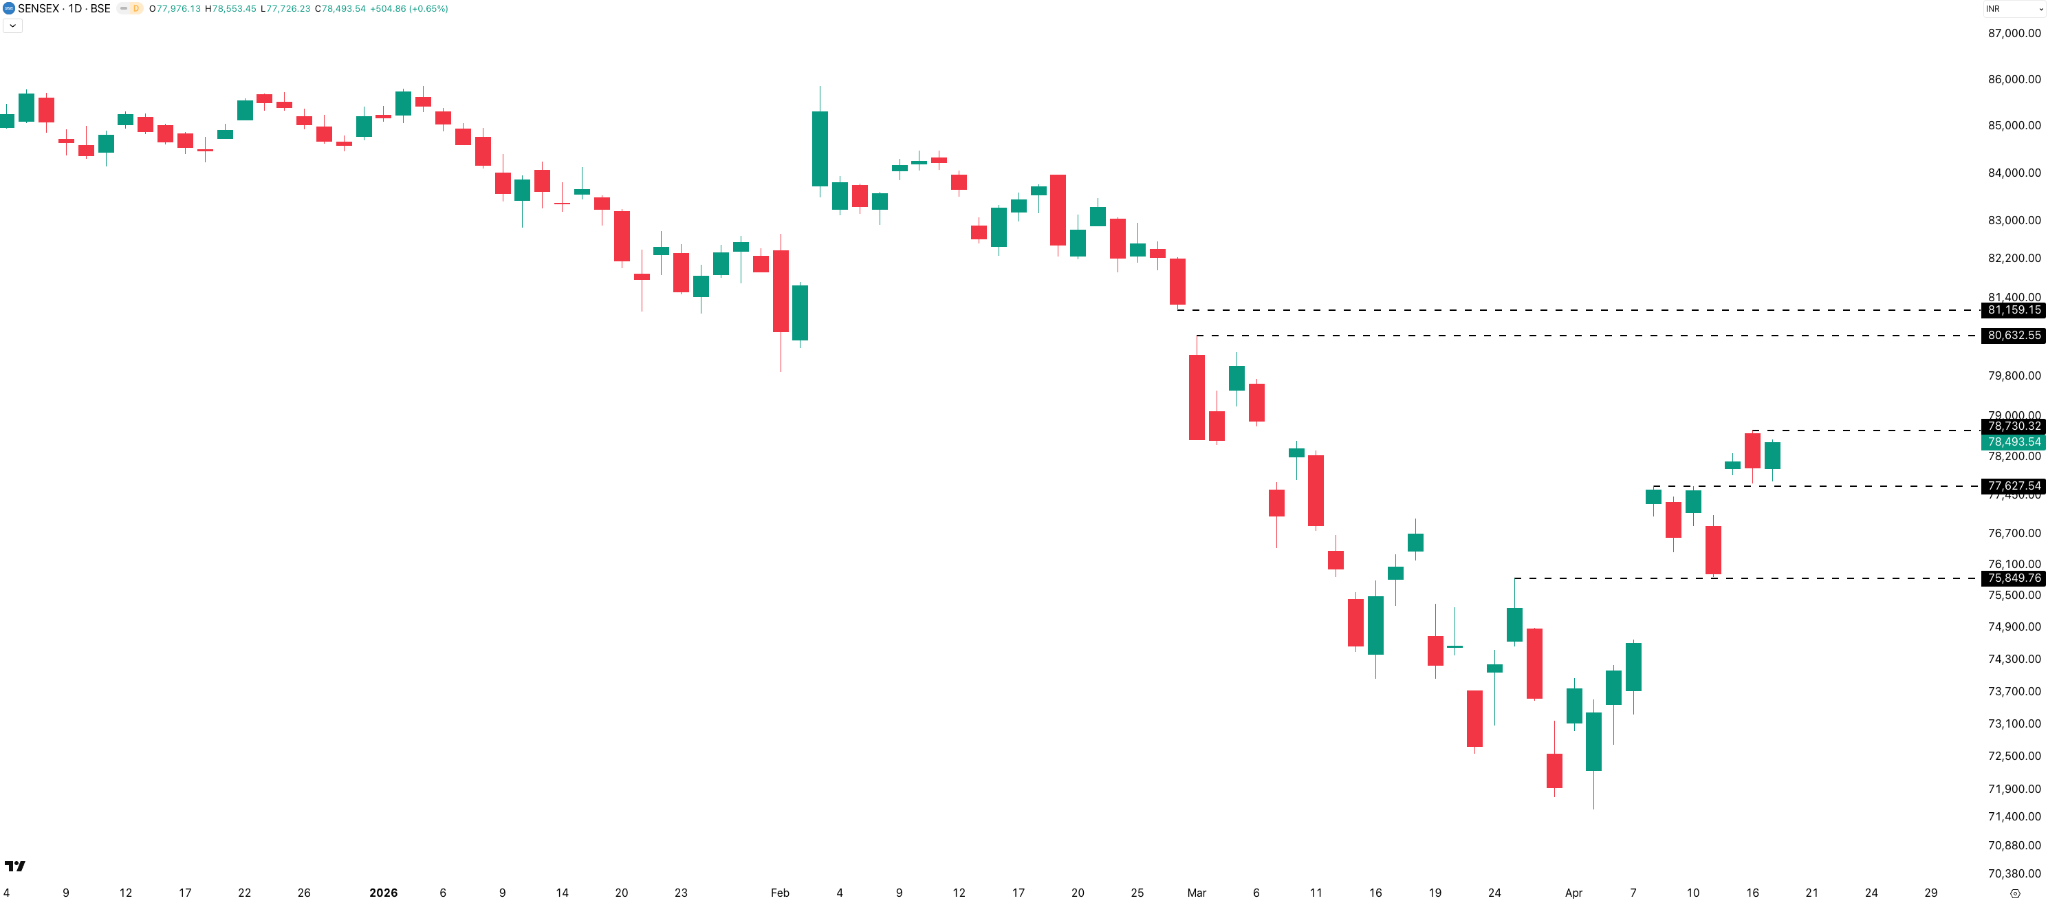
Sensex managed only one day with a move of 1% or more — Wednesday — and even then, most of that gain came from the overnight gap. For the other days of the week, price action was much more contained, with moves staying well under the 1% mark each day.
Sensex Weekly Expiry — Thursday, 16 April
The ATM straddle opened at 411 points, but the actual day range was much wider at 1,055 points. Similar to the Nifty expiry, it was a downtrending day, but the volatility post-11:30 AM was incredibly sharp — a 600-point drop in just two hours, followed by a 500-point recovery by 3 PM, only to see another 300-point slide in the final 30 minutes. Despite those wild swings, it was still a manageable expiry for time-based straddle/strangle sellers who managed to get their positions in early.
BANK NIFTY
Weekly
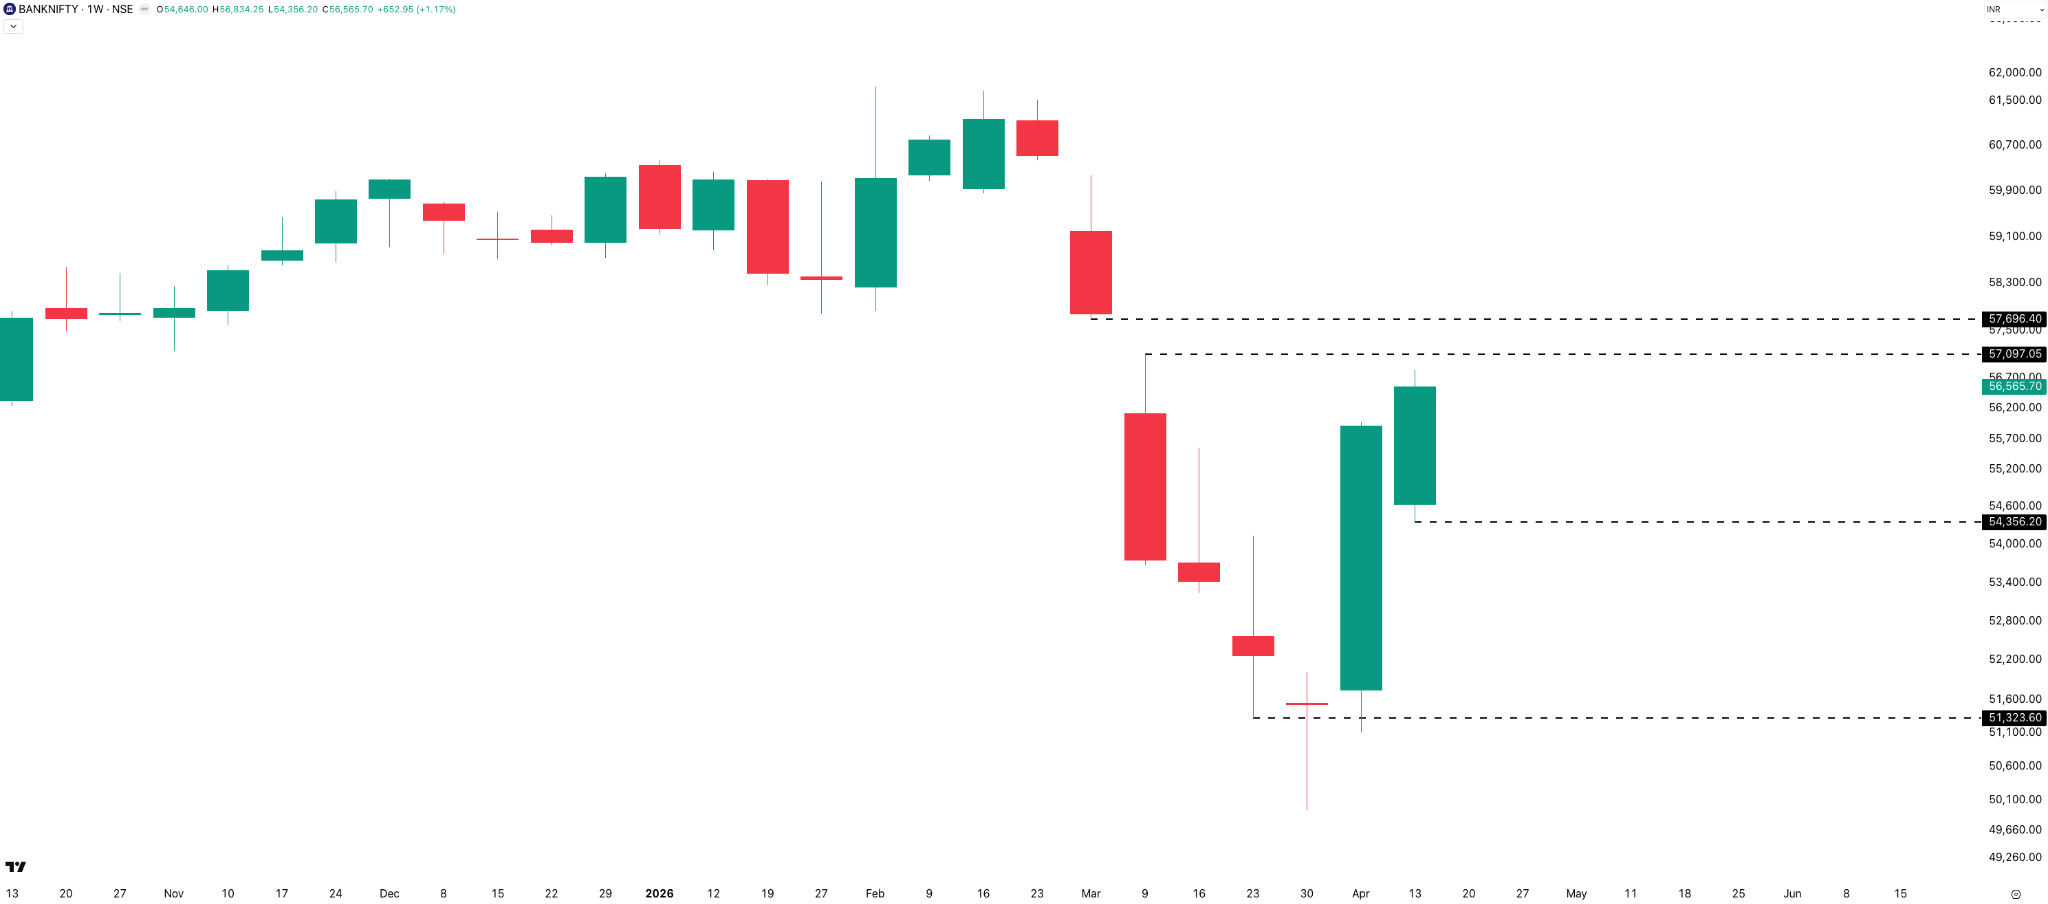
The index gained 653 points, or 1.17%, for the week, closing at 56,566 — a solid follow-up green candle after last week’s massive move. The weekly range also cooled off significantly, dropping to 2,478 points from last week’s 4,867-point range.
Daily
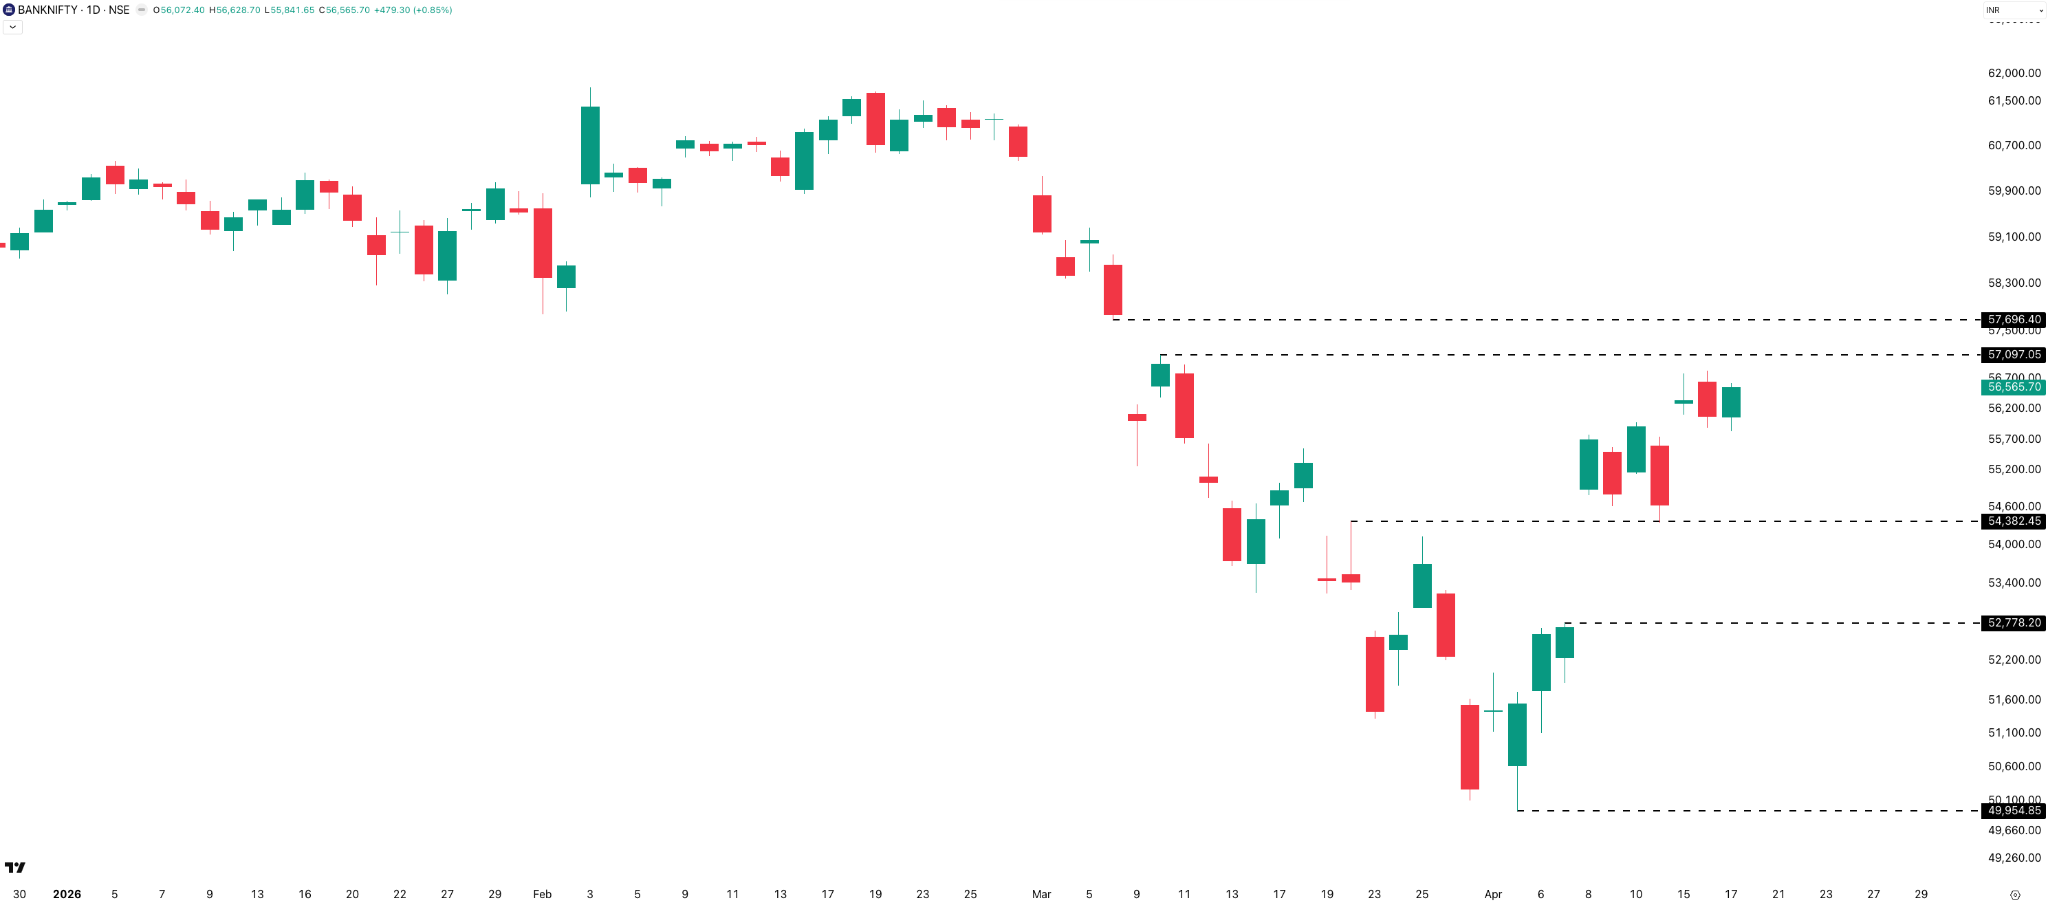
Bank Nifty found resistance around the 56,850 level. The daily candle patterns are similar to those of Nifty and Sensex, with the index finding support at the 54,350 level.
Hourly
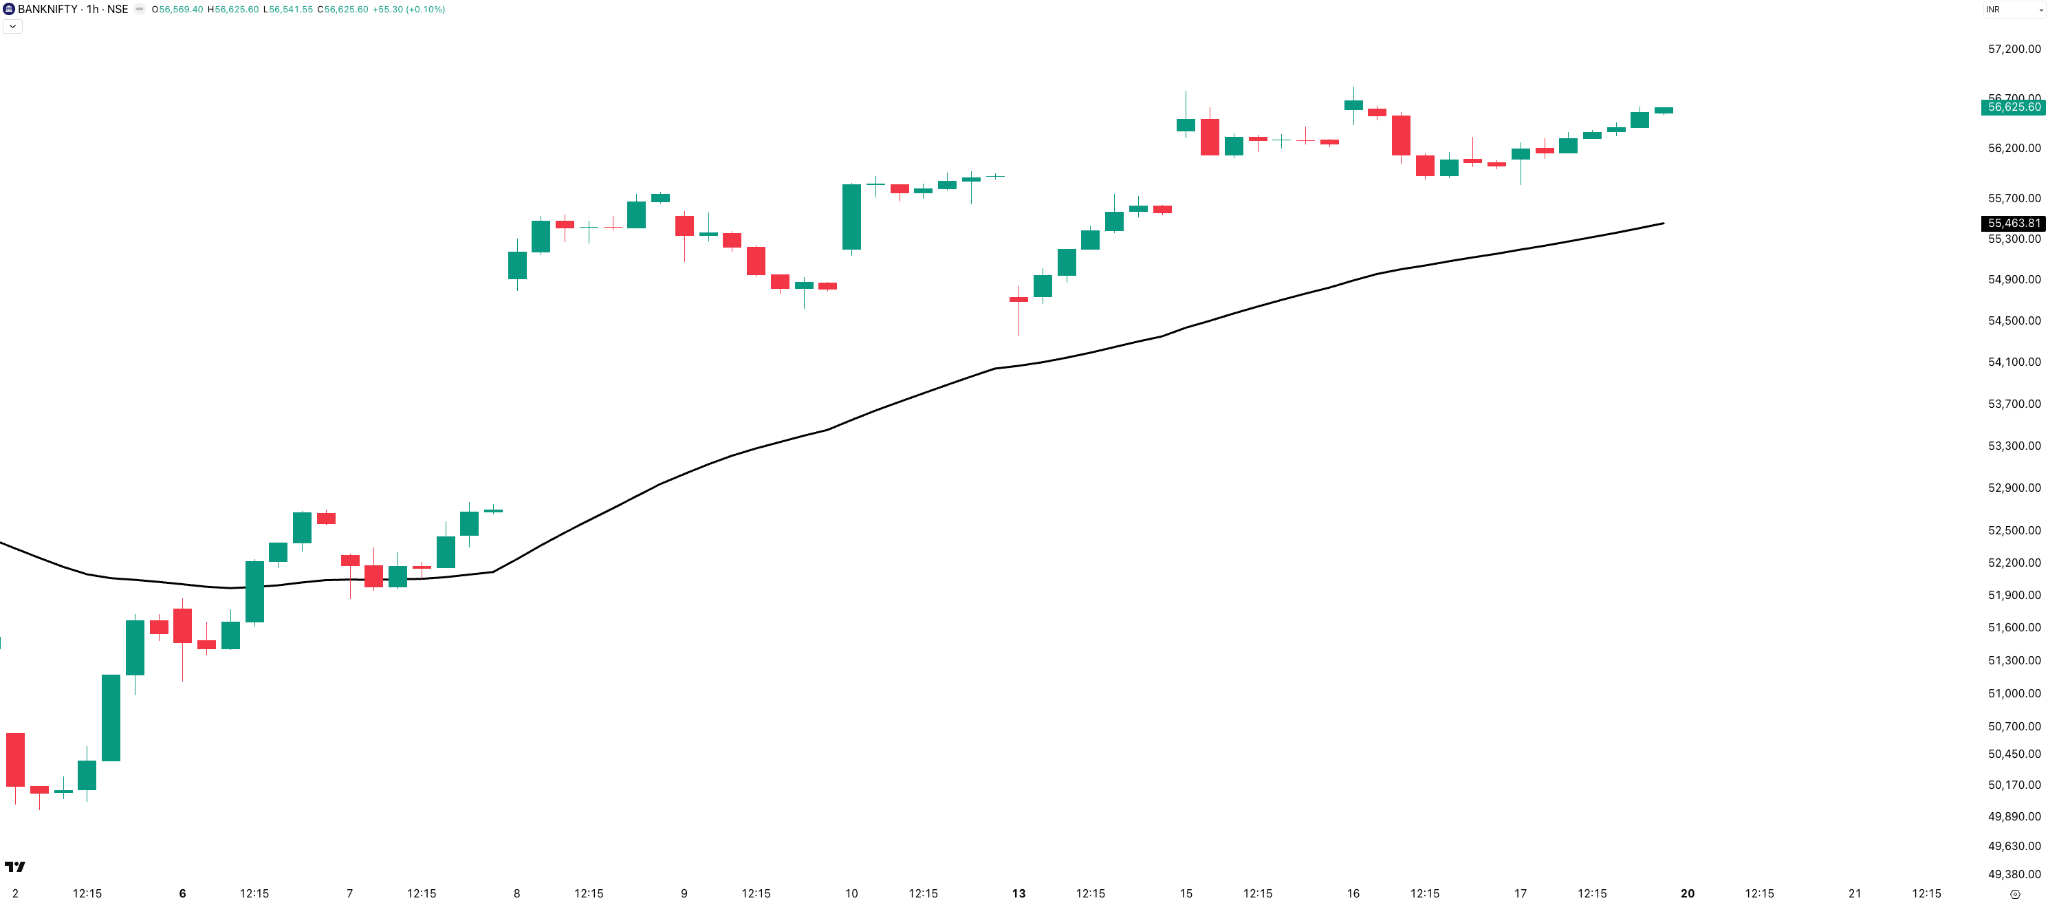
Bank Nifty stayed above the 50 EMA the entire week. There were some pullbacks toward the EMA on Monday, but the index never breached it. The short-term trend-following bias for both Nifty and Bank Nifty remained long for the entire week, and it continues to stay the same.
Section 2 — What to Expect in the Coming Week
NIFTY
On the weekly charts, resistance sits in the 25,000–25,150 zone. Immediate support is at 24,300, followed by this week’s low at 23,550, and then further down at 22,550.
On the daily timeframe, immediate resistance is at 24,400 (the current week’s high), followed by the 25,000–25,150 zone, consistent with the weekly view. Support is placed at 24,100, and then in the 23,550–23,450 zone.
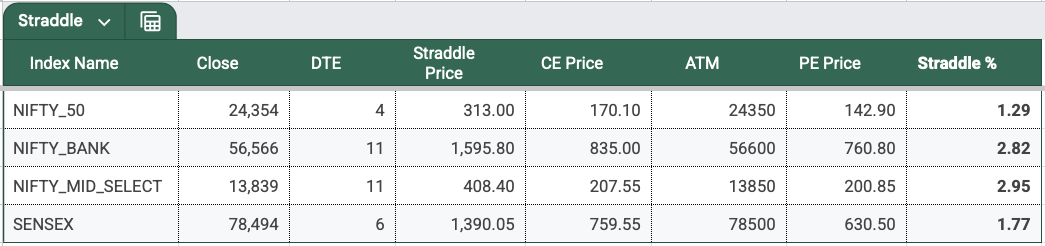
Based on the straddle price, the expected range for the upcoming Nifty weekly expiry on Tuesday, 21 April, is between 24,667 and 24,041 .
The overall bias for Nifty is bullish, given we have secured a follow-up green candle after the strong up move seen last week. Momentum appears to be holding as we head into the next expiry cycle.
SENSEX
The straddle premium suggests a range of about 1,400 points in either direction, giving us a rough playing field between 79,884 and 77,104 .
On the weekly chart, immediate resistance is at 78,550, followed by a major zone between 80,650 and 81,150. For support, we’re looking at this week’s low at 75,900 and then at the 72,700–72,500 area.
On the daily chart, resistance is at 78,730 and then at 80,600. Supports are placed at 77,600 and 75,850.
Just like Nifty, the overall bias for Sensex remains bullish heading into the new week.
BANK NIFTY
On the weekly chart, the 57,100–57,700 zone is where the resistance sits. Supports are at 54,350 (this week’s low) and further down at 51,300.
On the daily timeframe, the gap zone between 57,100 and 57,700 is the key area to watch — it should act as strong resistance. Supports are located at the 54,350–54,400 zone and at 52,800.
Directional Bias Summary
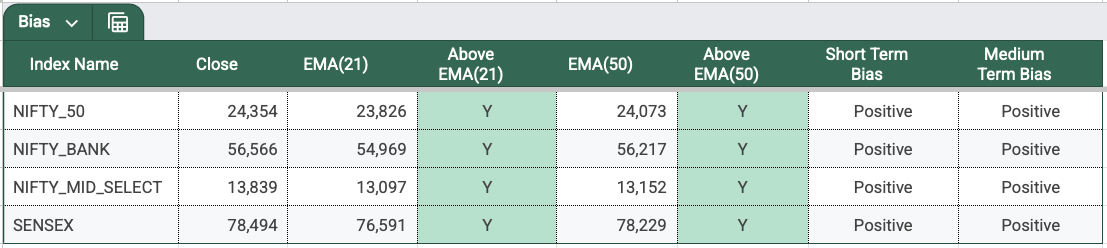
Looking across the board, all four indices now show a positive short-term as well as medium-term bias. All indices are trading above their 21 and 50 EMAs on the daily timeframe. After a long time, we are finally seeing strong bullish momentum return to the markets.
India VIX
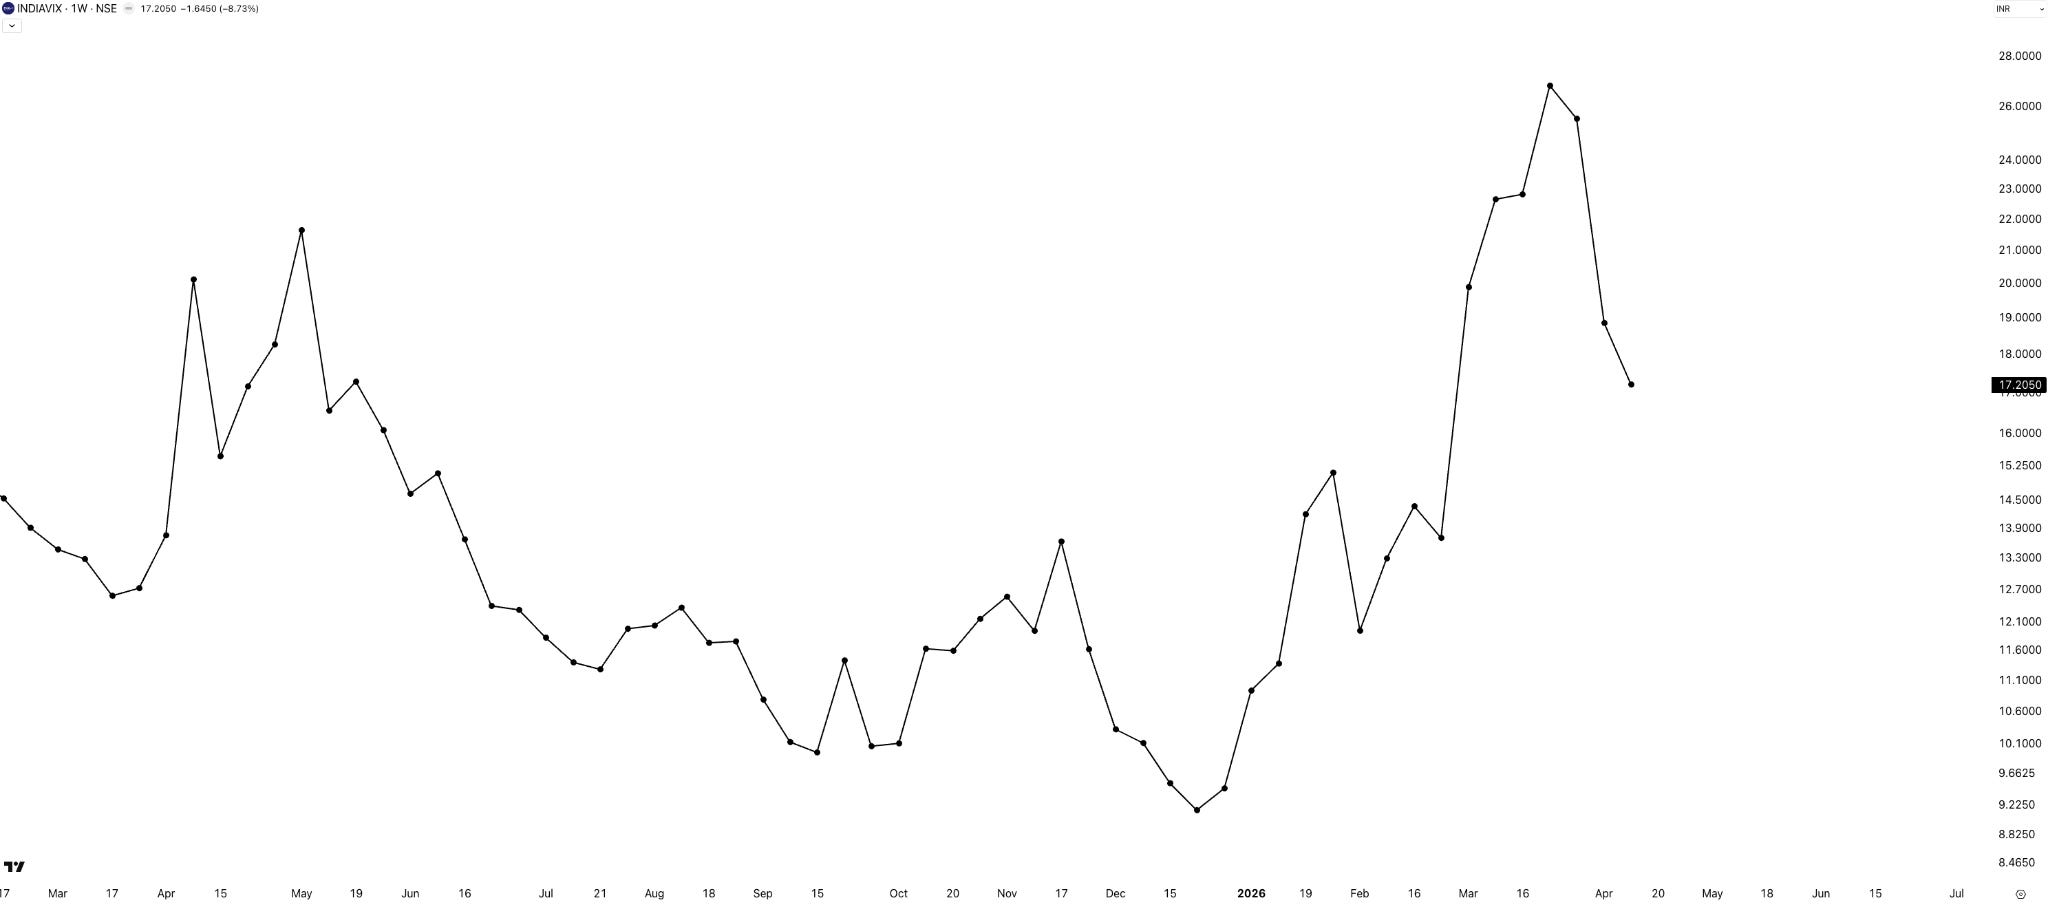
As we have seen volatility cooling off in intraday and weekly ranges, India VIX confirms the same — it dropped by 9% to close at 17.2.
VIX is finally reverting to its mean. A VIX cool-off is typically a good period for short-volatility options traders. Let’s see how it goes this time.
Sectoral Performance
Before getting into this week’s numbers, here’s a broader look at how sectoral trends have been shaping up over time — from Week 1 all the way to Week 16.
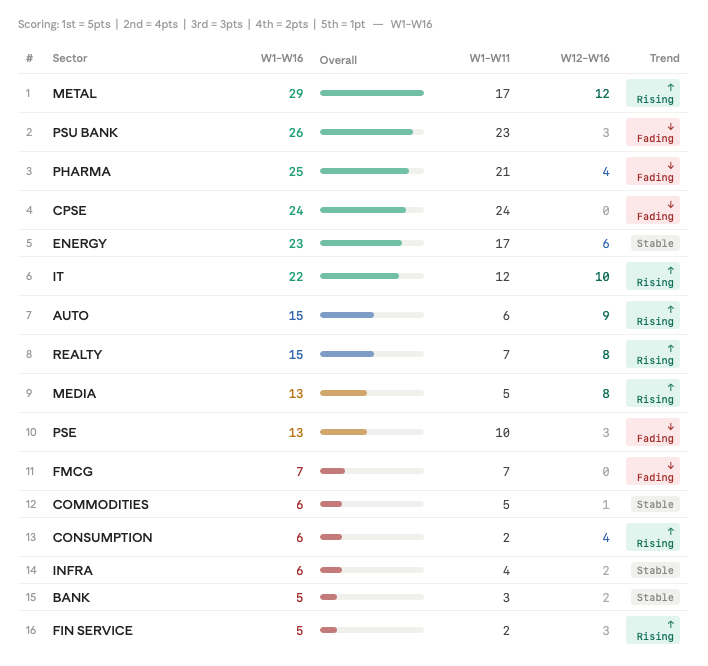
The data is split into two phases: Week 1 to Week 11 (the earlier phase) and Week 12 to Week 16 (the more recent phase). Rather than just counting appearances in the top 5, a weighted scoring system was applied — Rank 1 gets more weight than Rank 5 — to actually measure strength of performance, not just frequency.
A few observations worth noting: PSU Banks and CPSE stocks had strong cumulative scores of 23 and 24 earlier in the year — among the top performers — but in the recent phase, those scores have dropped significantly to around 3 and 0 respectively. On the other hand, Metal and IT currently top the list, followed by Auto, Realty, Media, and a few others.
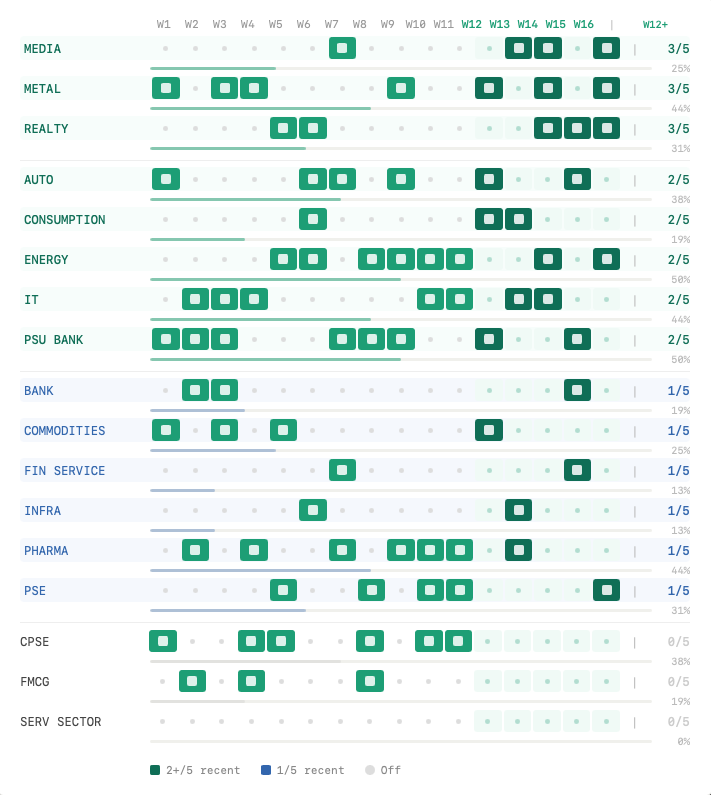
The sectors highlighted in green are the ones gaining momentum right now — worth watching if you’re tracking sectoral rotation or looking for stock ideas.
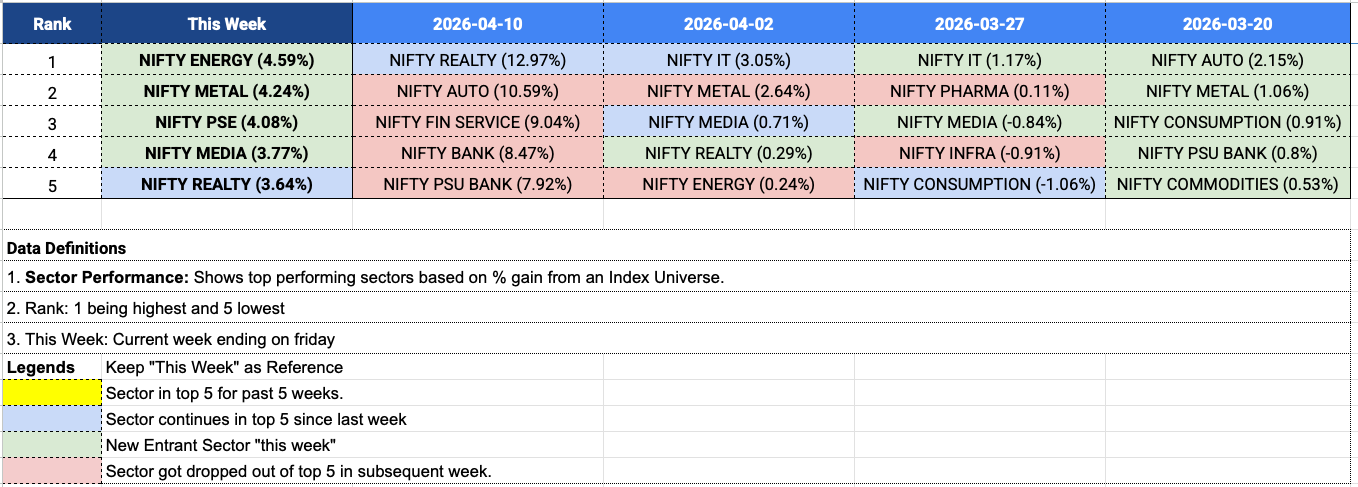
This week’s top performers: Energy led the way at 4.59%, making a comeback after a week’s pause. Metal followed at 4.24%, also returning after a brief absence. Then PSE at 4.08%, Media at 3.77%, and Realty continuing from last week at 3.64%.
Commodities
A data observation before the numbers: a simple monthly correlation check between Gold and Nifty, using end-of-day data, throws up something interesting.
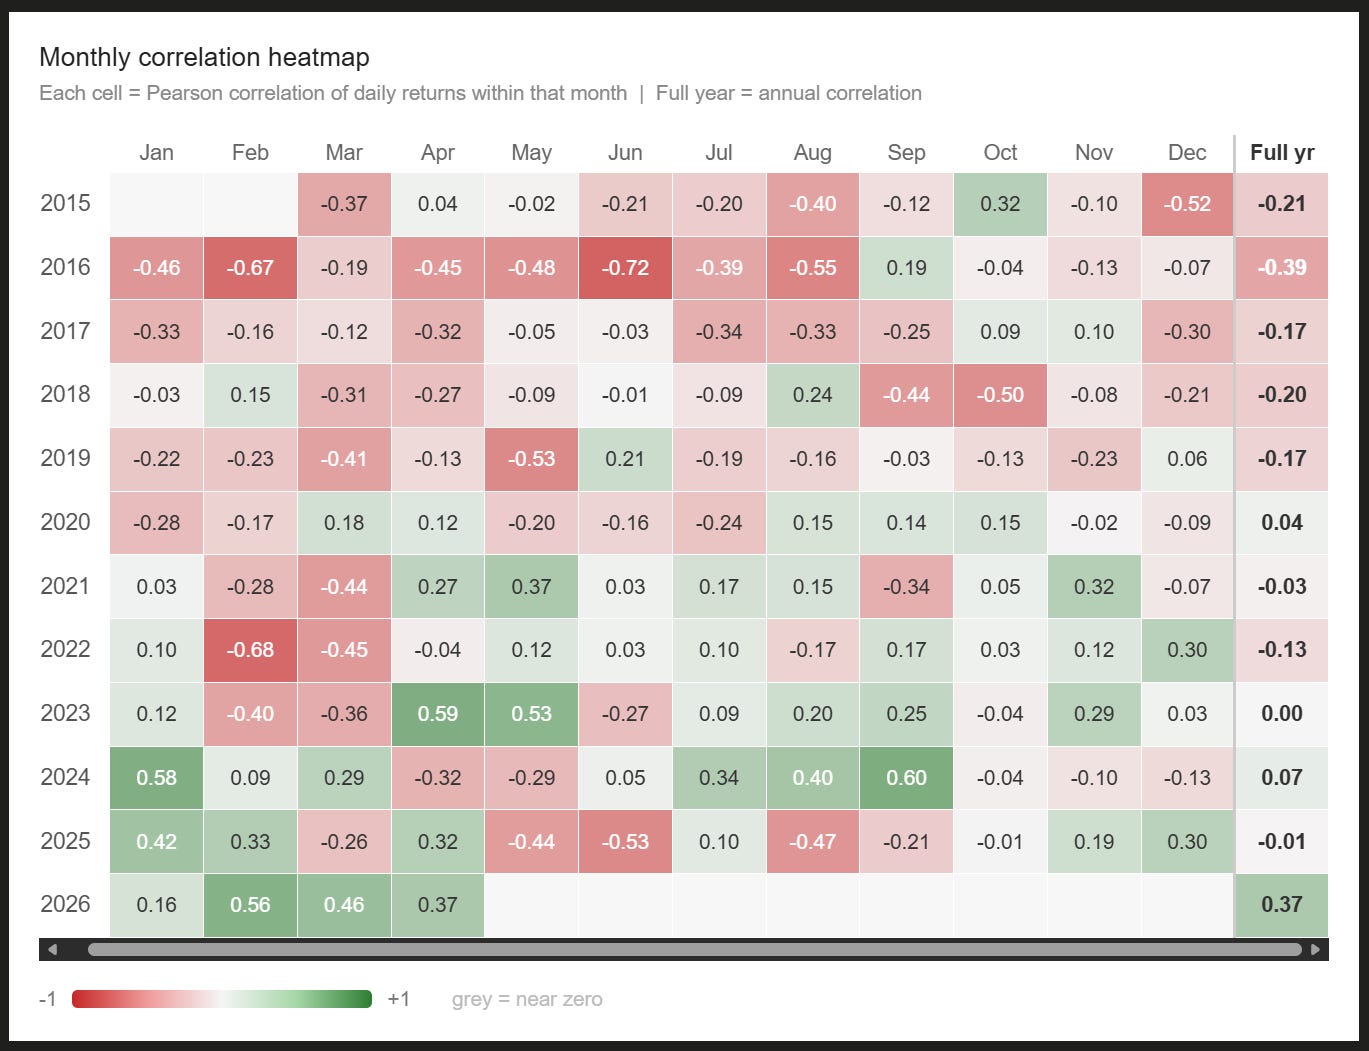
In earlier years — say March 2015 — the correlation was around -0.37, a mildly negative relationship: when Nifty went up, Gold tended to move down, and vice versa. But that relationship has been shifting. Looking at full-year correlations and moving toward recent data — particularly from late 2024 into 2025 and now 2026 — the correlation has increasingly turned positive. Gold and Nifty have been moving in the same direction more often than not.
Historically, this hasn’t been the dominant behaviour. Pre-2020, you would see more mixed or even negative correlations. Post-2021, however, these positive correlation phases seem to be showing up more frequently. This is purely a data observation — not a macro or fundamental view. If you have a perspective on why Gold and Nifty seem to be moving more in sync in recent years, share it in the comments.
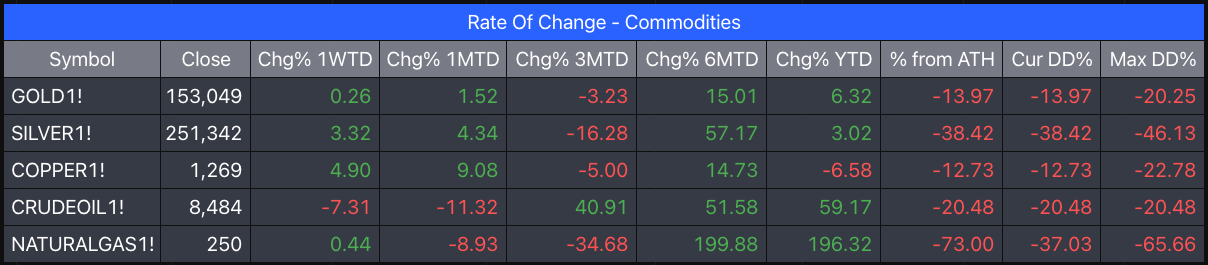
This week’s numbers: Almost all metals are in the green — Copper tops the charts at 4.9%, followed by Silver at 3.32%, and Gold barely there at 0.26%. Crude is down -7.31% and Natural Gas is flat at +0.44%.
Summary
After the explosive recovery seen last week, the markets have successfully sustained their momentum with a second consecutive green closing. Nifty gained over 1.2% this week, while Midcap Nifty continued to lead the charge, sitting less than 2% away from its all-time high.
The most significant technical development is that all four major indices are now trading above their 21 and 50 EMAs on the daily timeframe — marking a definitive shift in both short and medium-term bias to positive.
Volatility continues to recede as expected, with India VIX dropping another 9% to settle at 17.2. This cooling off is reflected in the shrinking daily and weekly ranges, providing a much more stable environment for directional players.
While the indices are still roughly 8–9% away from their record highs, the consistent week-on-week follow-through suggests that the bullish momentum is firmly intact as we head into a full five-day trading week.
What Caught My Attention This Week
Read: Coding After Coders: The End of Computer Programming as We Know It — by Clive Thompson, who also wrote Coders: The Making of a New Tribe and the Remaking of the World . The piece explores how generative AI is changing the very nature of programming — from a line-by-line, manual craft to something more like a conversation. Developers are increasingly acting as architects and reviewers, rather than just builders. While this shift clearly boosts productivity and opens the door for non-coders, it also raises important questions — especially around job security for junior developers and the gradual erosion of core technical skills. A thoughtful read, and definitely worth your time. Read it here
Watch: Artemis II: A Visual Masterpiece — an 8K cinematic supercut featuring the Artemis II voyage, set to a stunning background score by John Boswell, also known as Melodysheep. It’s one of those videos that fills you with awe. Watching it, you can’t help but feel both inspired and, at the same time, a sense of cosmic insignificance — just how vast everything is, and how small we really are in the grand scheme of things. Watch on YouTube
Events to Factor In
Important reminder: Due to the quarterly settlement that happened this week, you may have received cash from your trading account back into your bank account. Make sure to move it back to the trading account before the market opens on Monday to avoid any margin shortfall. Don’t miss that.
Next week is a full five-day trading week with no holidays. No other major known events are lined up.
If you find this series useful, don’t forget to subscribe to the channel — and do share it with your friends.
Until then — stay curious, stay steady, and enjoy your long weekend.