Hello and welcome to the Weekly Market Metrics! I’m Sandeep Rao, and we’re now in Week 17 of 2026.

Another eventful week. It began, as many weeks do these days, on the geopolitical front — with Donald Trump issuing an ultimatum to Iran, warning of severe consequences if a peace deal wasn’t reached by mid-week. Strong words, sharp reactions — fairly characteristic of Trump.
Back home, the spotlight was on the 2026 Assembly Elections, spanning key states like West Bengal, Tamil Nadu, Kerala, and Assam — the implications of which will likely play out over the coming months.
On the global tech front, we saw leadership transitions making headlines. Tim Cook is reportedly stepping down from Apple Inc., and Reed Hastings has also announced his upcoming departure from Netflix — marking the end of an era for two iconic companies.
At the same time, with 2026 shaping up to be an El Niño year, heatwaves have intensified across the country. It’s a reminder of the people working through extreme conditions every single day — and also stray animals. If you’re in a position to help, even in small ways, it’s absolutely worth doing.
And finally, coming to the markets — after a positive streak over the past couple of weeks, we saw a pause this week. Nothing dramatic, but a reminder that markets don’t move in straight lines.
Also, do watch the sectoral update this week — we’ve moved to tracking performance based on Tijori Finance Indexes, which are far more meaningful than NSE Sector indexes.
Section 1 — What Happened Last Week
Rate of Change (ROC) Across Indices
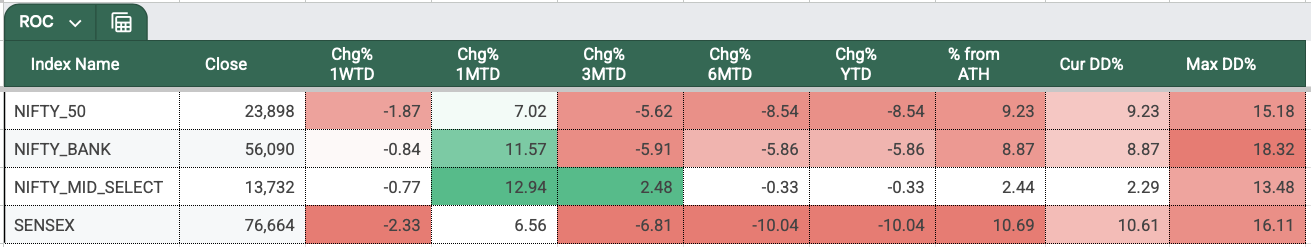
After a positive close for two weeks in a row, all four indices we track finished in the red this week. Sensex saw the steepest decline, losing 2.33%, while Nifty dropped 1.87%. Bank Nifty was down 0.84%, and Midcap Nifty showed the most resilience, slipping just 0.77%.
Despite this week’s pullback, the month-to-date (MTD) returns for April 2026 remain in the green across all four indices. For YTD returns, we are still underwater across all four indices.
This could be a minor pullback within an ongoing upmove, or the index might be heading lower after forming a higher low. We’ll find out in the coming week as the price action develops.
NIFTY
Weekly
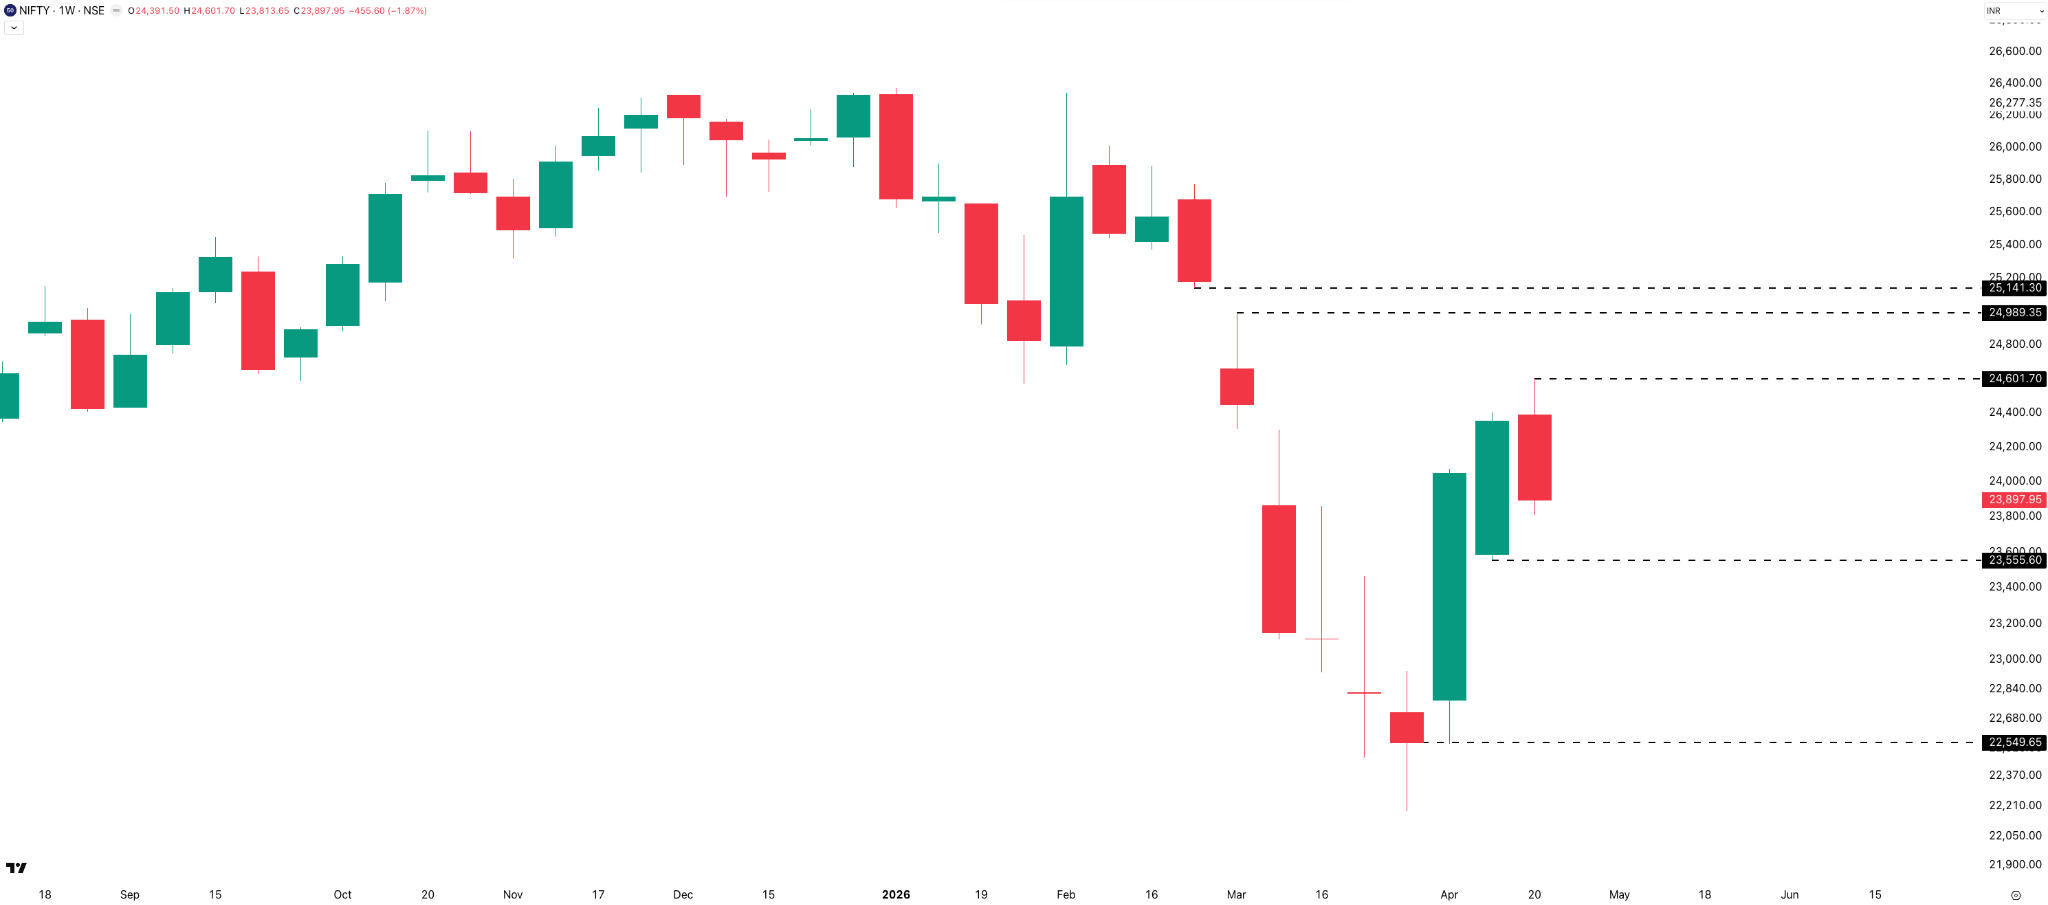
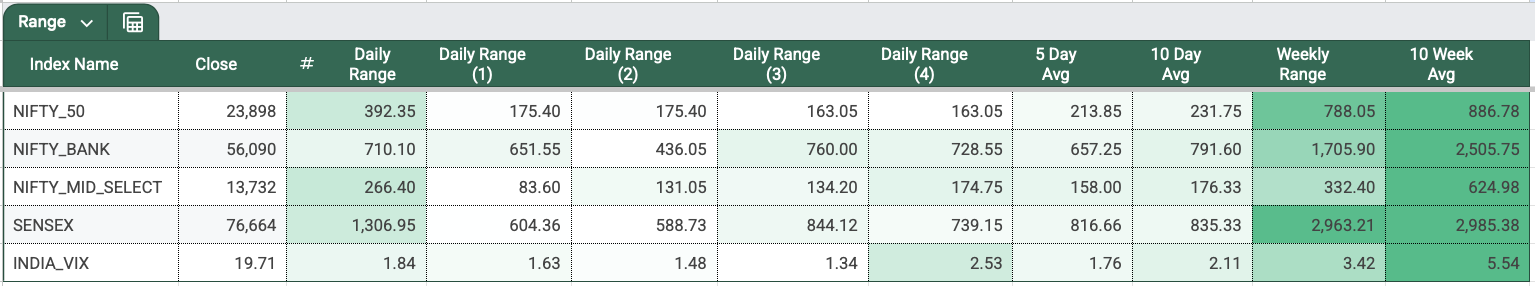
After two strong green weekly candles, Nifty lost 1.87% or 456 points this week to close at 23,898. The weekly range shrunk even further — from last week’s 845 points to 788 points this week. Friday saw the highest range on a daily basis.
Daily
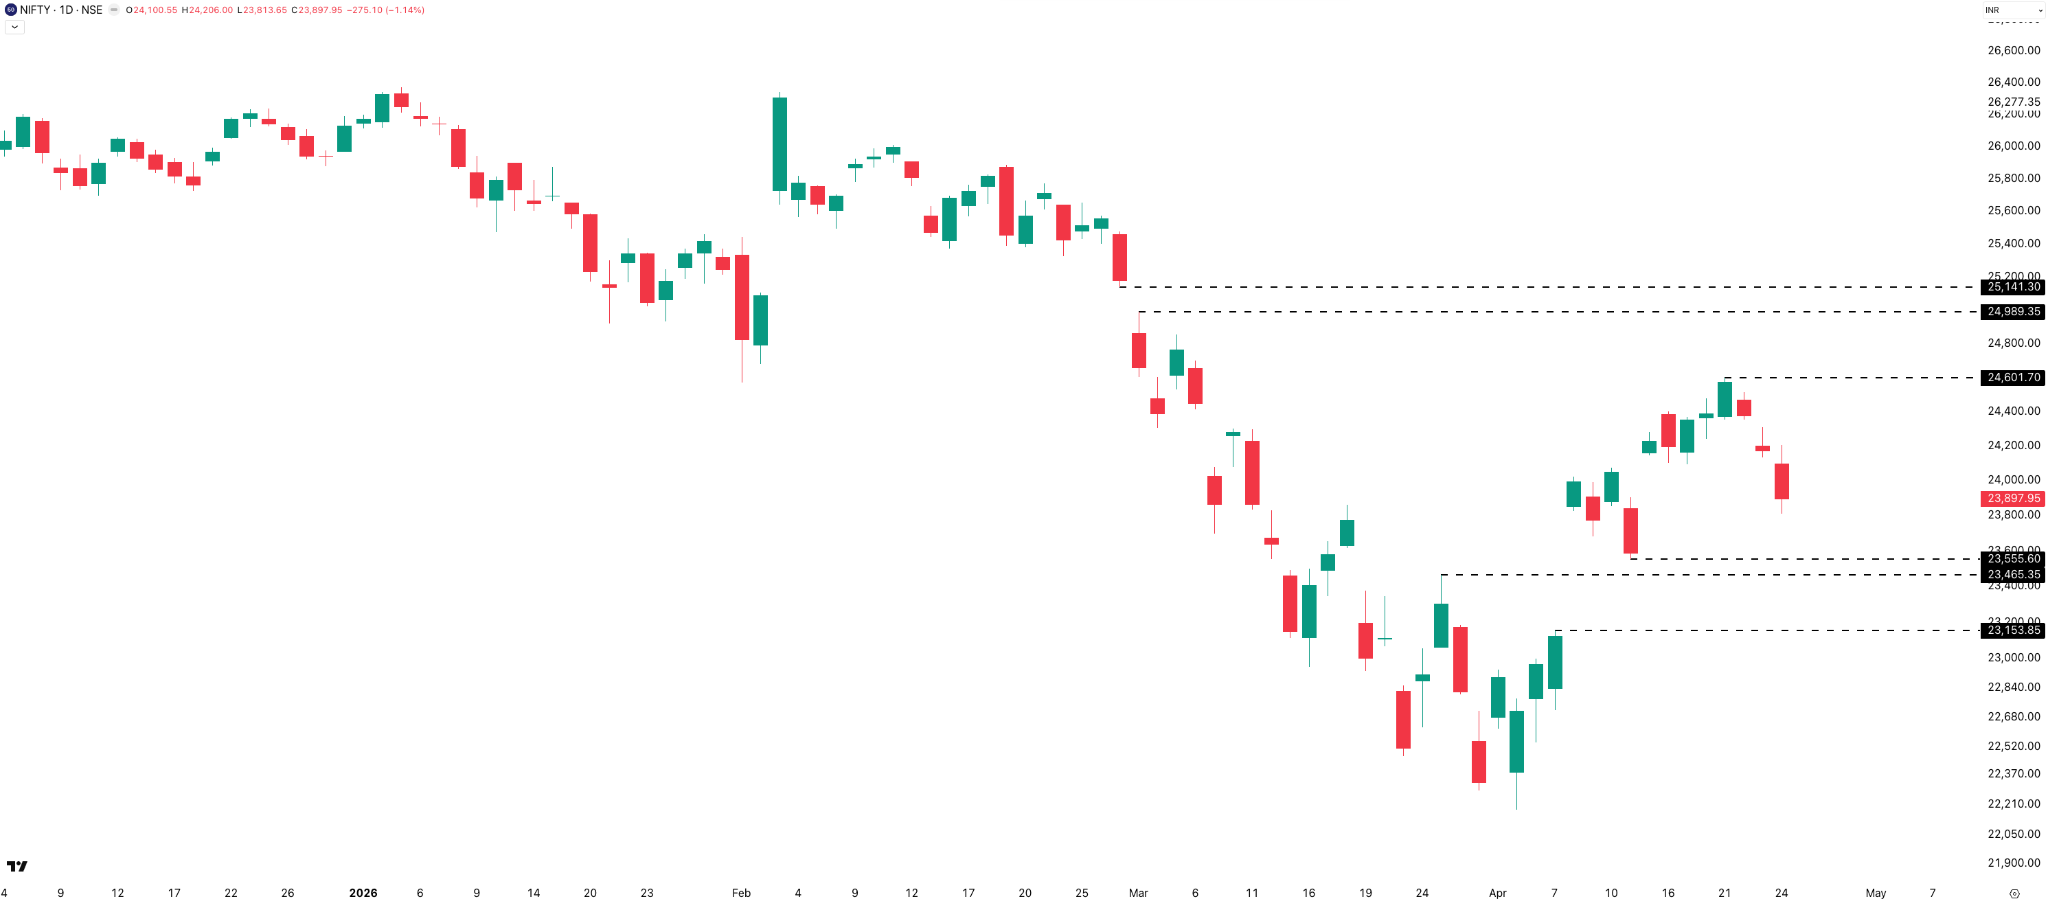
We saw two green days (Monday and Tuesday) followed by three consecutive red days (Wednesday, Thursday, and Friday). While Monday and Tuesday started with gap-up openings, the rest of the week saw the bears take control at the open. Wednesday, Thursday, and Friday all opened with gap-downs, with Thursday seeing the largest gap of the week at -0.72% or 176 points.
Nifty is now trading below all its key daily moving averages, including the 200 SMA, as well as the 100, 50, and 21 EMAs.
Hourly
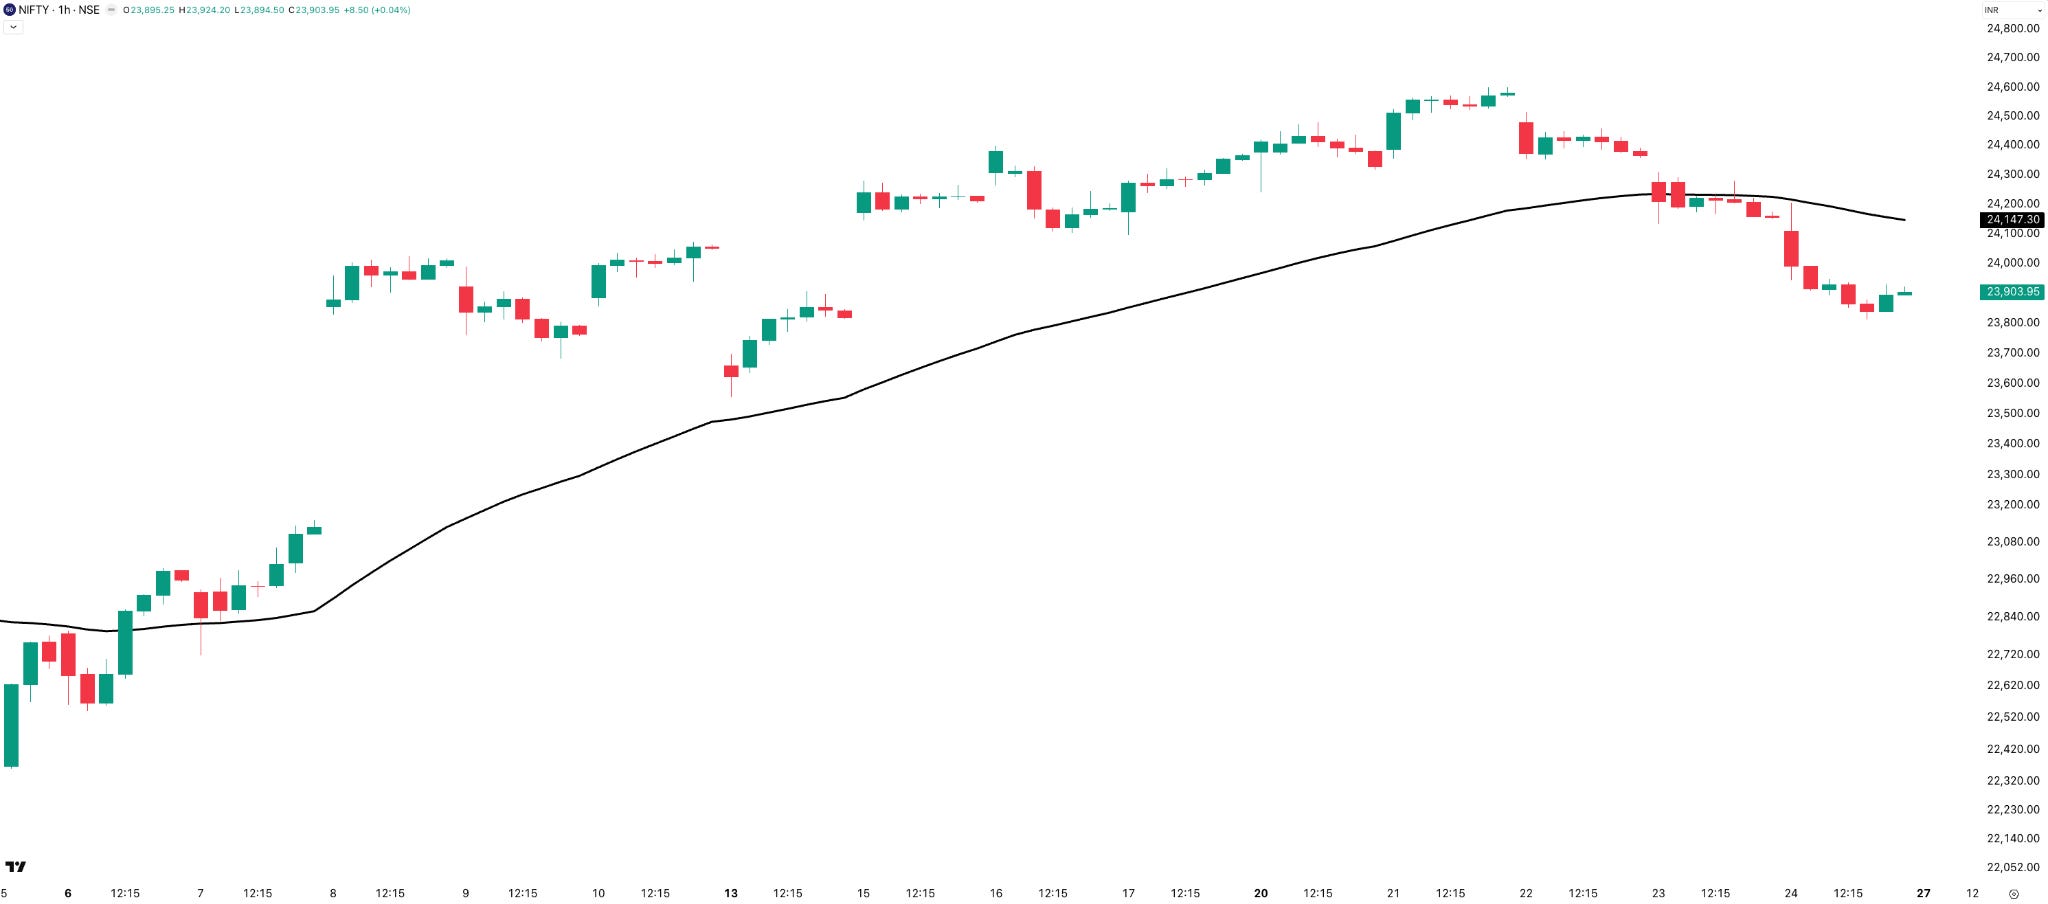
The short-term long bias continued until Thursday. Since then, the bias has turned short, as price is now trading below the 50 EMA. The question now is: will this short bias actually play out, or will the market just chop around after giving us such a clean trend? Let me know what you think in the comments.
Nifty Weekly Expiry — Tuesday, 21 April
The expiry had a range of 247 points, with the opening ATM straddle premium at 145. On the 5-minute timeframe, the index consistently made higher highs and higher lows without giving any deep pullbacks. It was one of the easiest expiries for short-volatility traders — both directional and non-directional alike.
SENSEX
Weekly
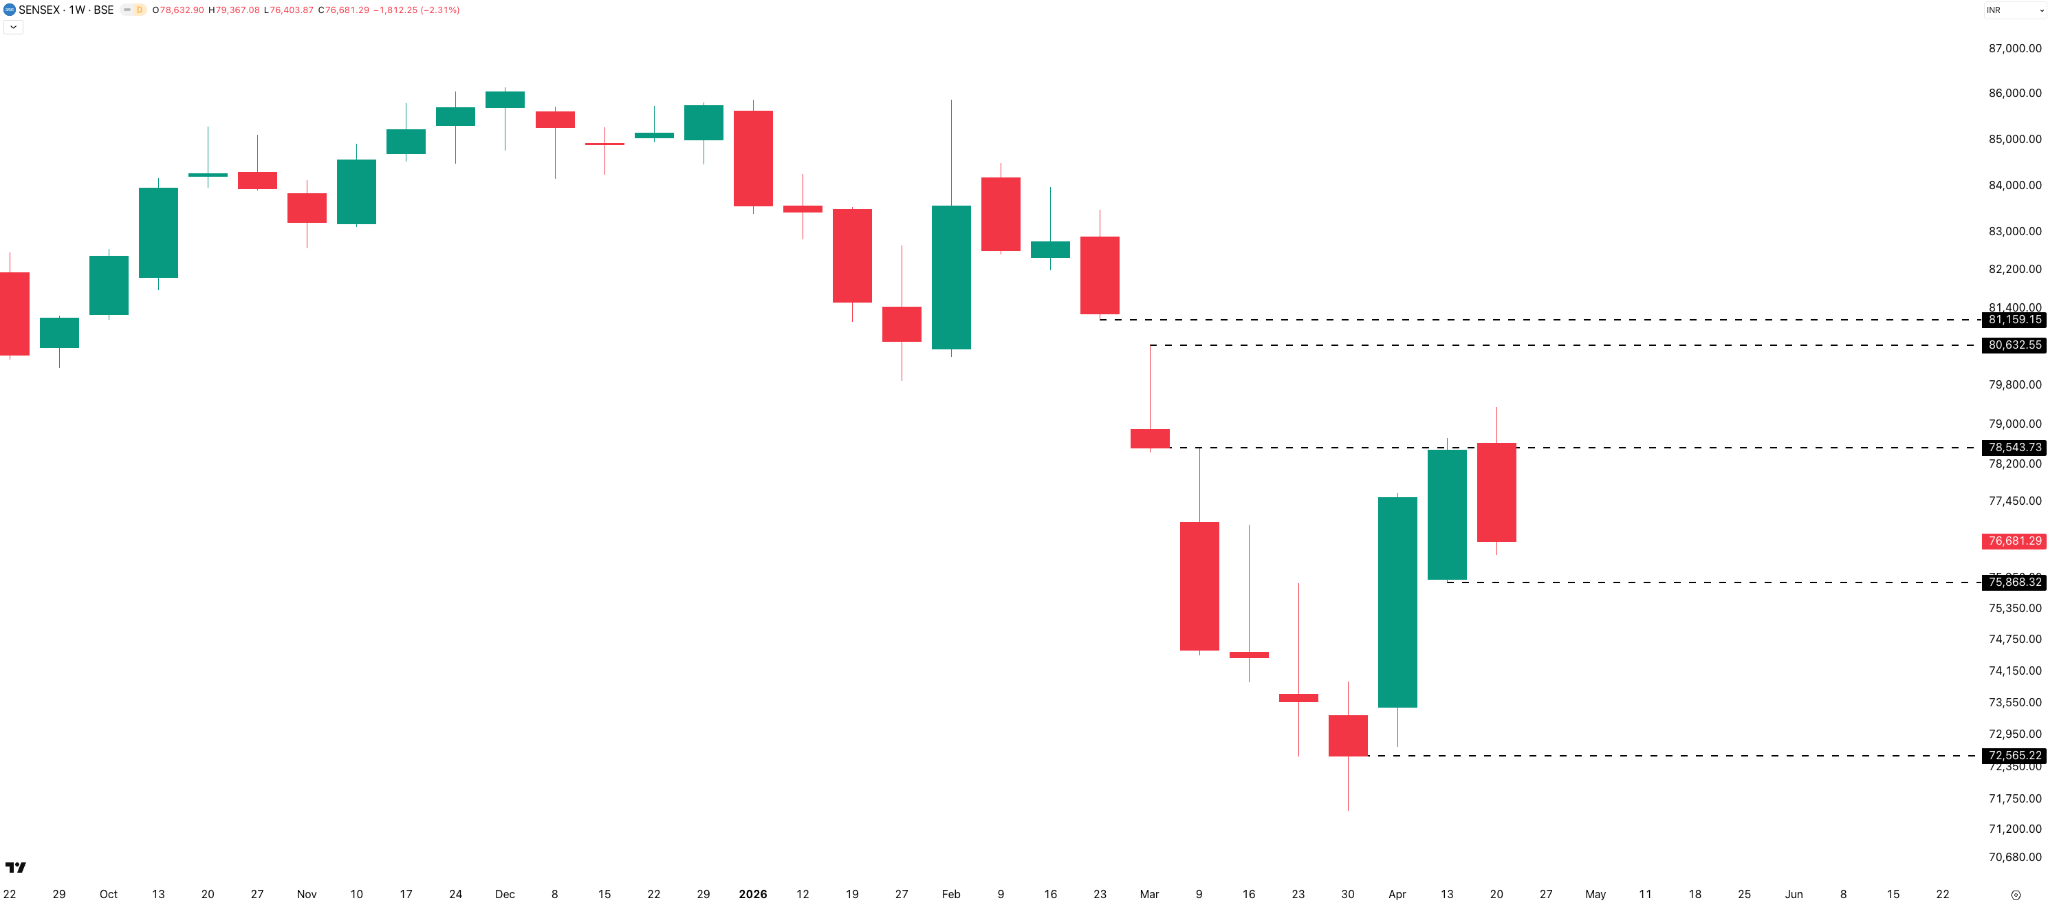
The Sensex weekly candle has been unable to close above the 78,600 level for two weeks in a row. For the week, it dropped 2.31%, or 1,812 points, to close at 76,681. The weekly range came in at 2,963 points — slightly higher than last week’s 2,862 points.
Daily
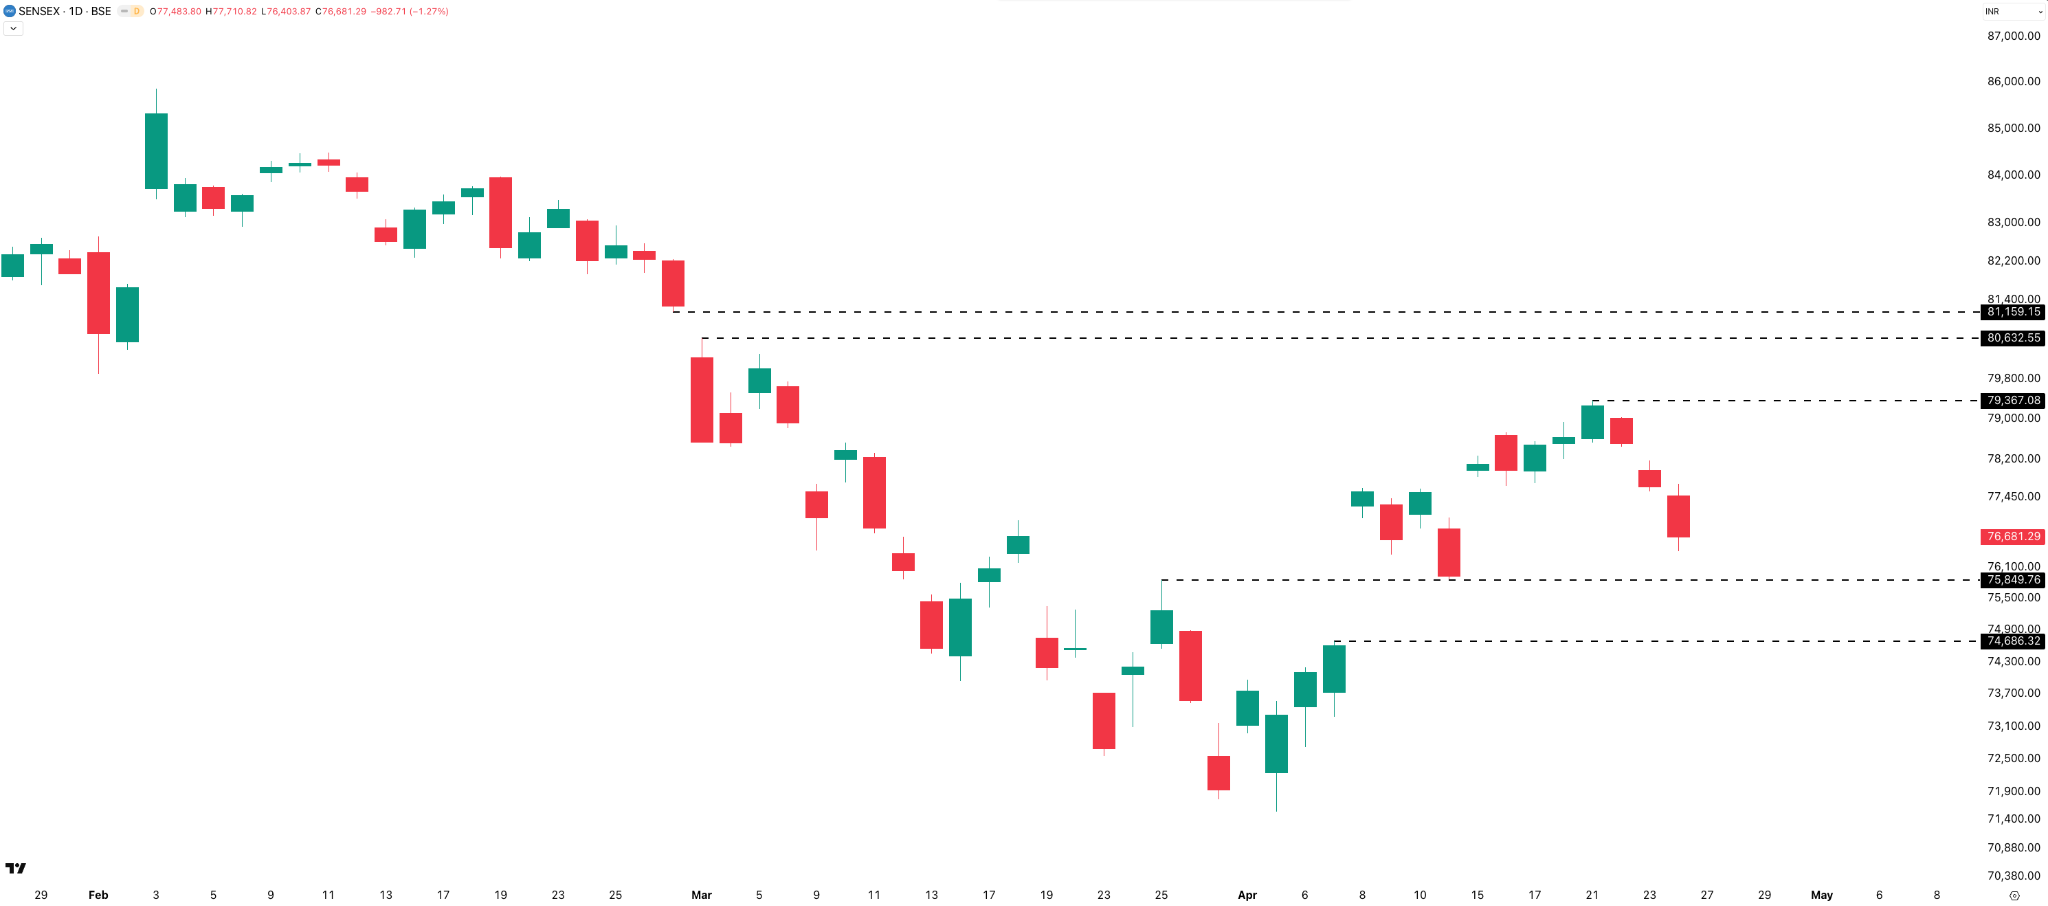
Mirroring Nifty, we had two green days followed by three red days. As the week progressed, the daily close-to-close moves expanded — dropping -0.95% on Wednesday, -1.09% on Thursday, and -1.27% on Friday. Following these last three down days, Sensex — just like Nifty — is now trading below all important moving averages, including the 200 SMA, as well as the 100, 50, and 21 EMAs on the daily timeframe.
Sensex Weekly Expiry — Thursday, 23 April
The ATM straddle opened at 415 points, similar to the previous weekly expiry. The actual range for the day was wider at 604 points, but trading 0DTE was challenging due to multiple sharp pullbacks and recoveries. We saw a 350-point swing between 9:30 and 10:00 AM, followed by another 370-point move from 12:30 to 1:30 PM, even as the index continued to drift downward throughout the day. Except for those who managed to enter early 9:20-style straddles, it was a tough Sensex expiry to navigate for short-volatility traders this week.
BANK NIFTY
Weekly
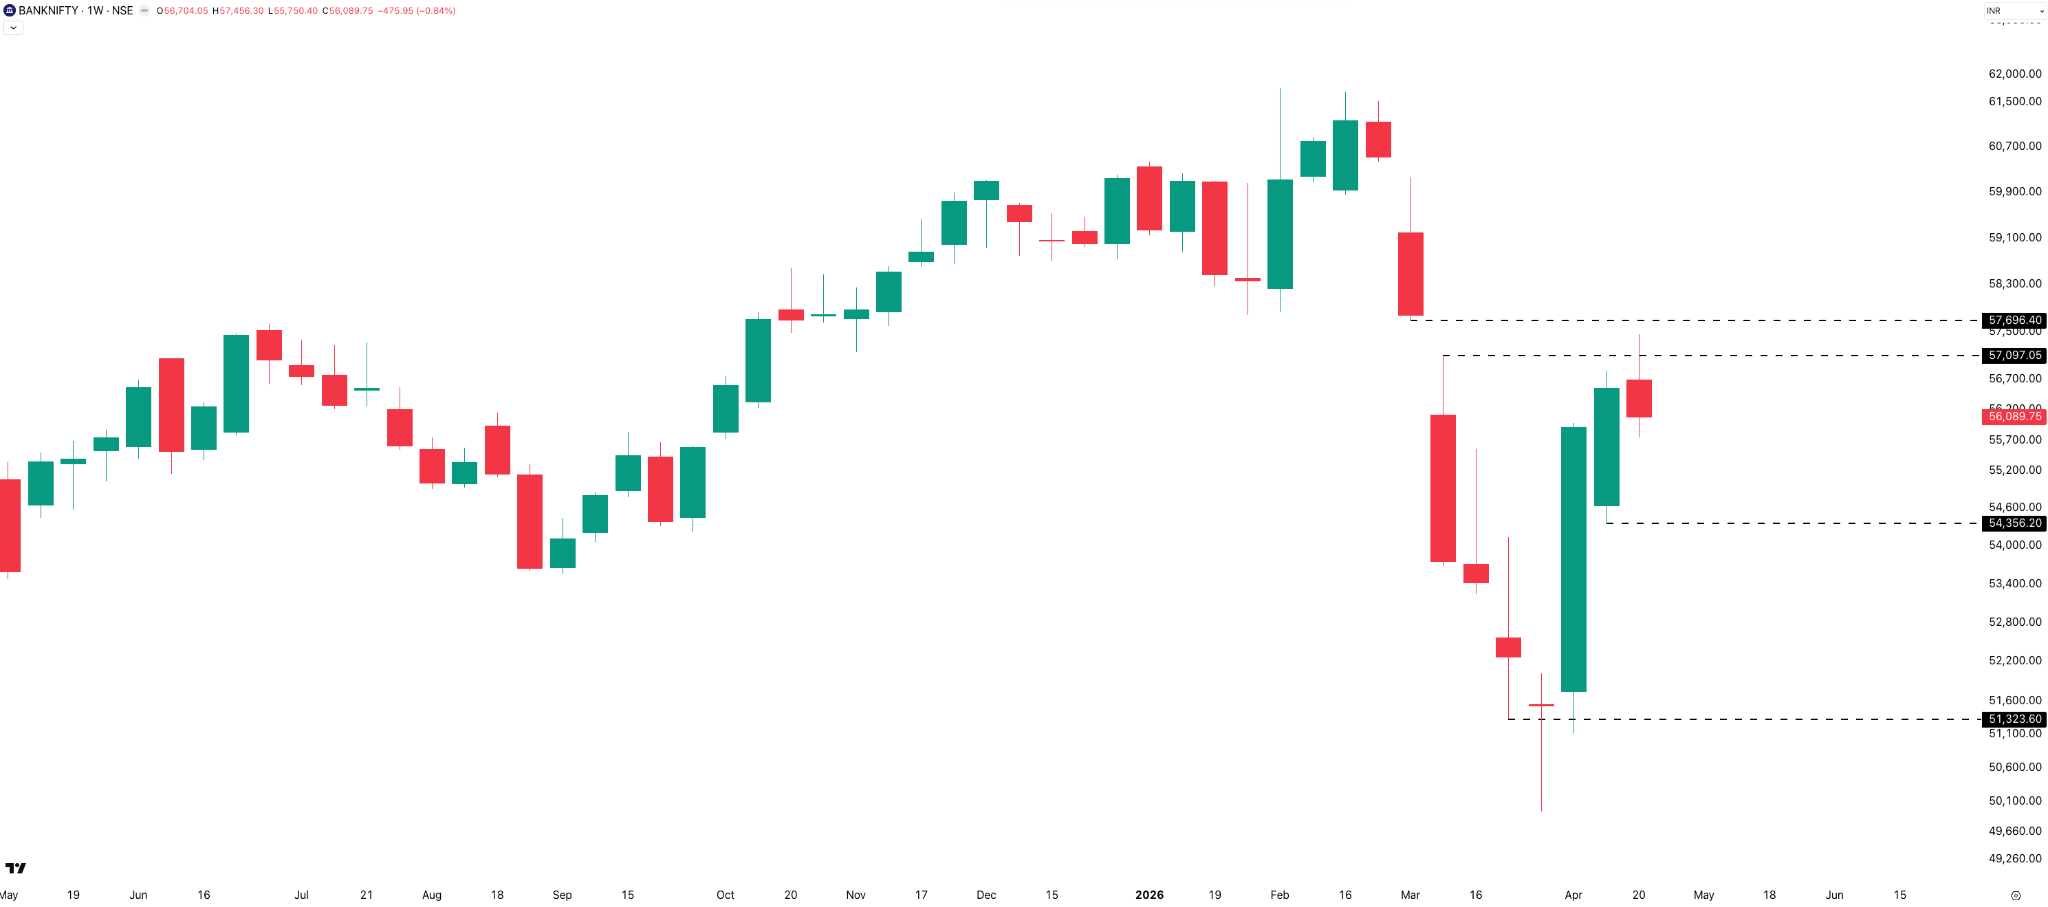
The index lost 476 points, or 0.84%, for the week, closing at 56,090. This looks like a minor pullback, especially considering the two strong green weekly candles we saw previously. Interestingly, the weekly range has been contracting week after week — dropping from last week’s 2,478 points to 1,705 points this week.
Daily
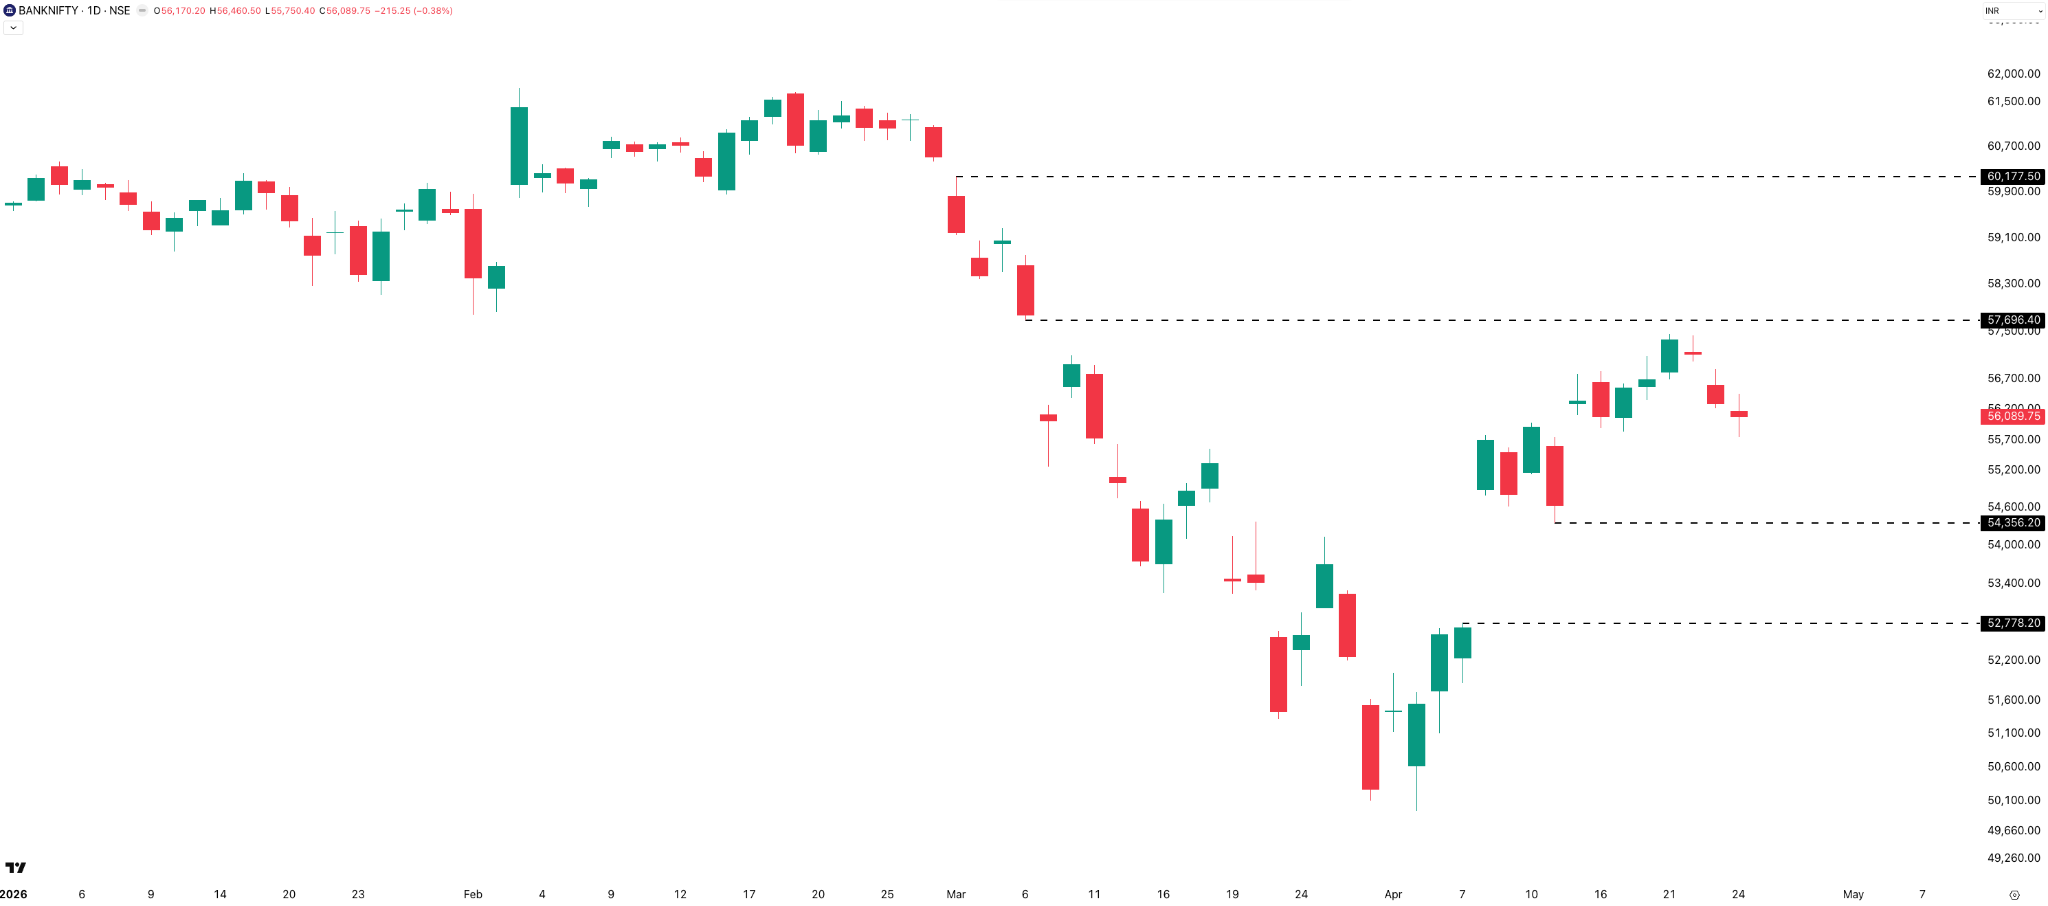
Bank Nifty found resistance around the 57,500 level. The daily candle patterns mirror those of Nifty and Sensex, with the index closing in the red for the last three days of the week. One standout observation: Bank Nifty didn’t face the same level of selling pressure as the other two on Friday — it fell only 0.38%, while Nifty and Sensex dropped 1.14% and 1.29% respectively. Clearly, Bank Nifty held up much better than the broader market on Friday, showing relative strength on both a daily and weekly basis.
Hourly
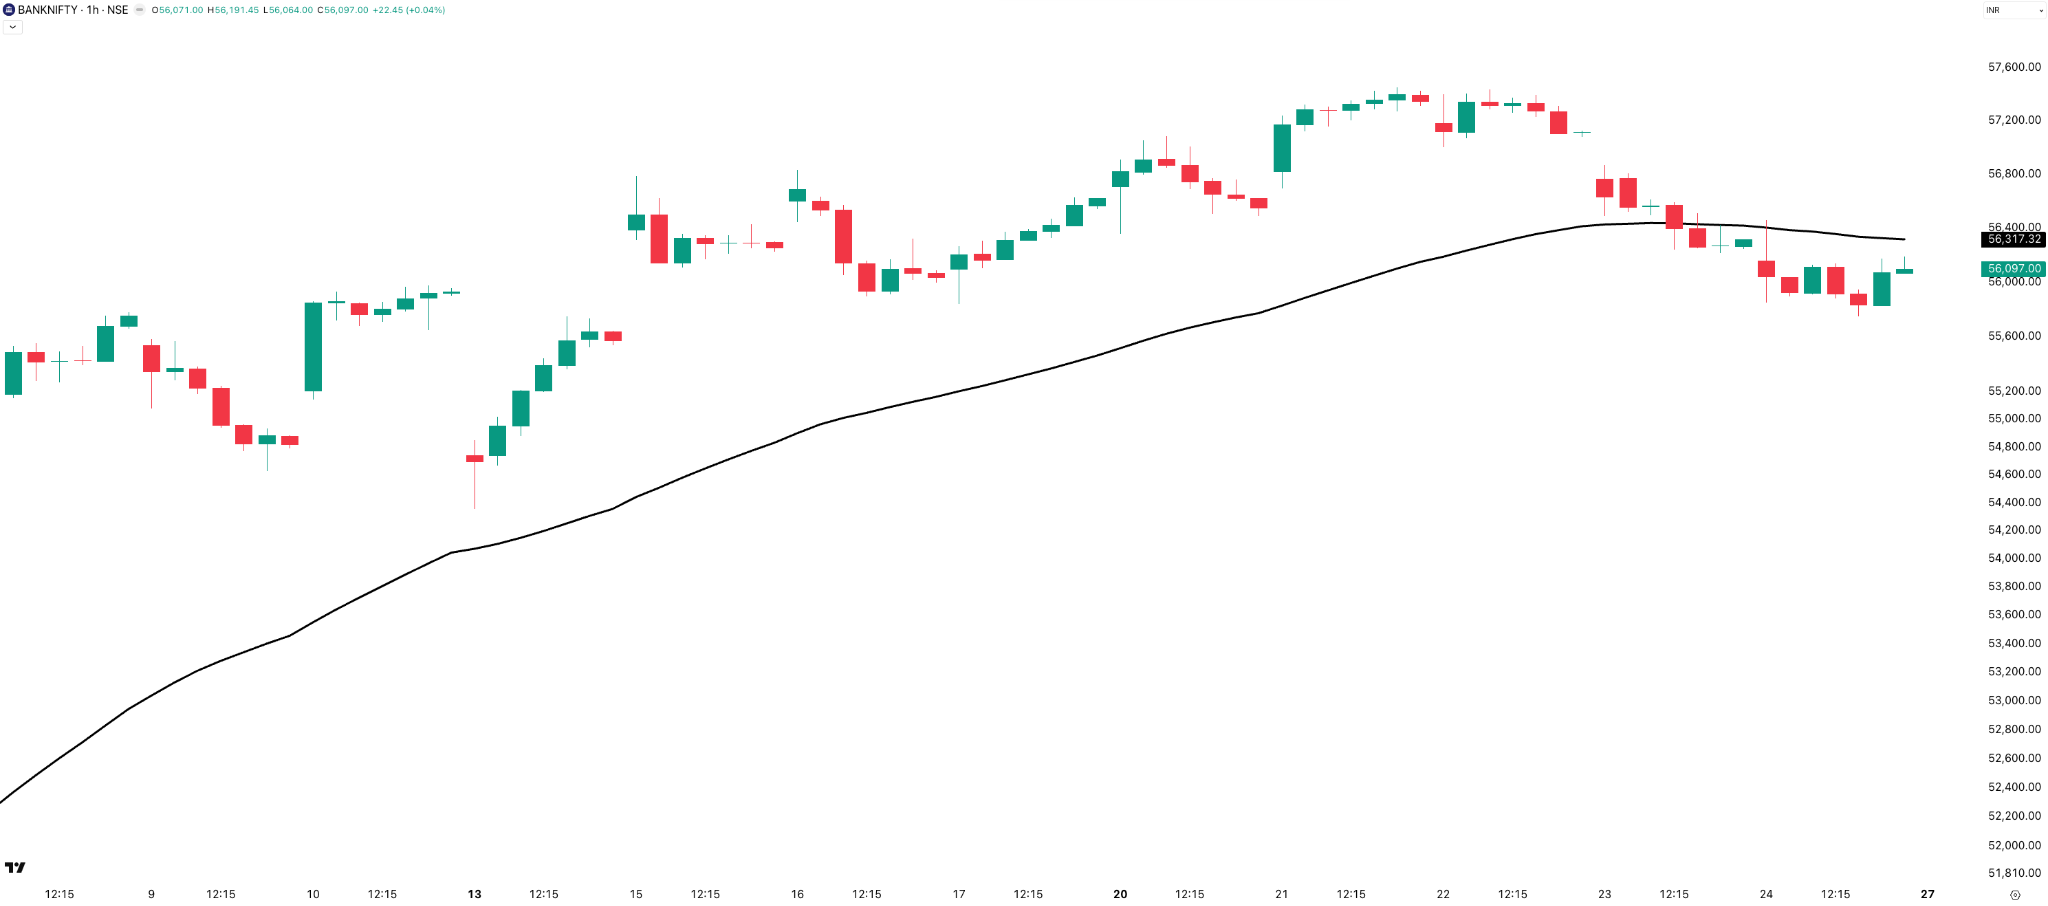
Bank Nifty breached the 50 EMA on Thursday, but managed to close very close to it by the end of Friday’s session. After a clean uptrend, the question is: are we entering a period of chopping around the EMA? On an hourly timeframe, both Nifty and Bank Nifty currently carry a short bias, but the bias for Bank Nifty appears weaker than Nifty’s, given that the price remains so close to the EMA.
Section 2 — What to Expect in the Coming Week
NIFTY
On the weekly charts, resistance is at 24,600, followed by the 25,000–25,150 zone. Support remains the same as last week at 23,550, and then further down at 22,550.
On the daily timeframe, immediate resistance stands at 24,600, which coincides with the 100 EMA, followed by the 25,000–25,150 zone, consistent with the weekly view. For support, we are looking at the 23,550–23,450 zone, and then further down at 23,150.
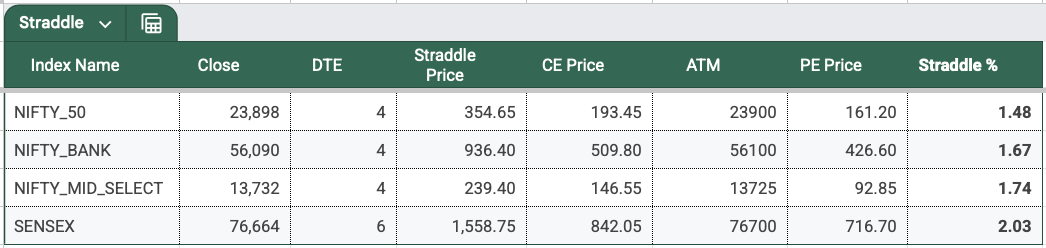
Based on the straddle price, the expected range for the upcoming Nifty April monthly expiry on Tuesday, 28 April is between 24,252 and 23,543 — a range of about 700 points. A good portion of that risk premium is likely due to the weekend. It will be interesting to see where the straddle premium opens on Monday (1DTE) and how it behaves heading into Tuesday’s 0DTE session.
The overall bias for Nifty is sideways to bearish , especially given the back-to-back red days and the fact that daily ranges are finally starting to expand.
SENSEX
The straddle premium suggests a range of about 1,560 points in either direction, giving us a rough playing field between 78,224 and 75,104 .
On the weekly chart, immediate resistance is at the 78,550–78,600 zone, followed by a major resistance zone between 80,650 and 81,150. On the support side, the levels remain the same as last week: 75,900, followed by the 72,700–72,500 area.
On the daily chart, resistance is located at 79,400, followed by the 80,650–81,150 zone. Supports are placed at 75,850 and 74,700.
Just like Nifty, the overall bias for Sensex remains sideways to bearish as we head into the last week of April.
BANK NIFTY
Given that Bank Nifty has its monthly expiry on Tuesday, 28 April , the straddle premium gives an expected range of 57,026 to 55,154 — roughly 1,875 points.
On the weekly chart, support and resistance levels remain the same as last week. The 57,100–57,700 zone is where the resistance sits. Support is at 54,350 and then further down at 51,300.
On the daily timeframe, the 57,500–57,700 zone remains the immediate resistance, followed by a major level at 60,200. On the support side, the key levels to watch are 54,350, followed by 52,800.
Directional Bias Summary
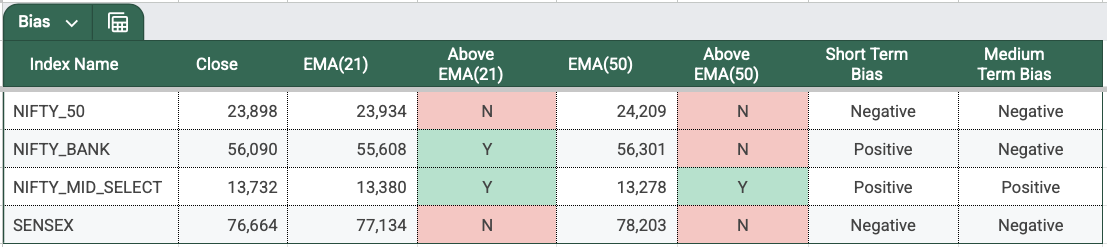
- Nifty and Sensex: Both currently show a negative bias in both the short and medium term.
- Bank Nifty: Displays a negative medium-term bias, but its short-term bias remains positive (or at least neutral/sideways).
- Midcap Nifty: Stands out with a positive bias across both timeframes.
India VIX
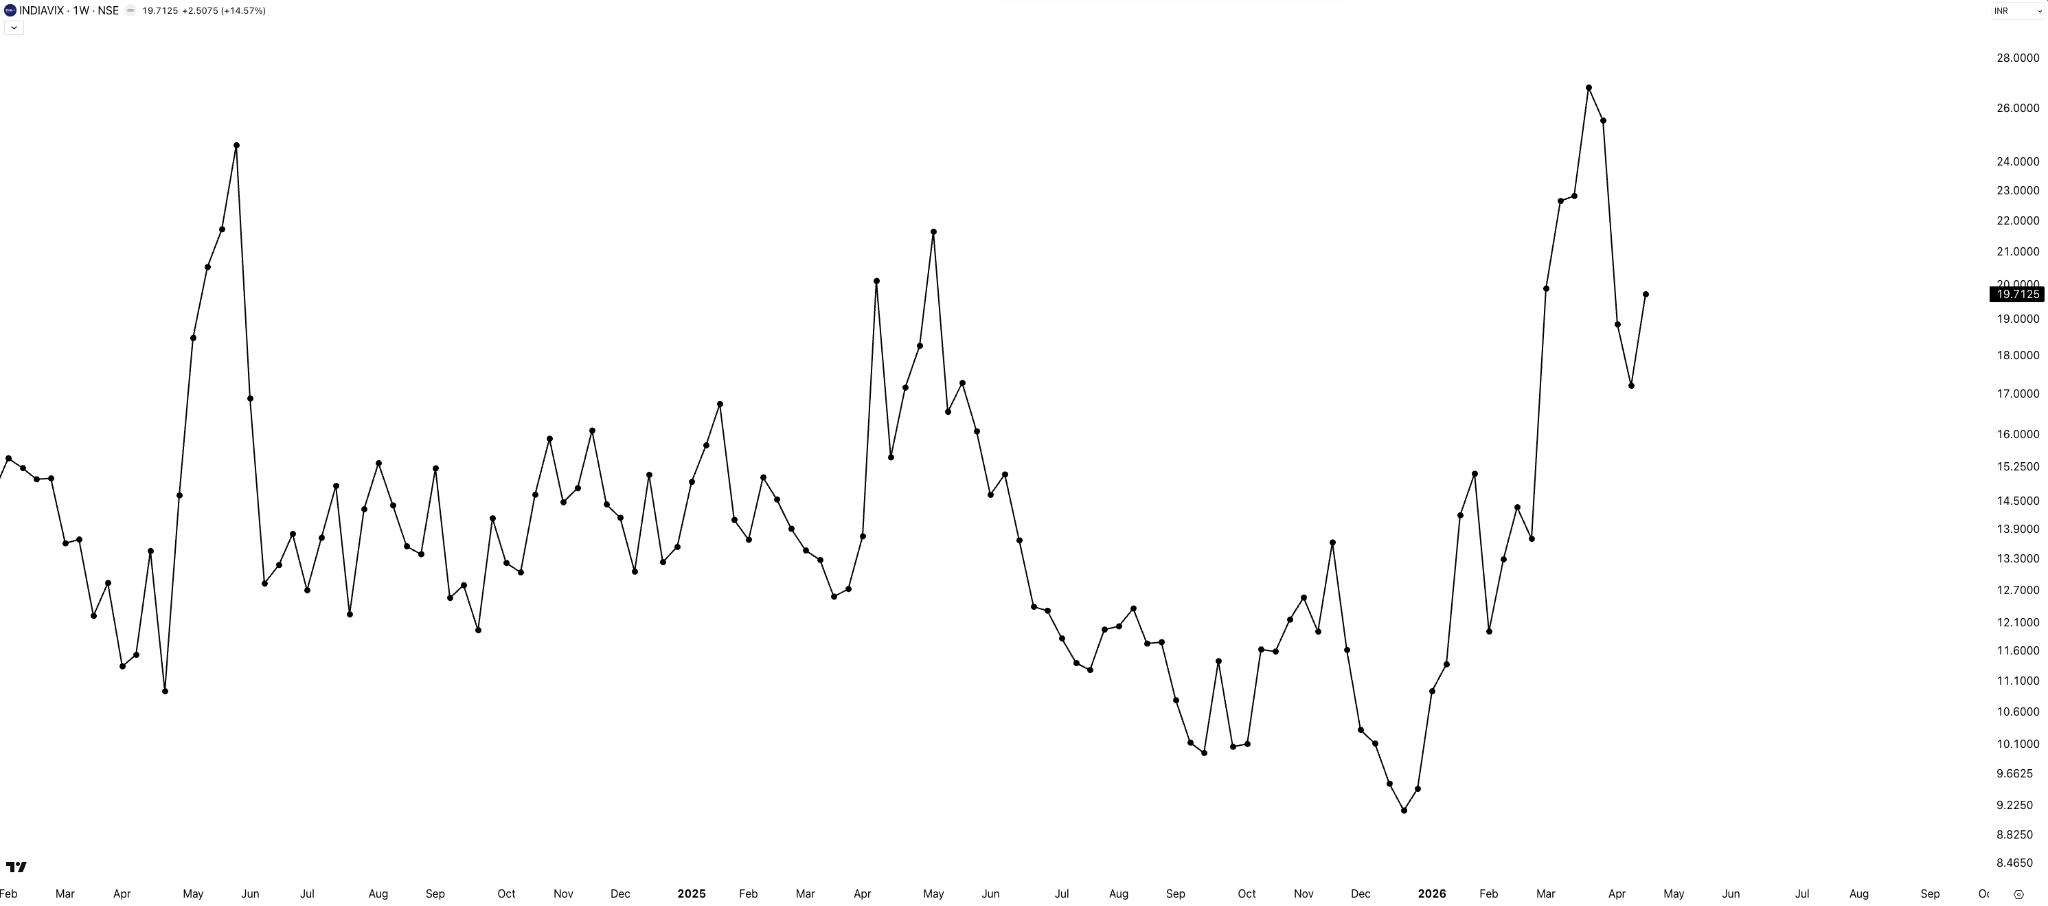
India VIX saw an increase of 15%, closing at 19.71. The downward move during the latter half of the week definitely spiked volatility. It will be interesting to see if this upward trend continues or if the VIX stabilizes as we head into the new week.
Sectoral Performance — A New Framework
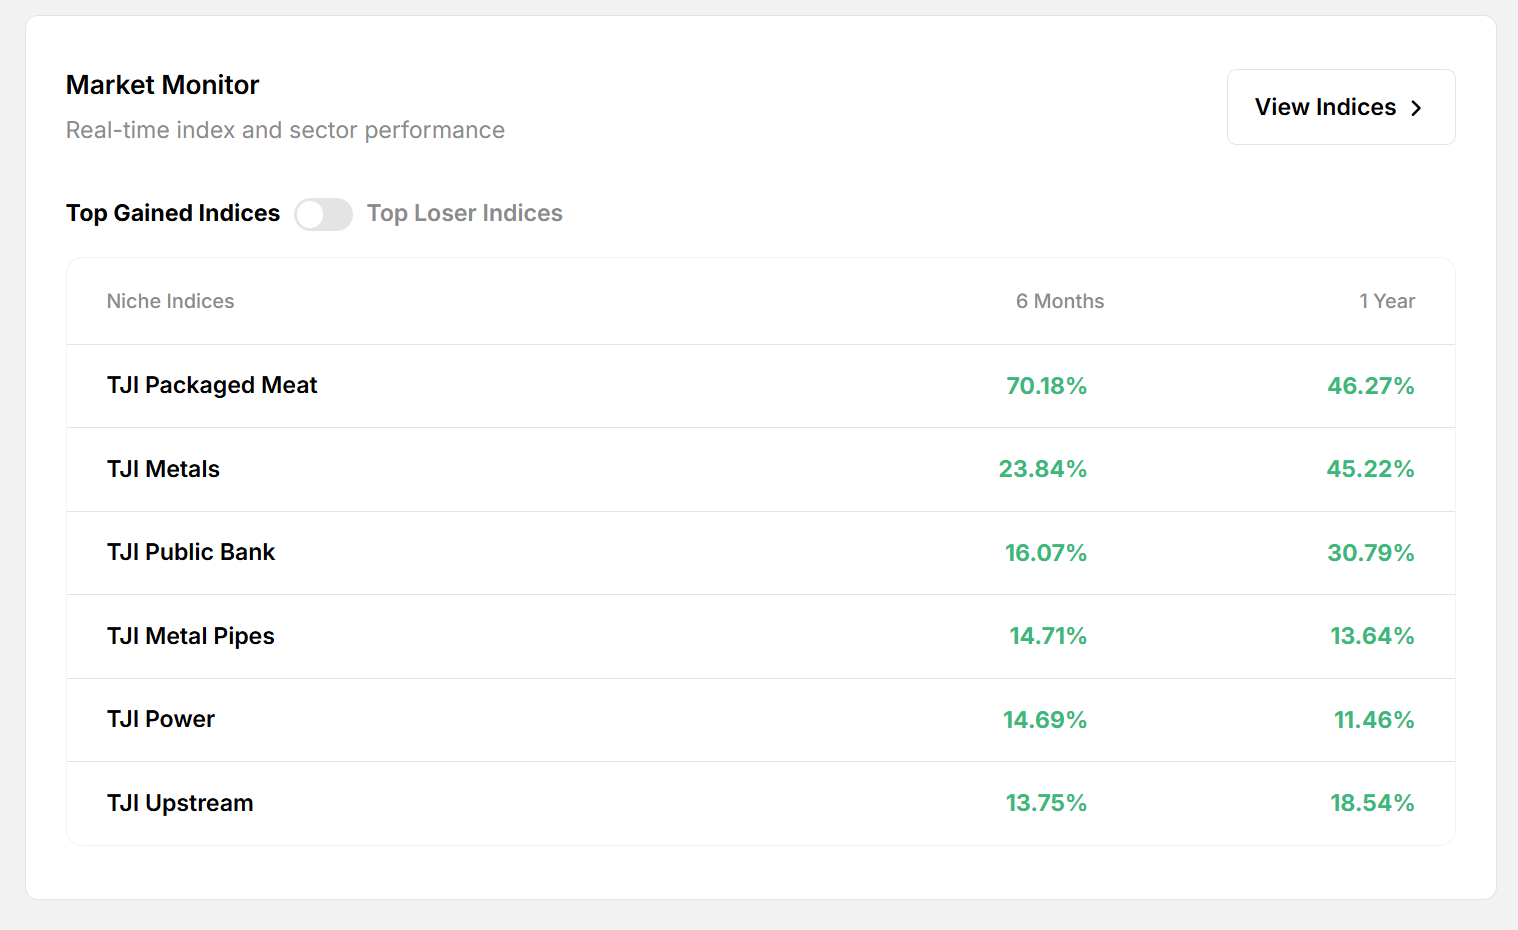
From this week onwards, we’re changing how we track and present sector performance. Instead of the traditional Nifty sectoral indices, we’ll be using the Tijori Sector Indices (TJI) available on Tijori Finance.
You can access Tijori Finance directly through your Zerodha Kite credentials. Once you’re in, you’ll find these indices by clicking on “View Indices” along with their performance and filtering options — the ones presented here are filtered on price.
The key reason we prefer these over standard Nifty sectoral indices is granularity . The TJI framework breaks the market into 80+ sectors, which makes it far more effective at identifying trends as they develop, rather than after they’ve already played out.
Another important aspect — we’ll be focusing on equal-weight indices . Market-cap-weighted indices tend to be dominated by a few large stocks, which can mask the broader trend. Equal-weight indices give a much clearer picture of participation and underlying strength within a sector. Over the next few weeks, this distinction will become much clearer as we walk through the data.
The Hypothesis
To identify sectors showing consistent strength, performance was looked at across three timeframes — three months, one month, and one week. Within each, the filter was applied to stocks that are positive over the respective timeframe, then narrowed further to those performing above the median of all positive performers. The same logic was applied consistently across all three timeframes.
The idea is simple: to identify sectors or indices that are not just doing well in one isolated period, but are showing consistent strength across medium-term, short-term, and very short-term horizons. If a given index shows up across all three filters — three-month, one-month, and one-week — it’s a strong signal that the trend is broad-based, persistent, and currently active.
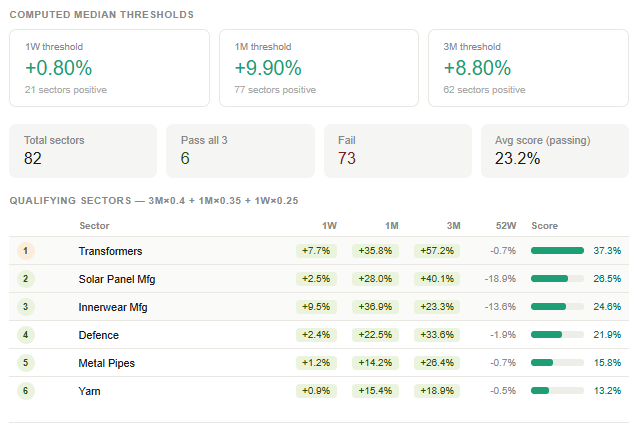
Three-month consistent performers: Sectors like Transformers and Metal Pipes are already trading very close to their 52-week highs, and Yarn is even closer. This typically indicates that the trend is not just strong, but also well-established.
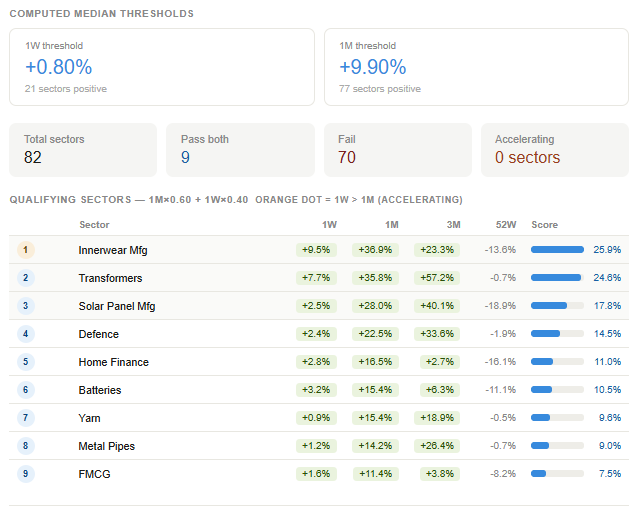
One-month view: Compared to the three-month view, the one-month filter lets in more indices — Home Finance, Batteries, and FMCG — because the markets have been in an uptrend for the past few weeks. However, none of them are as close to their 52-week highs as the consistent three-month performers. The action is essentially in those sectors.
Beyond the one-week filter: If you want to look only at three months and one month (ignoring the past week), a few more sectors appear promising — ones that didn’t contribute in the past week but showed strength on both the one-month and three-month view.
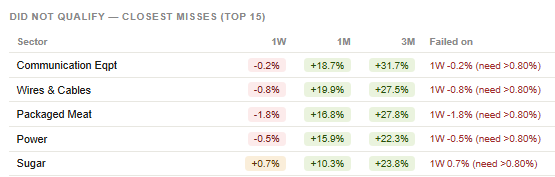
If you’re a stock picker, the next step is to double-click on these indices and look at the stocks within them that are contributing and showing strength. You may want to apply your own filters on top — but these are sectors that, irrespective of the broader market being weak, are showing pockets of strength. Hopefully that helps.
Commodities
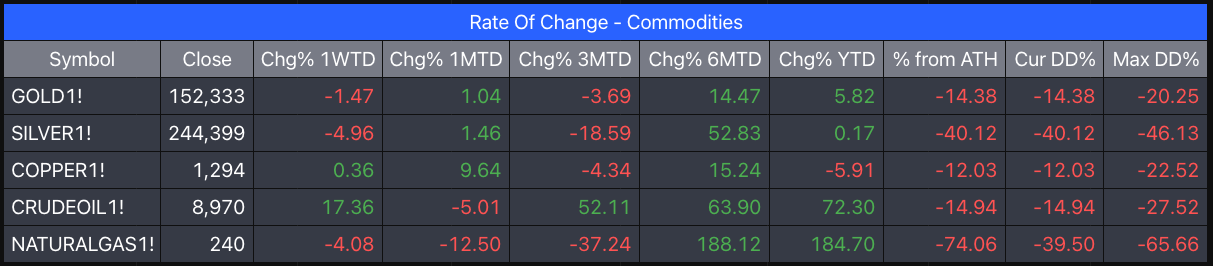
If you remember, the Gold vs. Nifty correlation turning positive has been a recurring observation — and that’s quite evident this week.
All precious metals are down: Gold is down 1.47% and Silver is down 4.96%. Copper is flat. Crude has spiked a whopping 17%, and Natural Gas seems to be on a decline.
One additional observation worth flagging: Copper prices appear to correlate with businesses that have copper exposure — both mining and product companies. Worth exploring.
Summary
After a strong two-week recovery, the markets hit a speed bump this week as all major indices finished in the red. While the broader month-to-date returns stay positive, the recent price action suggests a pause in the previous uptrend, with the indices giving back some ground.
Technically, the environment has shifted. Nifty and Sensex have slipped below their key daily moving averages, turning their short-term bias defensive. In contrast, Bank Nifty and Midcap Nifty showed notable resilience, holding up much better than the benchmark indices and maintaining a relatively stronger technical posture.
Volatility made a noticeable comeback after a period of calm. The downward move in the latter half of the week caused a spike in the VIX, reflected in wier daily trading ranges. This expansion in volatility suggests that the “easy” directional move has transitioned into a more sideways-to-bearish environment.
Sectorally, strength remains concentrated in specific niches. While the main indices struggled, areas like Transformers and Metal Pipes continue to trade near their highs — showing that underlying momentum is still active in certain pockets of the market despite the broader cooling off.
What Caught My Attention This Week
Read: A research piece by Vanguard Group on the 50-year evolution of the index fund — tracing the journey from what was once dismissed as “Bogle’s Folly” by John C. Bogle in 1976, to a strategy that now underpins a vast majority of retirement portfolios, reinforcing a simple idea: owning the market often beats trying to outsmart it. It’s a thoughtful, data-backed read — definitely worth your time. A quick plug: Bogle’s Folly was discussed in Episode 3 of The Long and the Short. If you haven’t watched it yet, you may want to check it out.
Listen: Episode 152 of Top Traders Unplugged, featuring the legendary Toby Crabel. If you’re a systematic trader, this is a must-listen. He talks about how the Opening Range Breakout has evolved in today’s 24-hour markets, and why execution has now become the real edge. Another small plug — Toby and ORB were discussed in Episode 22 of The Long and the Short as well.
Events to Factor In
Next week is a heavy one for expiries:
- Tuesday, 28 April — Monthly expiries for Nifty, Bank Nifty, and Midcap Nifty all fall on the same day.
- Thursday, 30 April — Sensex and Bankex monthly expiries. Though, let’s be honest, I really do not know anyone who trades Bankex.
- Wednesday, 29 April, 11:30 PM — FED Interest Rate decision. This lands right before the Sensex monthly expiry, so expect some opening volatility on Thursday.
- Thursday, 1 May — Maharashtra Day holiday, giving us a long weekend from the 1st to the 3rd. Make sure to plan your positions and margin requirements accordingly.
If you find this series useful, don’t forget to subscribe to the channel — and do share it with your friends.
Until then — stay curious, stay steady, and enjoy your long weekend.