Hello and welcome to the Weekly Market Metrics! I’m Sandeep Rao, and we’re now in Week 18 of 2026.

This was another eventful week. Politically speaking, the voting for the 2026 Assembly Elections concluded yesterday, with 4 May now looming as a volatility catalyst for the markets.
While much of India continues to remain gripped by a severe El Niño heatwave, Bangalore saw a record-breaking 111 mm of rain yesterday. This week also marked the passing of the grand master of Indian photography, Raghu Rai. And on the global stage, we witnessed Sabastian Sawe setting a new record by running a sub-2-hour marathon.
In the financial world, the Fed opted for stability, holding interest rates constant at 3.5% despite high anticipation. In our markets, the “Hormuz premium” and election uncertainty triggered a pause in the recent rally. With crude oil hovering above $100 and the exit poll ban about to lift, it’s clear that we are entering an uncertain window for both policy and price action.
Section 1 — What Happened Last Week
Rate of Change (ROC) Across Indices
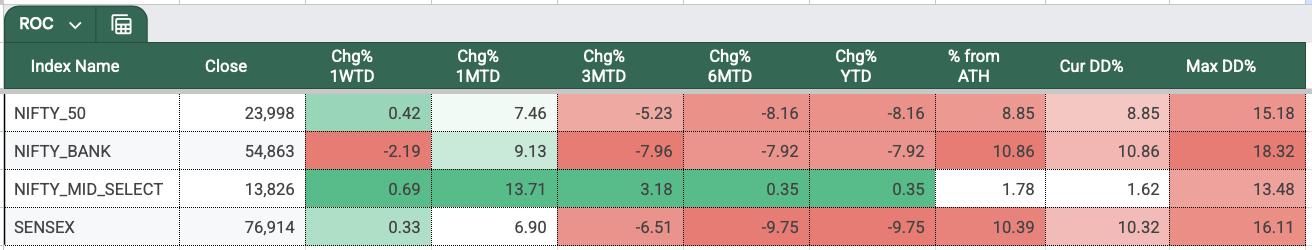
This was a muted week across Nifty, Sensex, and Midcap Nifty — all three saw roughly a 0.5% increase. Bank Nifty, however, saw a 2.19% drop. Last week, Bank Nifty showed relative strength, but this week was exactly the opposite — it was relatively weaker.
For the month of April, all four indices are in the green: Midcap Nifty gaining 14%, Bank Nifty gaining 9%, Nifty at 7.5%, and Sensex at 7%.
On a YTD basis, only Midcap Nifty remains in the green. The other three are still in the red — Sensex losing close to 10%, while Bank Nifty and Nifty are both down around 8%.
Nifty Monthly Seasonality
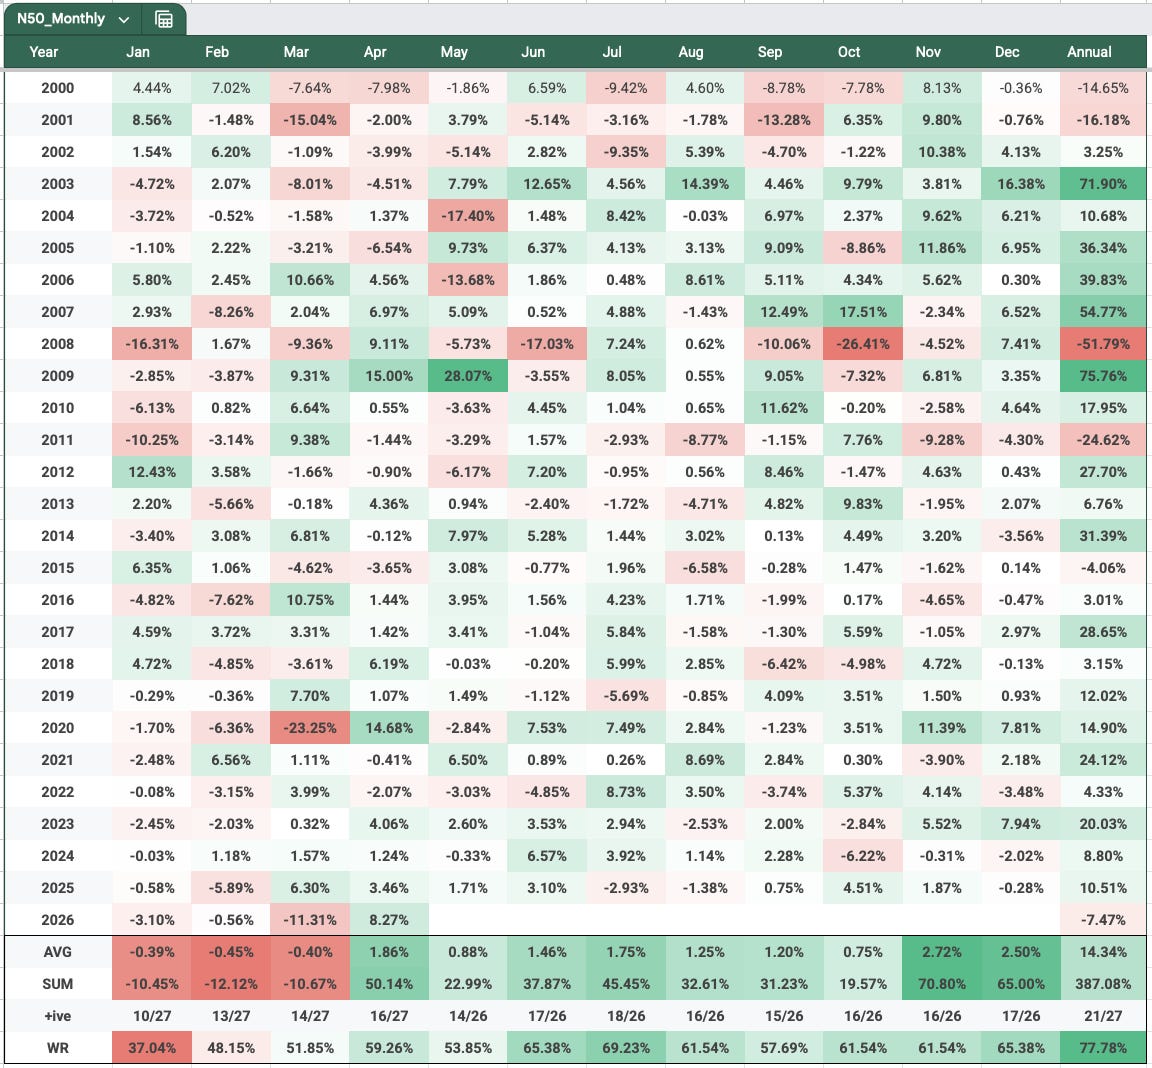
As April has just ended — April 2026 finished in the green with +7.46% gains. After a treacherous March, this recovery was much needed. Though April didn’t move in a straight line, it certainly had its fair share of volatility. To give some context, March’s range was around 2,700 points, while April’s range came in at roughly 2,400 points.
Looking at the upcoming month of May — as per the previous 26 years of data — 14 times May ended in the positive. So it is just about a coin-toss type of probability. With so much geopolitical uncertainty, it is tough to predict how May will perform. So I will save everyone’s time by not predicting anything, and just give you all the data to draw your own conclusion.
NIFTY
Weekly
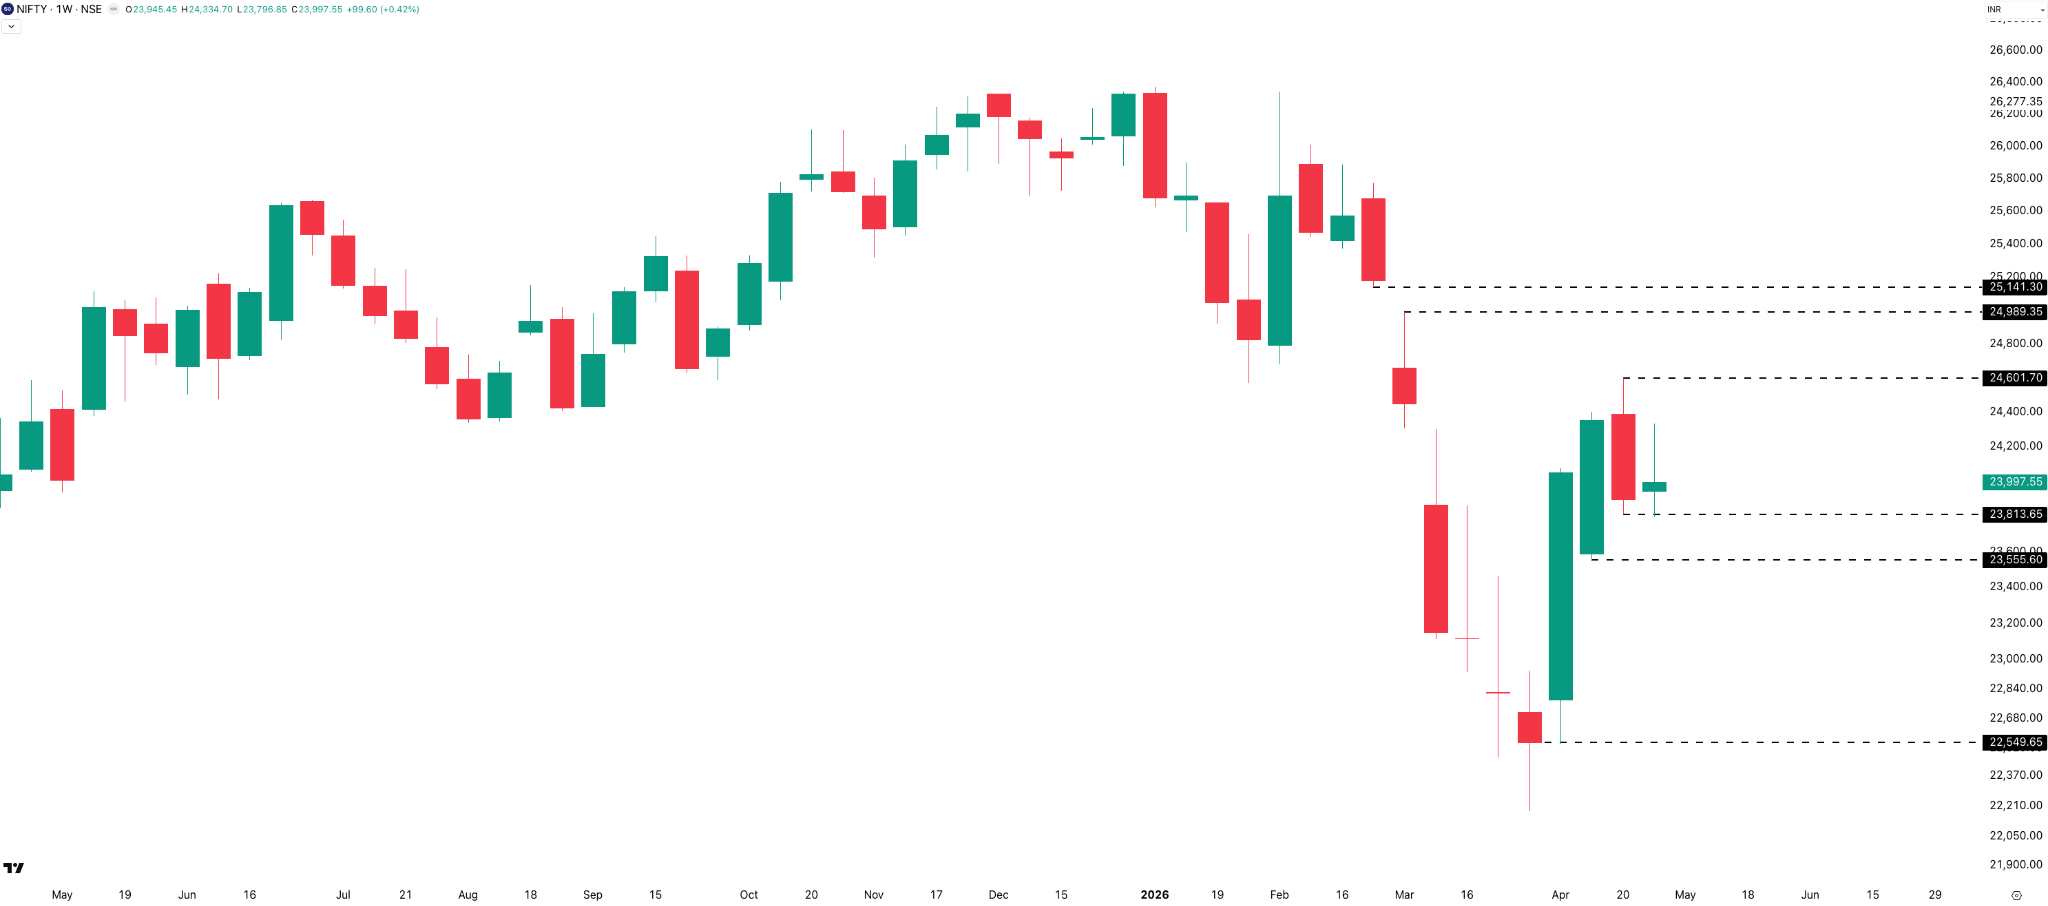
In the last week of April 2026, Nifty gained 100 points, or 0.42%, to close at 23,997. It was a pretty muted move, and the entire weekly candle almost sat inside the previous week’s candle. The weekly range was 538 points, compared to 788 points last week — though keep in mind it was just a 4-day week. Thursday’s range was the highest of the week at 291 points.
Daily
On the daily timeframe, we saw two green days (Monday and Wednesday) and two red days (Tuesday and Thursday). Thursday’s price action was the toughest — the index opened with a 180-point gap down and fell over 200 points from the open, only to recover the entire intraday fall. It was also a Sensex 0DTE, which we’ll discuss in a moment.
Nifty is now trading just above its 21 EMA, but remains below all other major daily moving averages, including the 200 SMA, as well as the 100 and 50 EMAs.
Hourly
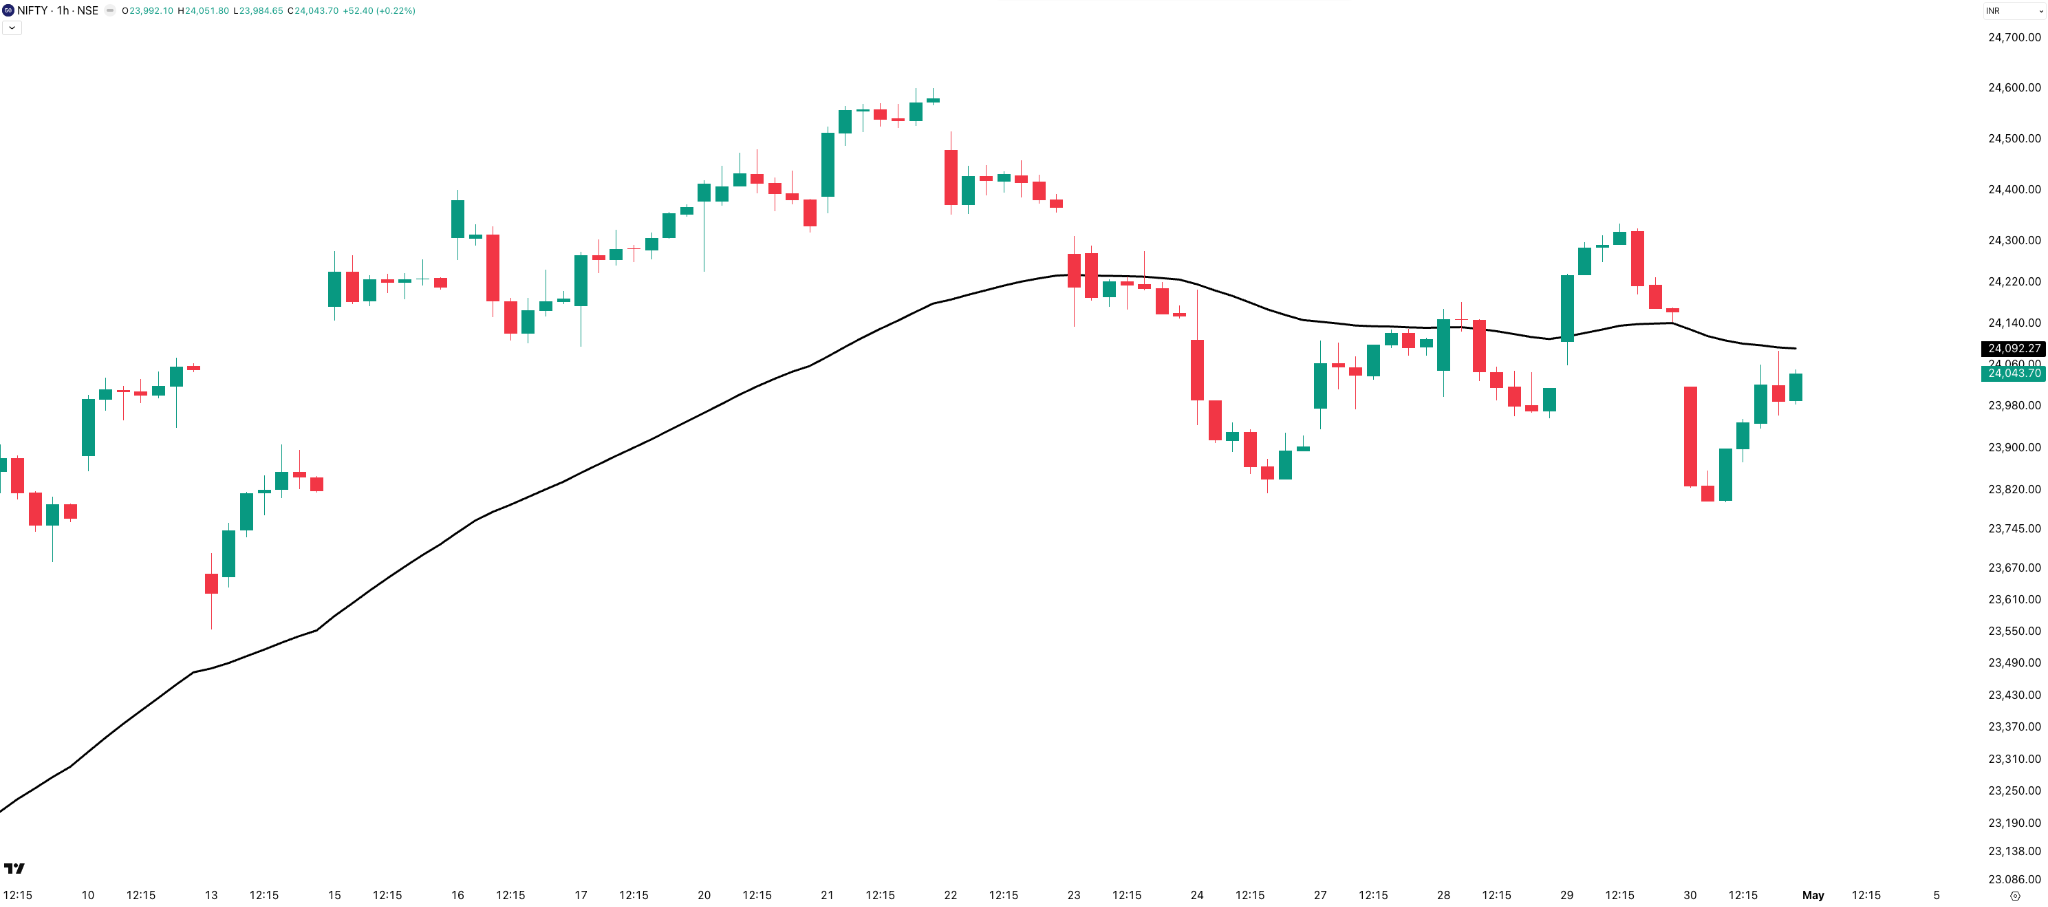
On the hourly timeframe, the classic chop-chop is happening for short-term trend followers. After a very good March for trend following, April was not as smooth. For the week, Nifty chopped around the 50 EMA on the hourly timeframe and closed just below it. With a long weekend ahead, nobody knows what will happen on Monday at the open. We can only control things which are in our hands — like proper position sizing and not overleveraging. What will happen will anyway happen. We shouldn’t spoil our long weekend worrying about a gap-up or gap-down open.
Nifty Monthly Expiry — Tuesday, 28 April
The expiry had a range of 221 points, lower than last week’s 247 points. The index gave a 180-point move in the first hour and from there went down 220 points until 1:30 PM — all this with an ATM straddle premium of just 116 points. It was a relatively tough expiry for options writers, given there was not much premium to begin with.
SENSEX
Weekly
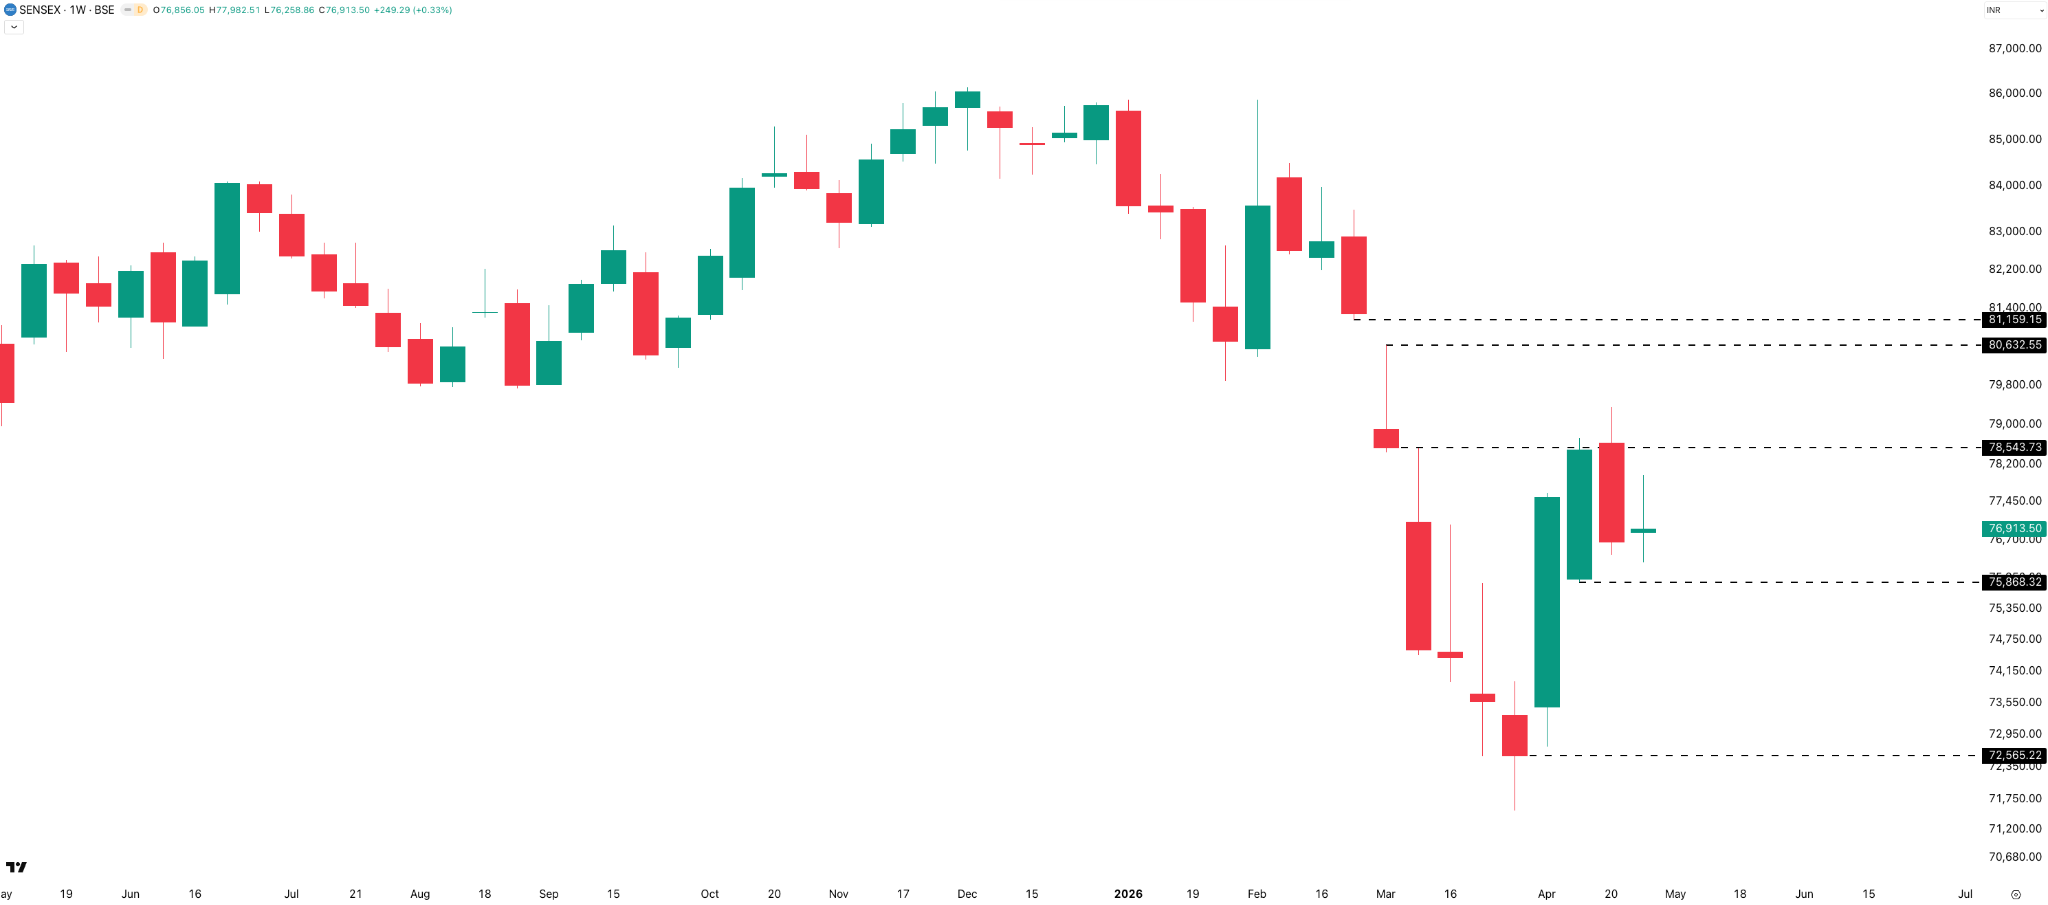
Similar to Nifty, the Sensex weekly candle also made a doji, gaining 250 points or +0.33%. The weekly range came in at around 1,700 points — well below last week’s range of around 2,900 points.
Daily
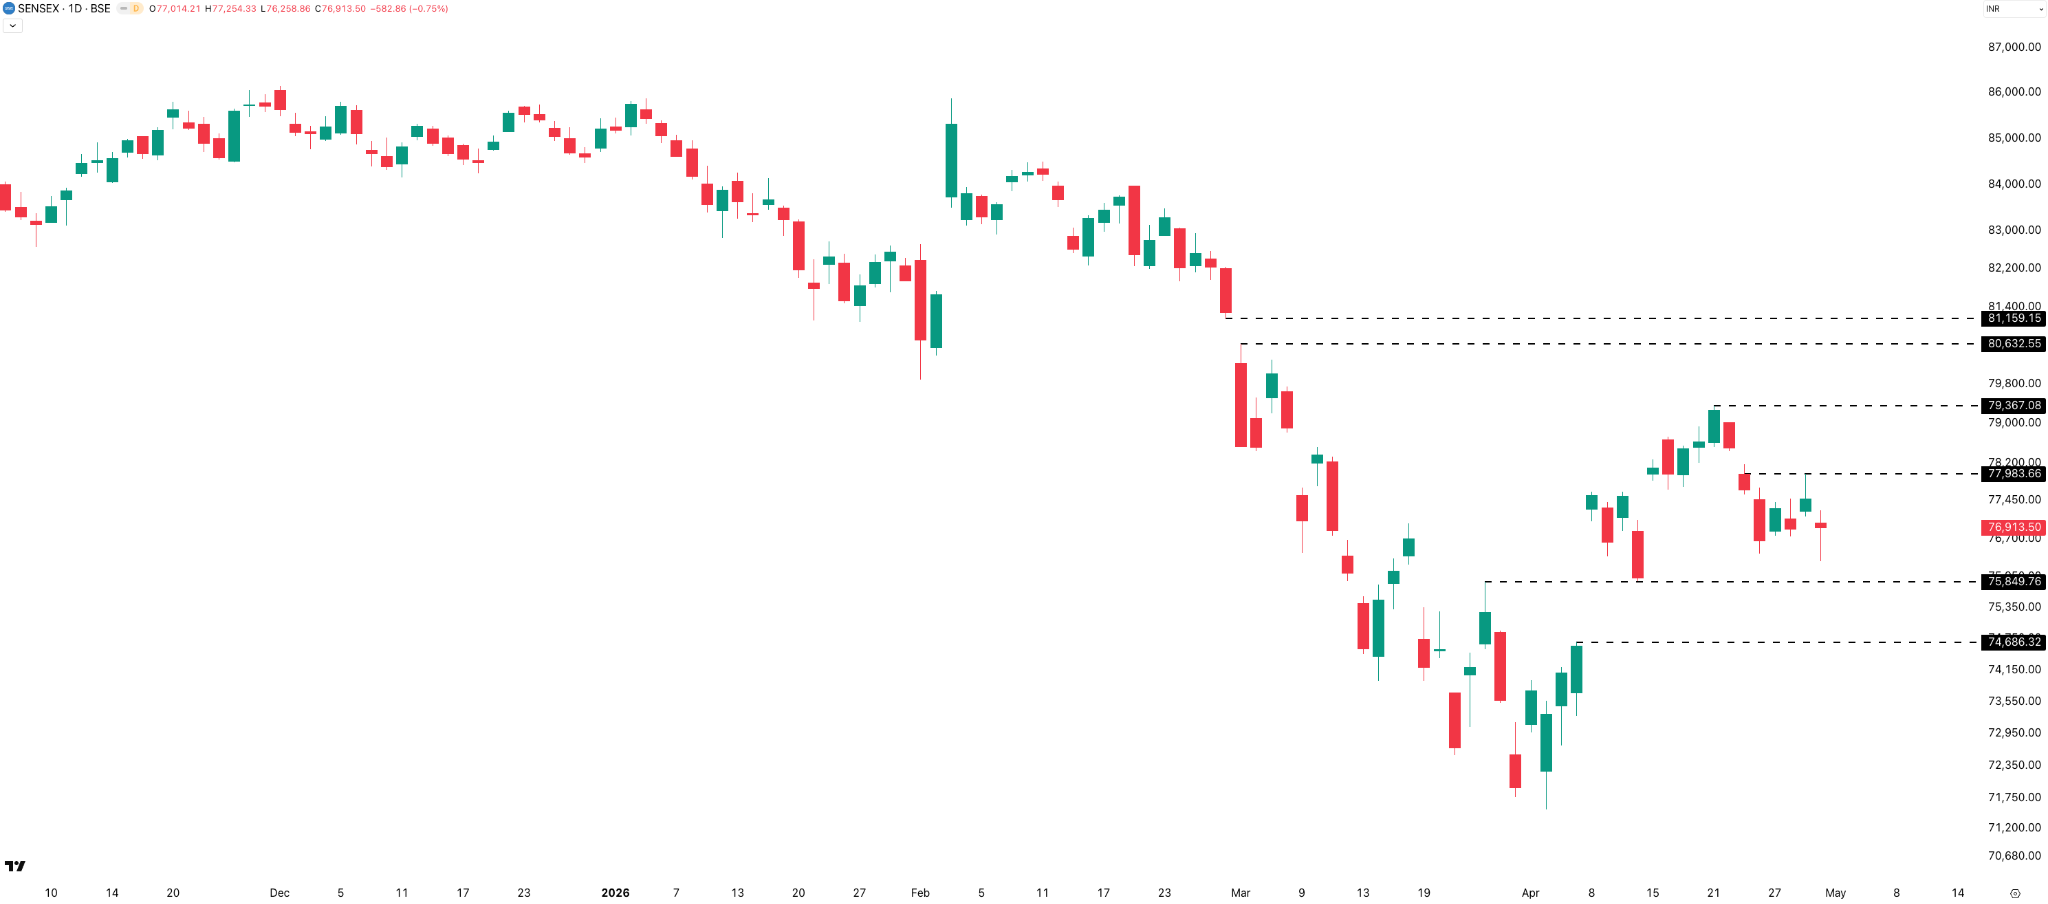
Sensex broke last week’s low just like Nifty, but did not sustain below it at the end of the day — recovering 650 points from the low made on Thursday to close at 76,914. Monday gave +0.83%, Tuesday -0.54%, Wednesday +0.79%, and Thursday -0.75%. None of the days gave a 1% move on a close-to-close basis, but the intraday volatility was through the roof — especially on Thursday, with an almost 1,000-point daily range.
Sensex Monthly Expiry — Thursday, 30 April
The index opened 583 points (or 0.75%) gap down and lost another 982 points before 11 AM, before bouncing 1,000 points until 2:45 PM. Then there was another 450-point down move, followed by a 350-point up move. Such was the volatility on Sensex’s monthly expiry. The ATM straddle opened at a mere 375 points, but premiums were jumpy throughout the day. Both expiries were tough for options writers — if you did not lose much, consider that a win.
BANK NIFTY
Weekly
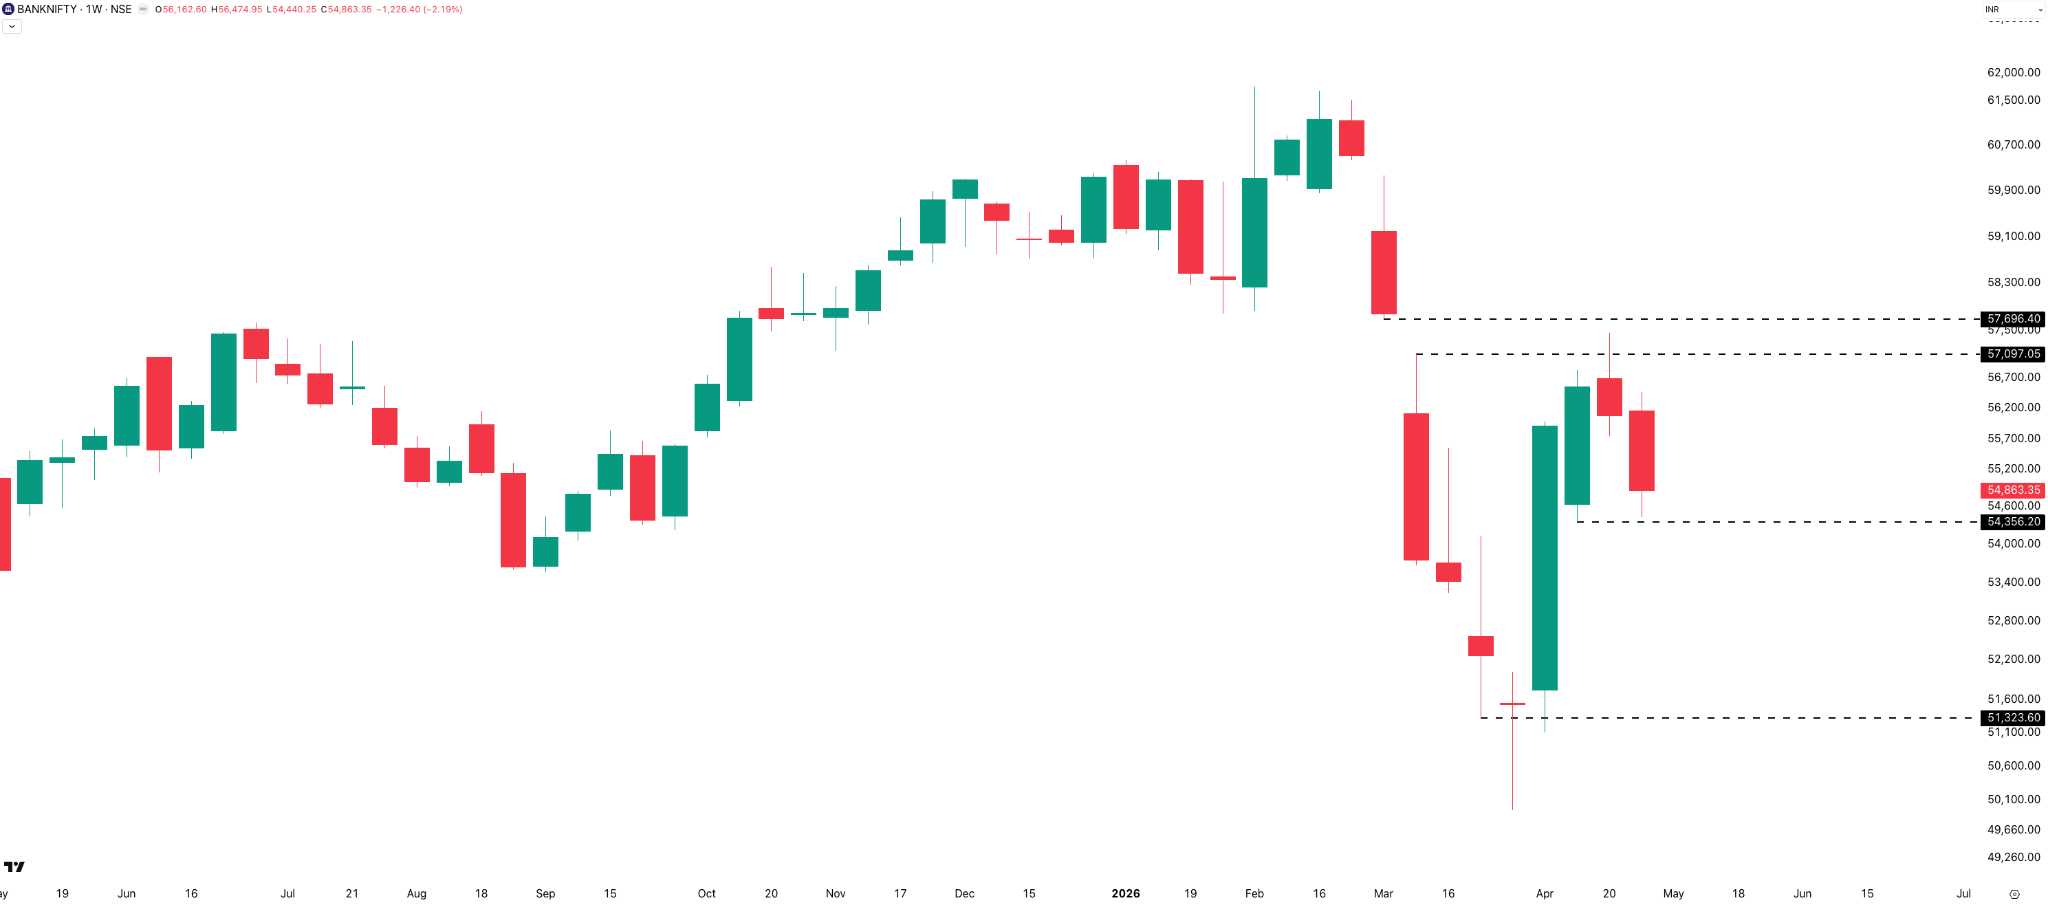
The index lost 1,226 points, or 2.19%, for the week, closing at 54,863. The previous week’s red candle looked like a minor pullback, but since we got follow-through on the downside this week, the directional bias is now bearish for Bank Nifty. The weekly range expanded from last week’s 1,705 to 2,035 this week — even though this was just a 4-day trading week.
Daily
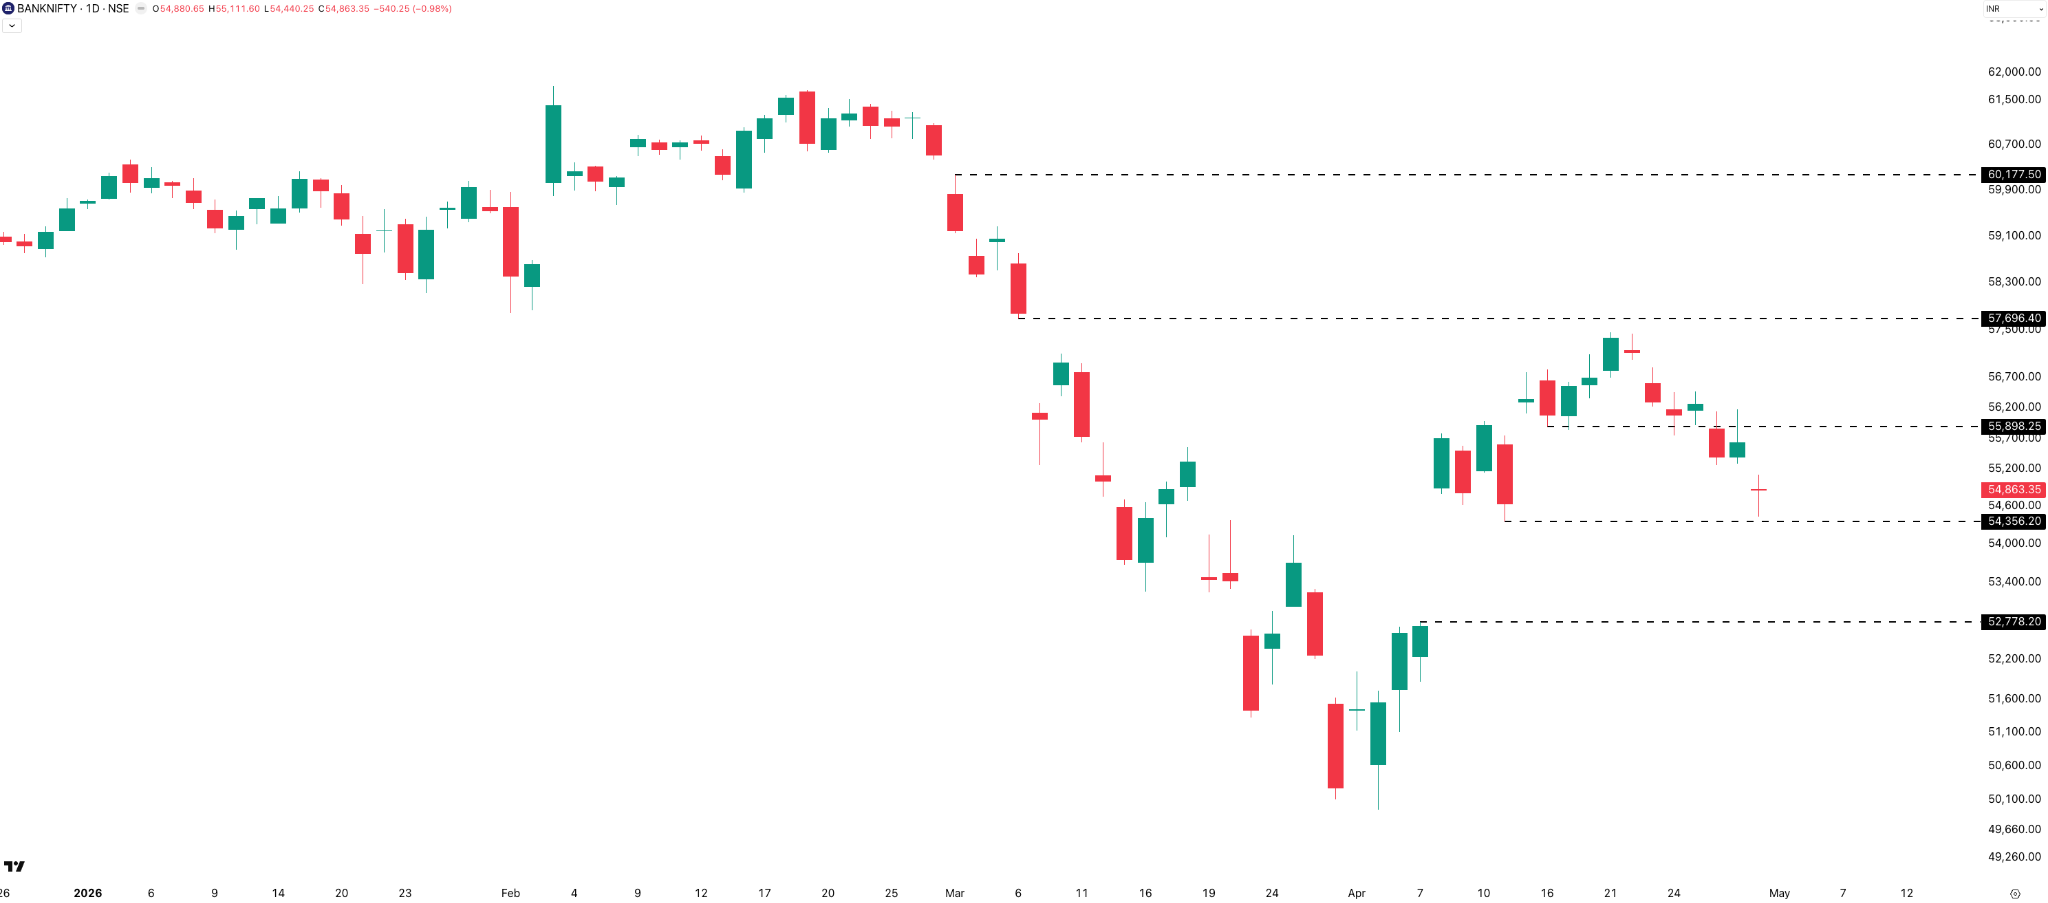
Bank Nifty made two 1%-plus candles on a close-to-close basis: Tuesday at -1.54% and Thursday at -0.98%. The other two days — Monday and Wednesday — saw gains of +0.31% and +0.01% respectively. Relatively speaking, Bank Nifty is weaker compared to Nifty, but the silver lining is that it is right at the support of 54,350. We will have to wait and watch what it does next week.
Hourly
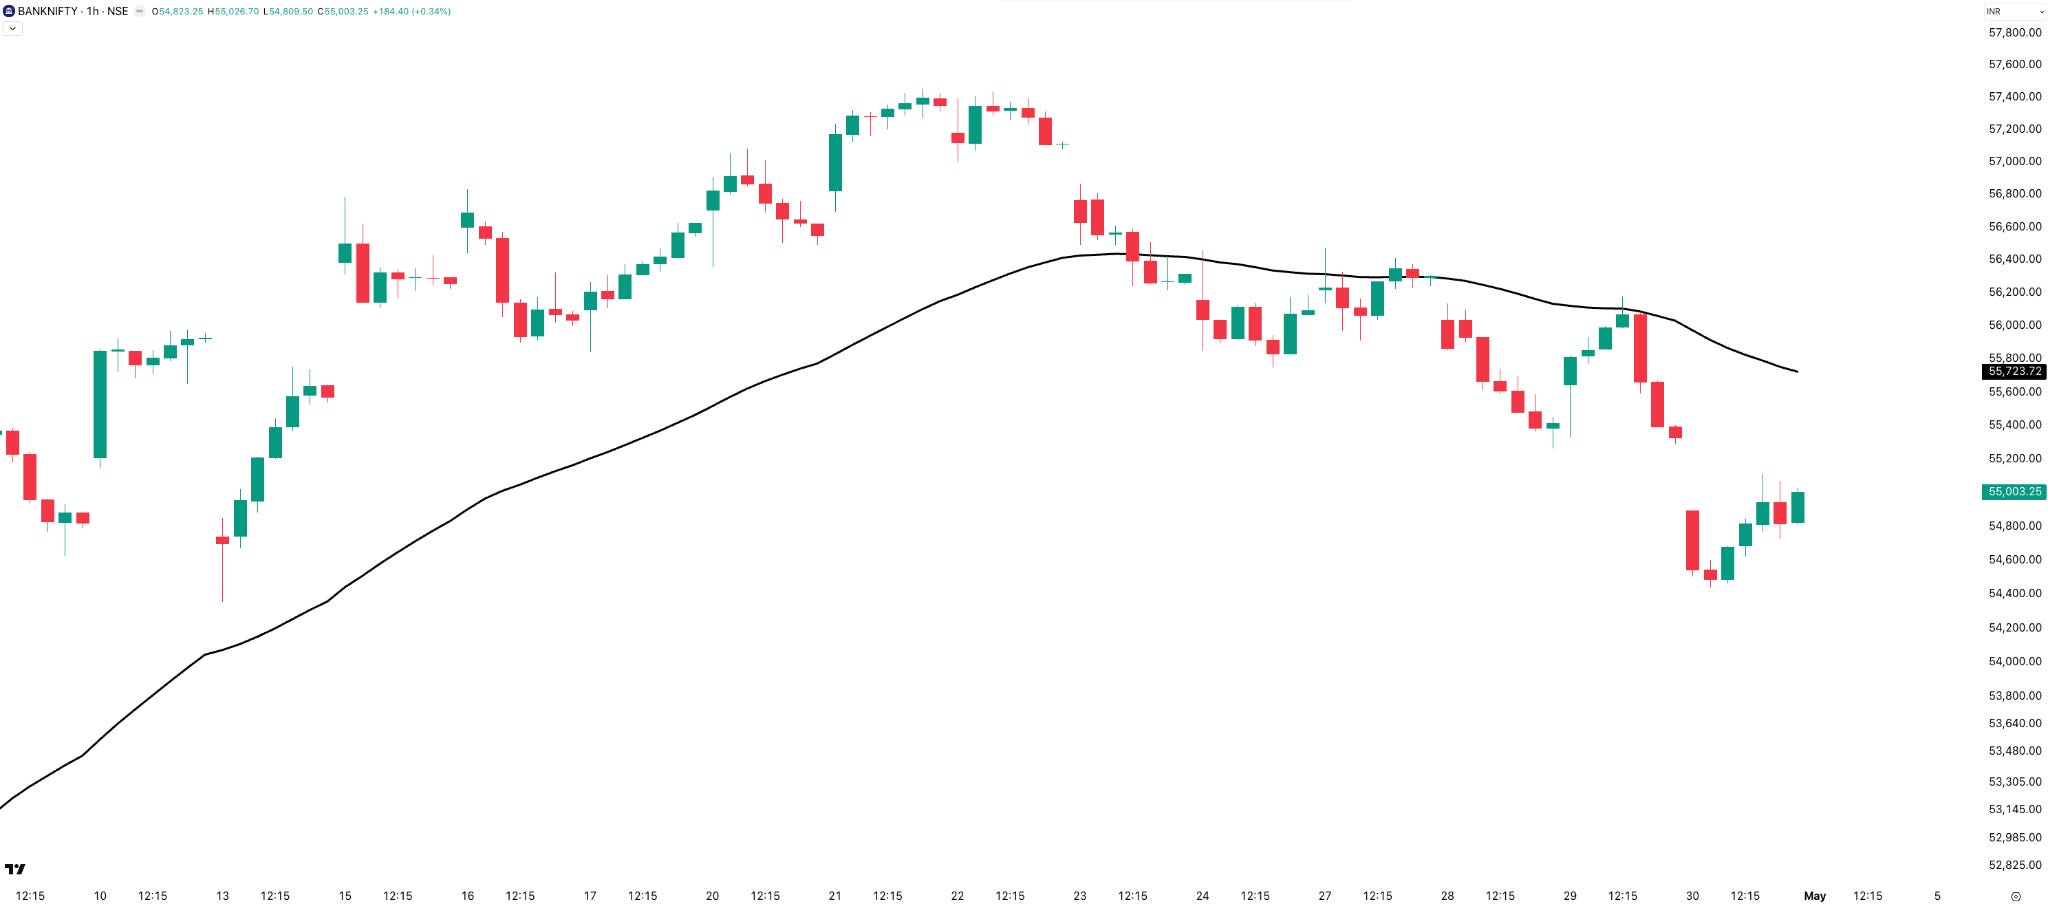
Bank Nifty stayed below the 50 EMA for most of the week, with Wednesday touching the EMA for only a brief time. For April, Bank Nifty gave clearer trends than Nifty. Let’s see what’s in store for May.
Section 2 — What to Expect in the Coming Week
This week, the resistance and support levels on almost all charts — weekly and daily — are exactly identical to last week, so there was less work to do in marking them out.
NIFTY
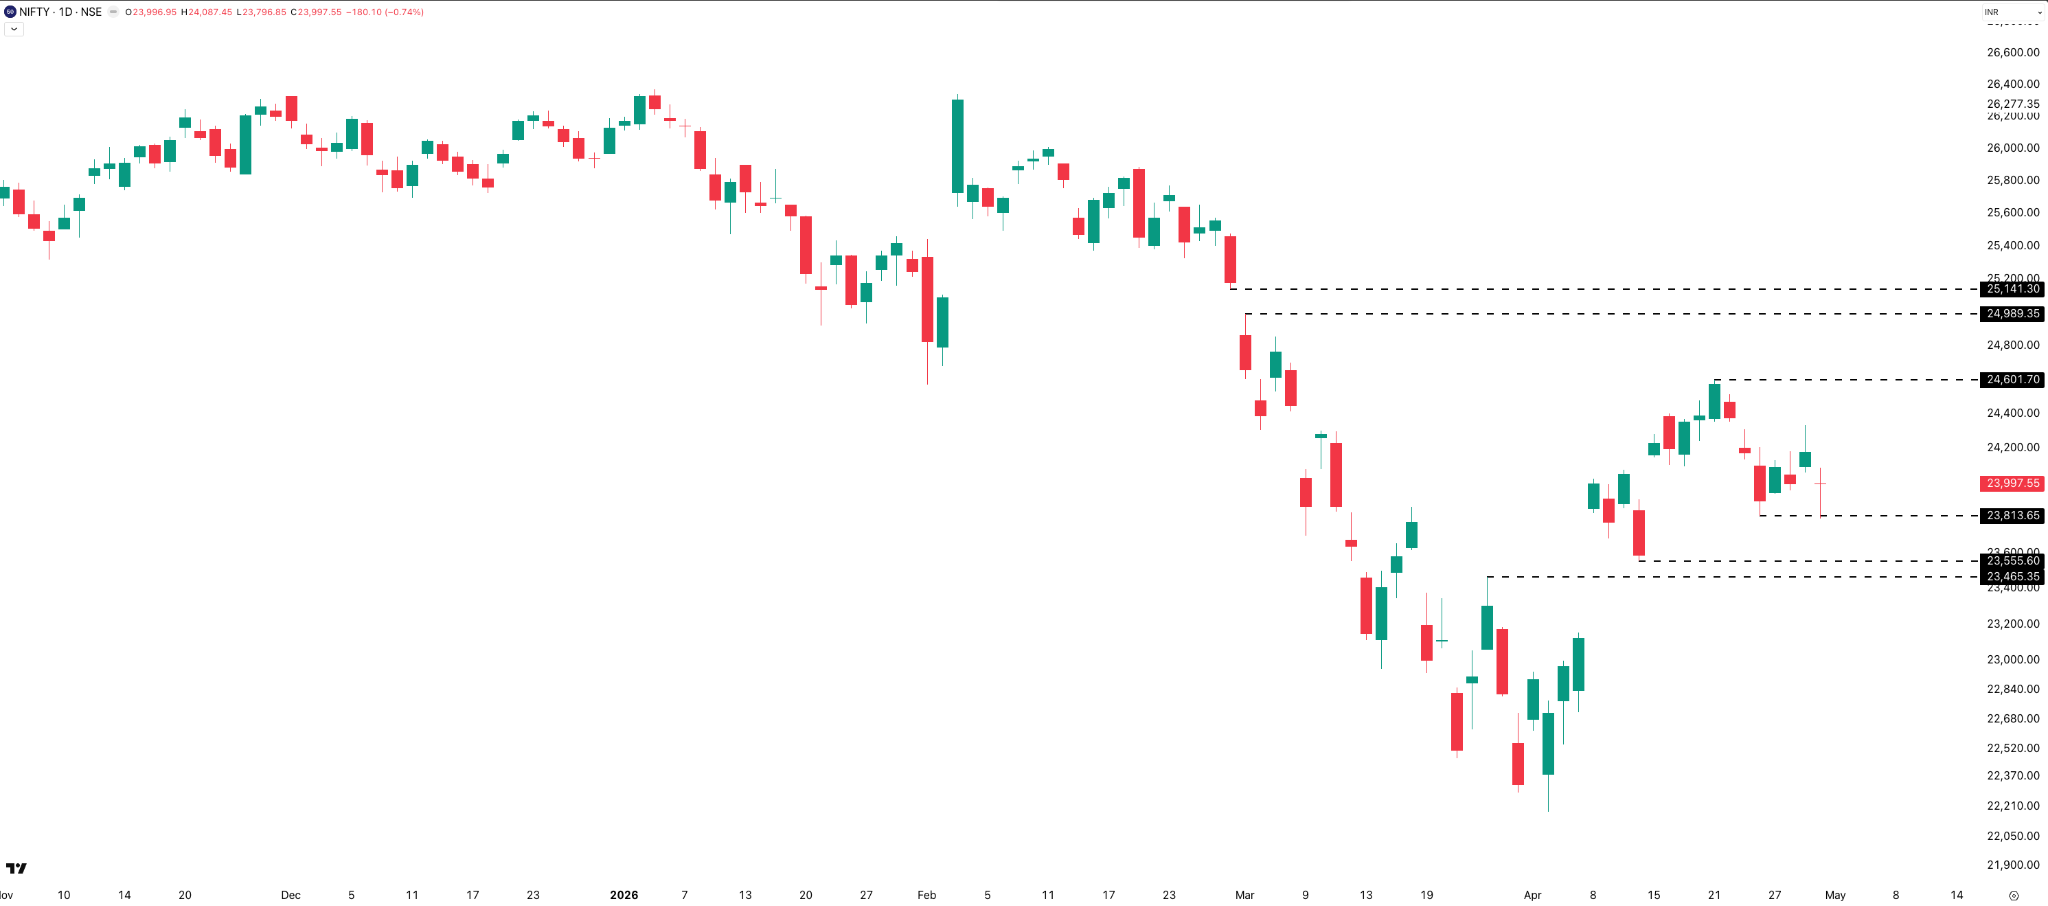
On the weekly charts, resistance is at 24,600, followed by the 25,000–25,150 zone. First support is at the past two weeks’ low of 23,800, and then at 23,550.
On the daily timeframe, immediate resistance stands at 24,600, which still coincides with the 100 EMA, followed by the 25,000–25,150 zone, consistent with the weekly view. For support, we are looking at 23,800 and then 23,550 — the same as the weekly levels.
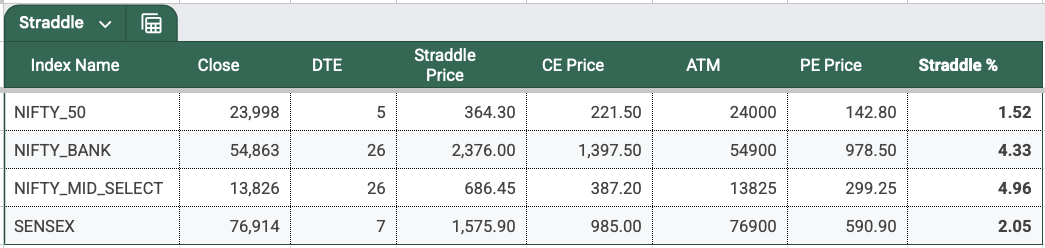
Since we’re five days away from expiry, the straddle premium may not be the right metric to gauge the range until the next weekly expiry. For reference, the ATM straddle premium is at 364 points — which feels super low, especially given we have a 3-day holiday ahead.
The overall bias for Nifty is still sideways to bearish , but Thursday’s sharp upmove may imply something. We shall find out in the coming week.
SENSEX
On the weekly chart, immediate resistance is at the 78,550–78,600 zone, followed by a major resistance zone between 80,650 and 81,150. On the support side, the levels remain the same as last week: 75,900, followed by the 72,700–72,500 area.
On the daily chart, resistance is located at 78,000 and then at 79,400, followed by the 80,650–81,150 zone. Supports are placed at 75,850 and 74,700.
Just like Nifty, the overall bias for Sensex remains sideways to bearish — but Sensex sits right at the support, so that’s the key level to watch.
BANK NIFTY
On the weekly chart, support and resistance levels remain the same as the last two weeks. The 57,100–57,700 zone is where the resistance sits. Support is at 54,350 and then further down at 51,300.
On the daily timeframe, the 55,900–56,000 zone is the immediate resistance, followed by 57,500–57,700. On the support side, the key levels to watch are 54,350, followed by 52,800.
Directional Bias Summary
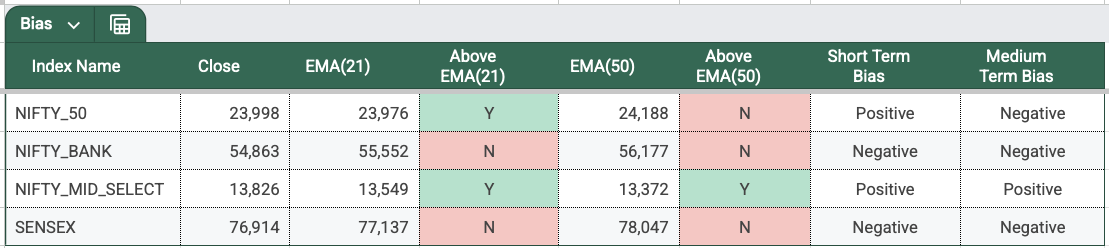
- Nifty and Midcap Nifty: Short-term bias is positive. Only Midcap Nifty’s medium-term bias remains positive.
- Sensex and Bank Nifty: Both short-term and medium-term biases are negative.
Nothing much to read here — just a muted week.
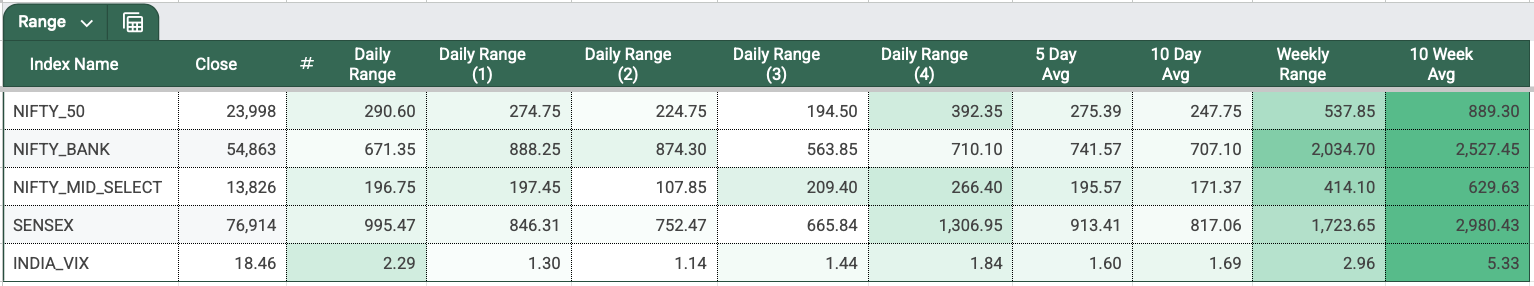
India VIX
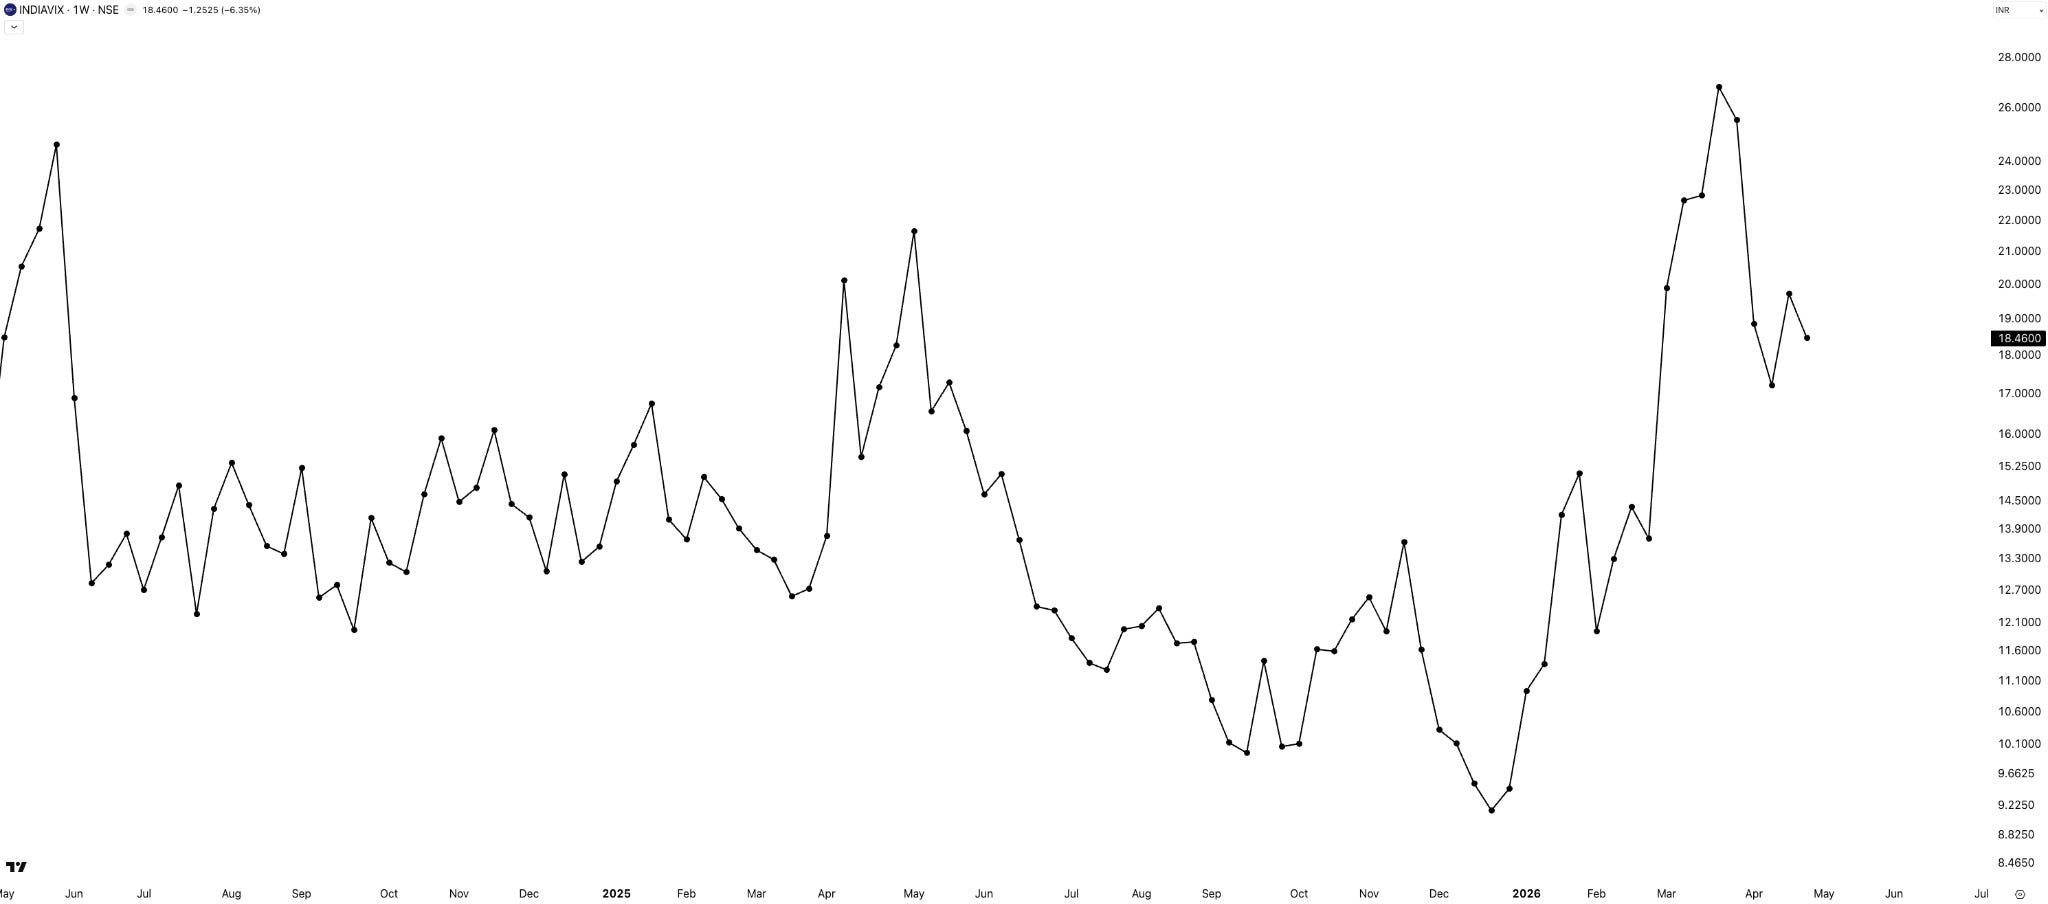
India VIX dropped 6.35% to close at 18.46. With so much intraday volatility this week, the VIX dropping makes little sense — but like many things in life, not everything has to make sense. Moving on.
Sectoral Performance — Tijori Indexes (TJI)
We are continuing to track the Tijori Indexes (TJI) — as shared last week, it’s a far more granular set of indexes with close to 82 of them, making it much easier to find pockets of outperformers in the broader market, especially if you are focused on stock picking.
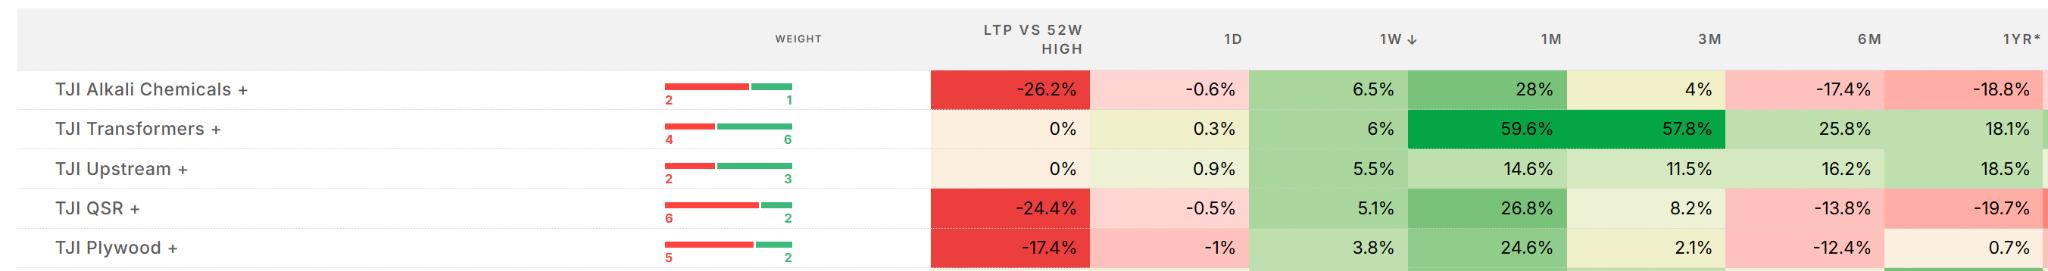
This week’s top five performers: Alkali Chemicals, Transformers, Upstream, QSR, and Plywood.
Among these, Transformers and Upstream clearly lead the pack — both are currently trading at all-time highs. The others have gained solid momentum over the last month, but remain a significant distance from their previous peaks, so we need to be more selective there.
A quick note on Upstream for those new to the oil and gas world: the industry is divided into three categories — Upstream (finding and extracting oil), Midstream (transportation), and Downstream (converting crude oil into more usable alternatives through refining). So, usually in an oil crisis, it’s the Upstream segment that benefits the most. That’s my basic understanding of the mechanics — if some of you know more, feel free to add in the comments. And there’s an interesting read on the second-order effects of this oil crisis later in the edition.
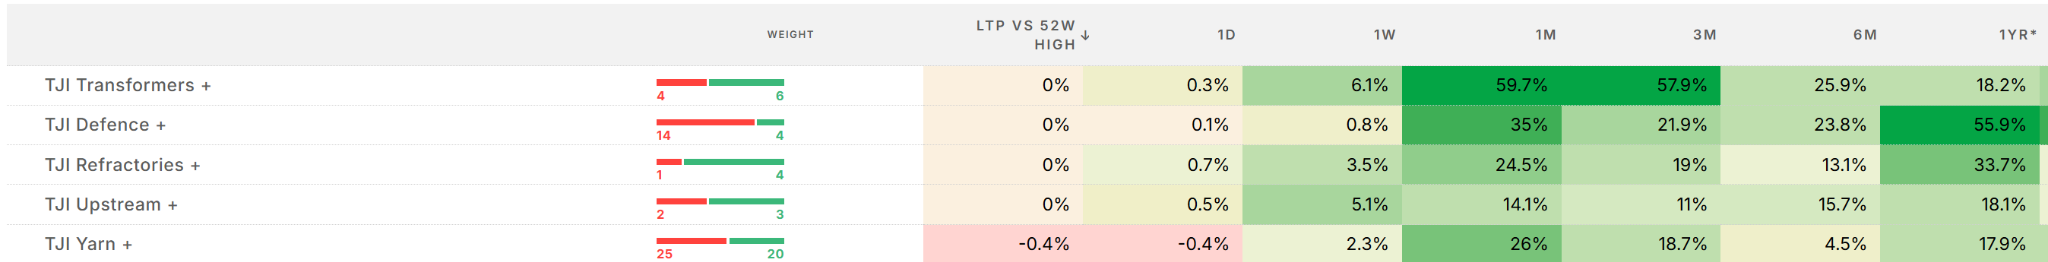
It’s also useful to look at sectors from the perspective of distance from their 52-week high — this view becomes especially useful when the broader index itself is in a drawdown. From this angle, Transformers and Upstream show up again, with Defense, Refractories, and Yarn rounding out the list.
As always, the next step is to double-click on these sectors and look at the stocks within them that are leading — and then take a call accordingly.
Commodities
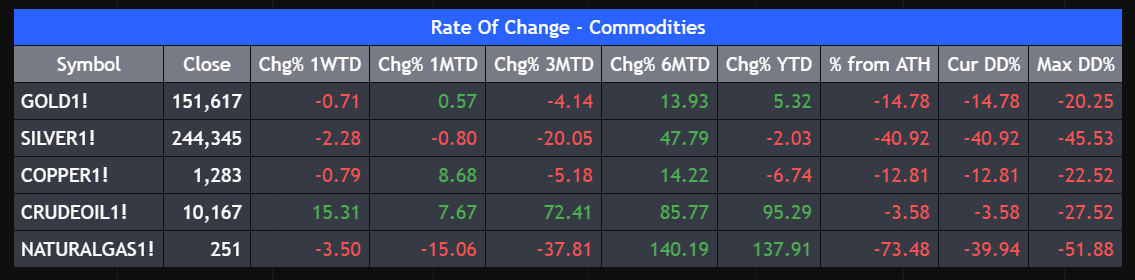
Commodities this week look very similar to last week. Precious metals — Gold and Silver — are in the red to flat. Copper is also flat. Crude oil is the standout with a 15% spike, which is expected given Brent trading at around $100. Natural Gas continues to move downward — which, as always said, is its inherent character. A mean-reverting sort of character.
Summary
Markets paused this week after the recent recovery, with indices largely flat and directionless. The uptrend has clearly slowed, shifting the tone to consolidation.
Nifty and Sensex are hovering around key moving averages, showing indecision, while Bank Nifty underperformed and looks weaker. Midcap Nifty continues to hold relative strength.
Volatility remained high despite a dip in VIX, with sharp intraday swings — signalling a shift from trending to choppy conditions.
Sectorally, strength is still selective, with pockets like Transformers and Upstream holding near highs.
Overall, the setup is sideways with a slight bearish tilt , as markets head into a new month.
What Caught My Attention This Week
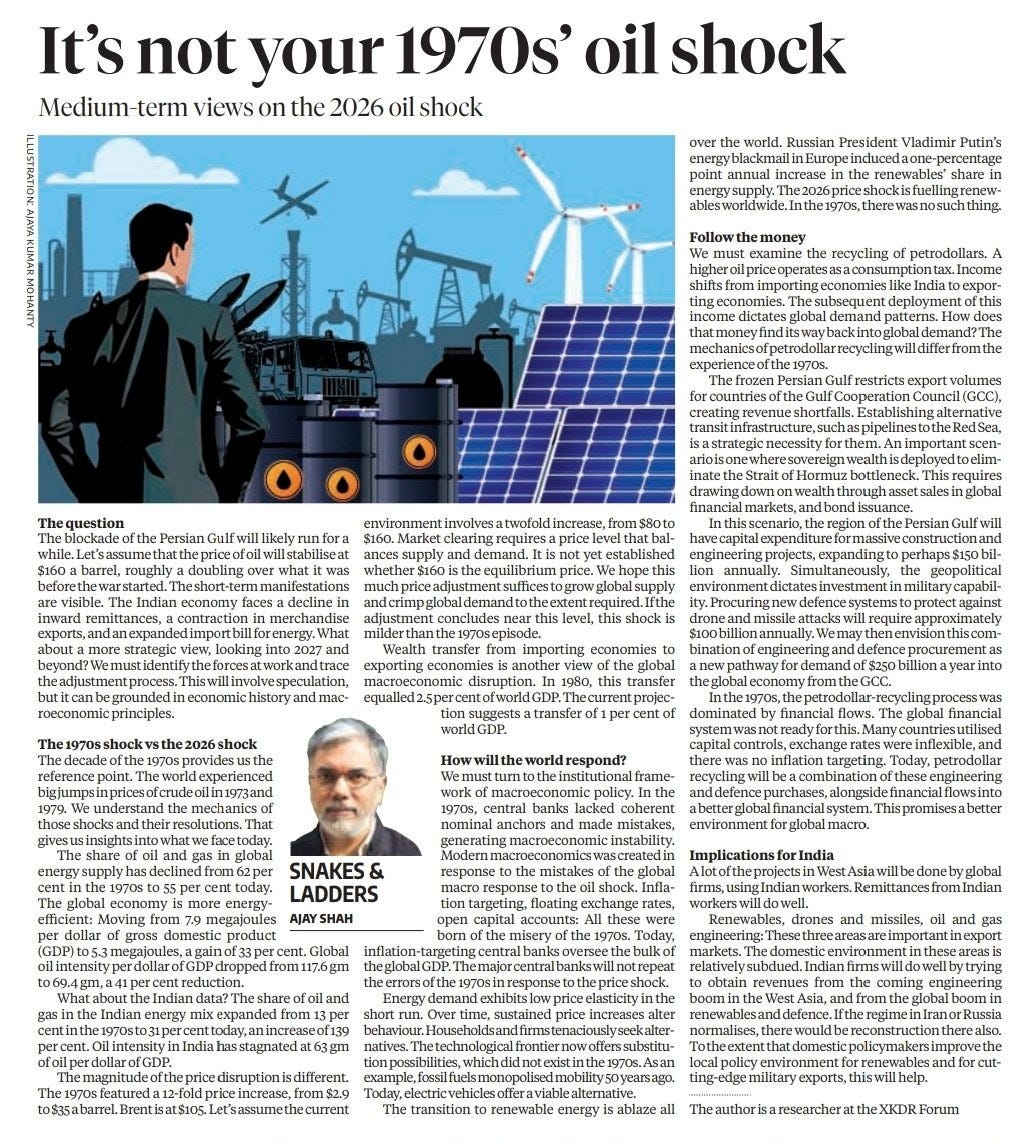
Read: Last week’s column by economist Ajay Shah titled “It’s Not Your ‘70s Oil Shock.” As the name suggests, the piece dissects the differences between the historic 1970s energy crisis and our current landscape. What’s particularly interesting is Ajay’s analysis of the second-order effects. It’s a short and good read. Read it here
Watch: An interview with the legendary Thomas Peterffy — pioneer in electronic trading and founder of Interactive Brokers — on the Odd Lots podcast. He dives into everything from insider trading and the impact of AI, all the way to the future of prediction markets. Another interesting watch. Watch on YouTube
Events to Factor In
Monday, 4 May, is the Assembly Election result day. Other than that, there are no major known events lined up for the coming week.
If you find this series useful, don’t forget to subscribe to the channel — and do share it with your friends.
Until then — stay curious, stay steady, and enjoy your long weekend.