Hello and welcome to the Weekly Market Metrics! I’m Sandeep Rao, and we are now in Week 23 of 2026.
Another week, and not much has changed.

Geopolitically, we’re still in the same uncertain place — the Iran peace deal remains a “maybe” and the war premium hasn’t gone anywhere. The rupee, which had briefly found some ground last week, closing near 95, is back under pressure, touching 95.78 mid-week as FII selling continued and crude stayed elevated.
And then there was the RBI gold story.
A Bloomberg report circulated this week suggesting the RBI may have sold nearly $12 billion worth of gold — possibly to defend the rupee and keep it from crossing the 100 mark. That rattled sentiment. The RBI came out on June 3rd and flatly denied it, and the PIB fact check backed them up, pointing to data showing gold’s share of India’s reserves has actually increased since September 2025. But the fact that the rumour gained so much traction tells you something about the mood in the market right now.
Also, the RBI left the repo rate unchanged in its Monetary Policy Meeting on Friday and lowered the GDP forecast from 6.9% to 6.6% while raising the CPI inflation projection to 5.1% for FY27, higher from the earlier estimate of 4.6%.
But markets read news differently, so amidst all of this, NIFTY closed 0.77% lower for the week at 23,367.
A Quick Note: Upcoming Varsity Live Session
Before I start, here’s a quick word about my upcoming Varsity Live Session on Commodities Basics; this time it’s going to be in Hindi.
I will be co-presenting the session with Prateek Sharma from Varsity.
So agar aapko commodities trading samajna hai, vo bhi Hindi mein, toh zaroor register kijiye. Ye live session June 20 aur 21 tarikh ko hai.
Aur haan, ye sessions bilkul free hain, aur ye session sirf live format mein hi attend kiya ja sakta hai — inki koi recording nahi hoti. Here is the Registration link
Now over to the next thing that I want to talk about.
Is 0DTE Trading Dead?
There’s something I’ve been wanting to address, especially for active traders reading this edition.
Over the past week or so, I’ve been noticing a lot of chatter — mostly on social media — about the possible death of 0DTE trading in India.
Is it dead? Is it not?
I thought I’d share some of my thoughts on that before we get into the numbers. So here’s what I’m thinking, and I would like to look at it from a much broader lens.
If you’re new to 0DTE trading, do watch the explainer where I explain it.
The Backstory
A lot of people — some of them good friends of mine — made an absolute fortune trading 0DTE between 2021 and 2024. Life-changing money.
And, interestingly, those are the exact same people who are now asking whether it’s all over.
I don’t dismiss their concerns. I very much understand where they’re coming from.
These traders had a very specific style — high leverage, 0DTE only, across indexes, day-in and day-out. And it worked beautifully. Returns were extraordinary, drawdowns were manageable, and the feedback loop was incredibly fast compared to positional strategies.
Fast-forward to today.
We’re down to just two 0DTEs; the volatility environment has shifted, throw in the war and geopolitical uncertainty — and the market feels completely different. For a lot of people who started trading post-2020, this is their first time navigating something like this.
I don’t blame them.
Every market regime is different, and you only truly understand that after going through a full cycle or two. That understanding doesn’t come from books or YouTube — it comes from years of just being in the market.
Why It Has Become More Challenging
So here’s my take on why 0DTE trading is not dead, but it has definitely become more challenging.
What may be struggling is a very specific style of trading that is leveraged to the hilt, anchored at 40–50% annual returns, reliant on a market environment that no longer exists.
For those traders, that version of the game may be over, but that doesn’t mean the whole story is dead.
There are broadly two kinds of traders here — discretionary and algo.
On the discretionary side, folks trade short timeframes, read price action, identify supply and demand zones, and sell options on the back of that. Leverage was always cranked up — far OTM options to reduce margin, halving the capital and doubling the apparent return. While it worked, the numbers looked spectacular.
But margin requirements went up for 0DTE with the introduction of ELM. Increased transaction costs became a real drag — hundreds of orders a day, every adjustment and re-entry adding up. And price action turned extremely choppy. Markets cycle through phases like this, and choppy phases expose the weaknesses of strategies built for a different environment.
On the algo side, the specific problem is over-engineering. Too many parameters, too many legs — looks incredible in a backtest, falls apart in live trading. But for many others, it may simply be a phase. Looking at CAGR is one thing; trading through the ups and downs to actually get there is another.
When Is a Strategy Truly Dead?
Which brings me to the bigger philosophical question — when do we actually call a strategy dead?
Is it dead because it underperformed for a year? Because it hit its historical maximum drawdown?
There are no easy answers. But it’s a question worth sitting with before drawing conclusions.
In this particular case, I don’t think we’ve reached that point.
When I look at the data, these strategies are still performing — not the way they did in their heyday, but they are not broken.
So what should traders do?
Diversify — across time horizons, across structures, reduce leverage, consider adding long options. Check the correlation between your strategies.
A portfolio of mediocre but uncorrelated strategies will often outperform highly correlated ones that all depend on the same conditions.
Markets evolve, and we as traders need to evolve with them — test new ideas, reset expectations, rather than spending time writing obituaries about strategies.
Market Metrics
Expanding Our Market Coverage
Before we get into the usual metrics, a quick note.
Many of you have been asking me to cover the broader market indices beyond just NIFTY, BANKNIFTY, and MIDSELECT.
Starting this week, I’m doing exactly that.
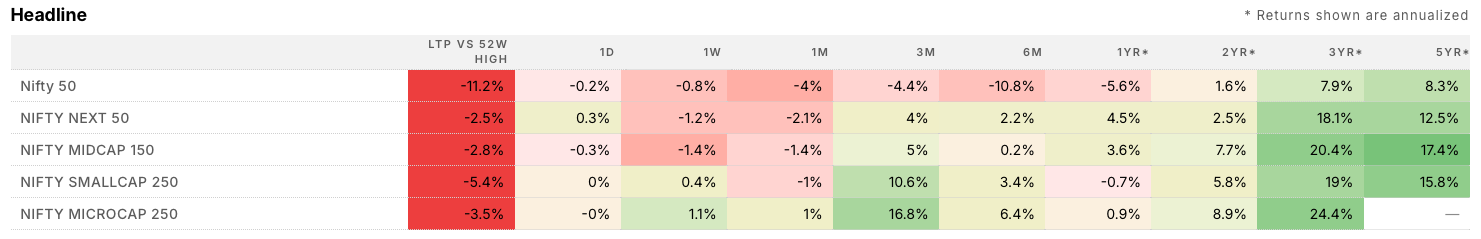
We’ll now be tracking five headline indices — NIFTY 50, NEXT 50, MIDCAP 150, SMALLCAP 250, and MICROCAP 250.
Together, these cover the entire NIFTY Total Market universe, so we’re now looking at the full picture.
Rate of Change (ROC) Across Indices
So let’s start with the first week of June 2026.
NIFTY 50, NEXT 50, and MIDCAP 150 all ended the week in the red, losing anywhere between 0.8% and 1.4%.
The smaller end of the market held up better — SMALLCAP 250 managed a minor gain of 0.4%, and MICROCAP 250 led the pack with a 1.1% gain for the week.
Now, if you look at where each index sits relative to its 52-week high, the divergence is quite telling.
NIFTY 50 is the farthest from its peak, down 11.2% — that’s a significant gap.
On the other end, NEXT 50 is the closest, just 2.5% away from its high, followed by MIDCAP 150 at 2.8%.
Year-to-Date Performance
If we look at the YTD numbers for these headline indices:
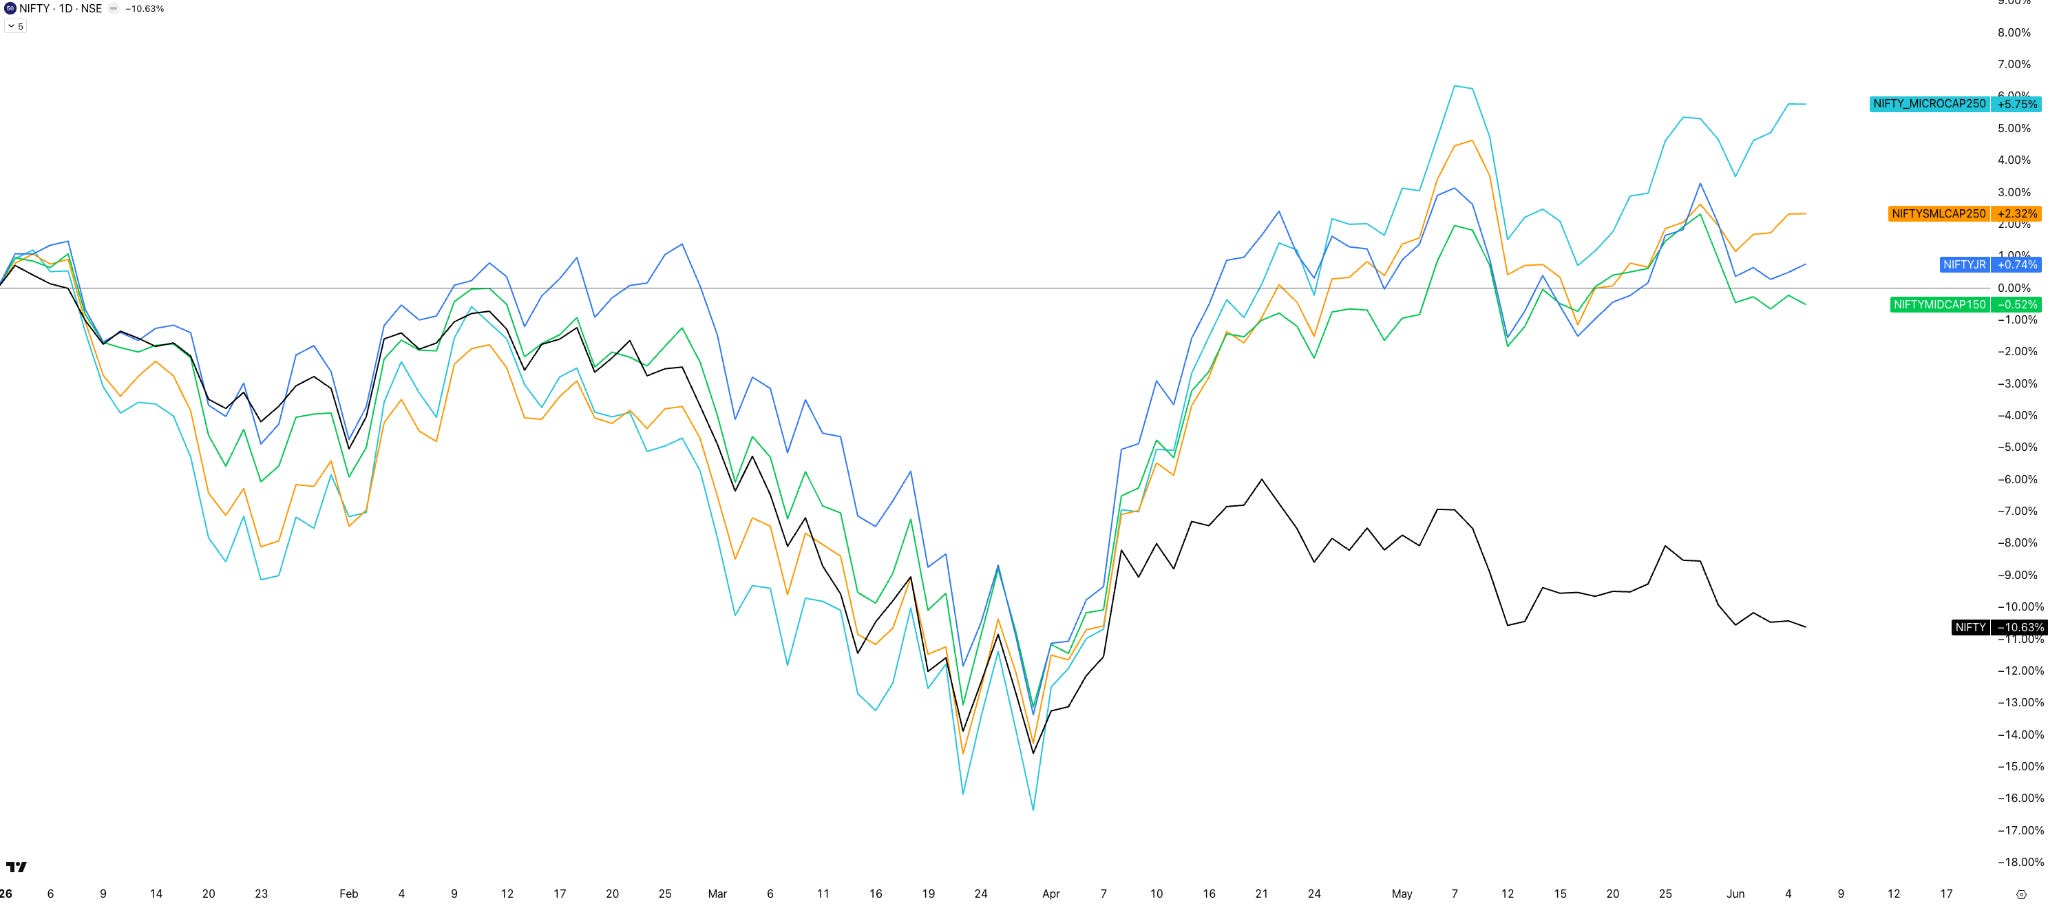
- NIFTY 50: -10.63%
- MIDCAP 150: -0.52%
- NEXT 50: +0.74%
- SMALLCAP 250: +2.32%
- MICROCAP 250: +6.75%
NIFTY 50 is the clear laggard, while MICROCAP 250 continues to lead the pack.
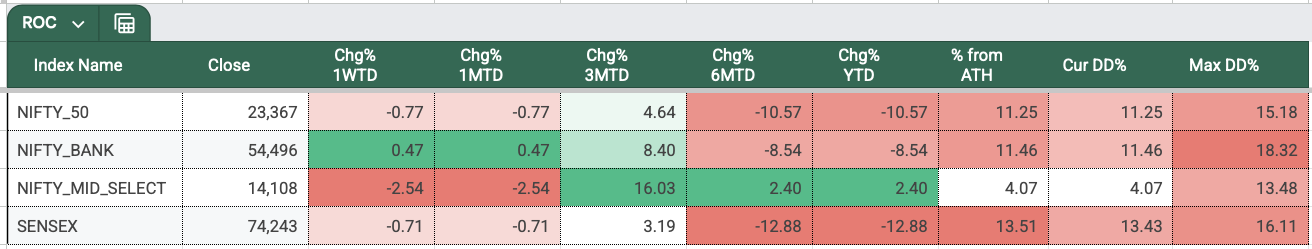
And if you want the ROC chart from the weekly market sheet, NIFTY Bank stands out this week.
NIFTY Across Timeframes
Weekly Timeframe
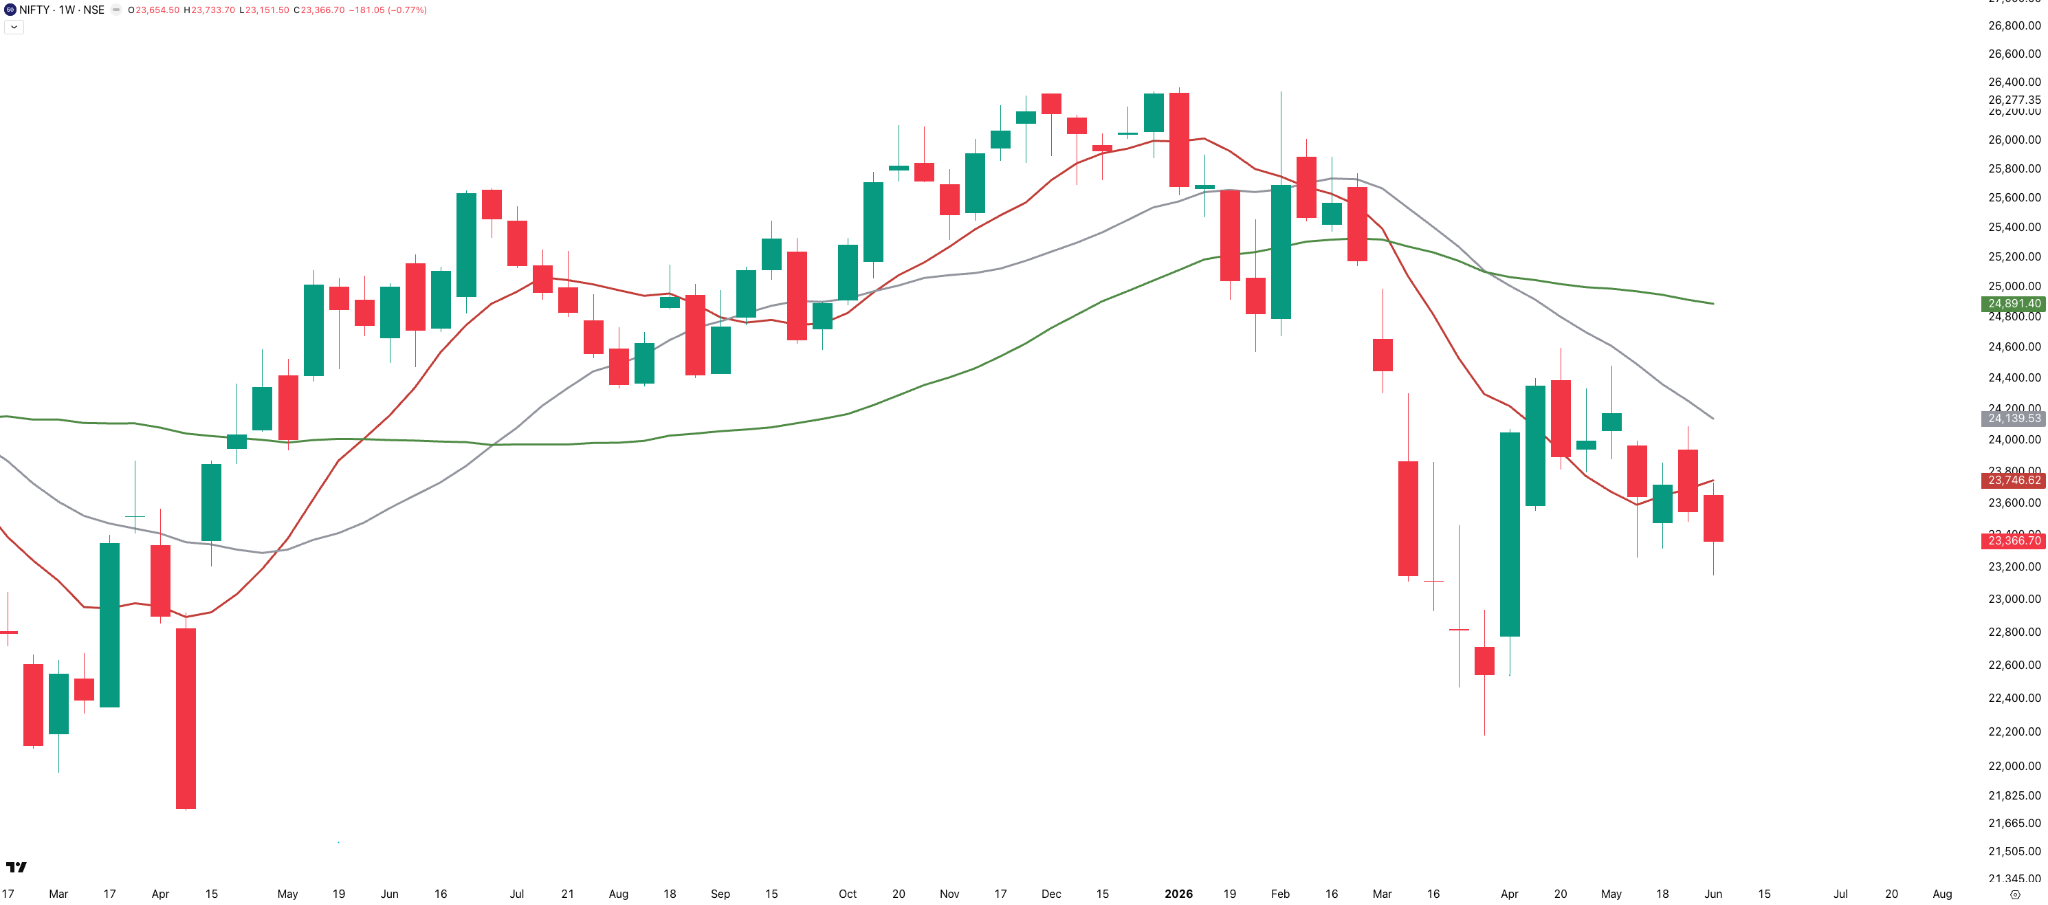
This week, NIFTY lost 181 points, or 0.77%, to close at 23,367 — and it continues to trade below all its key weekly moving averages.
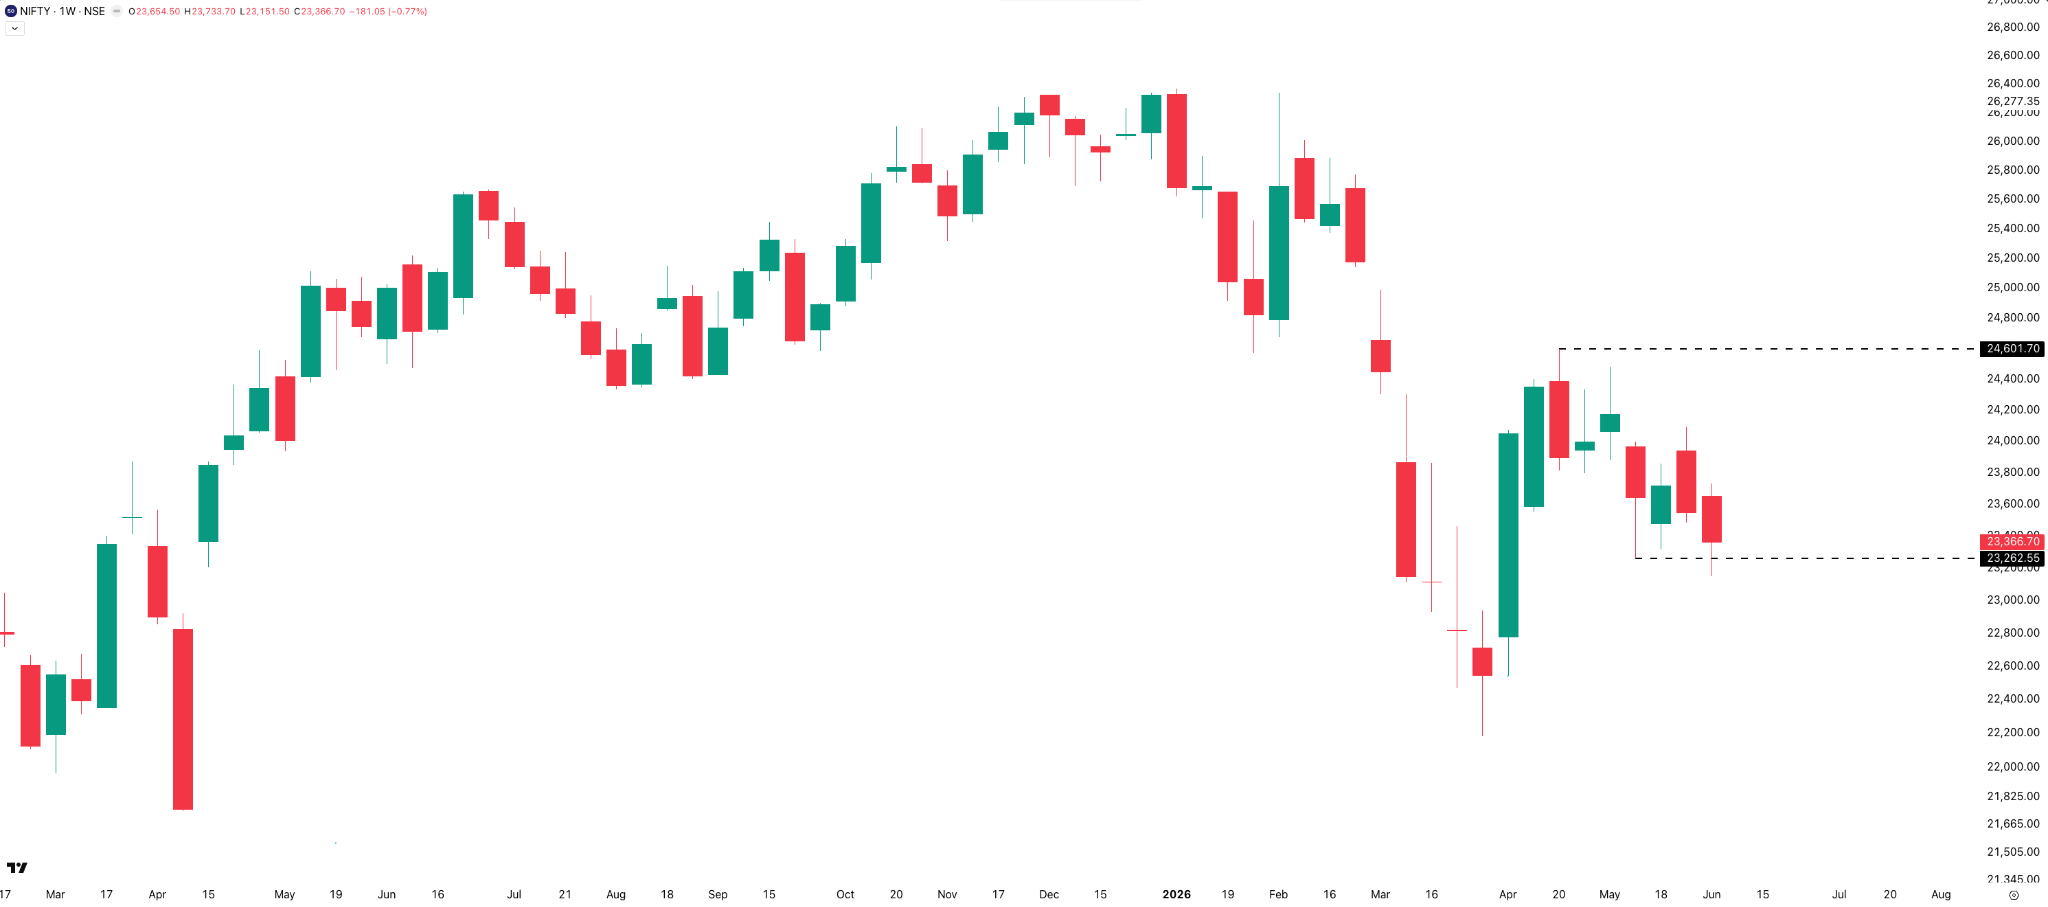
As I mentioned in last week’s edition, NIFTY remains stuck in that broad range between 24,600 and 23,250.
This week it actually attempted a breakdown below that range, making a low of 23,150 — but ultimately closed back within it.
We are now eight weeks into this consolidation, inside a 1,450-point range.
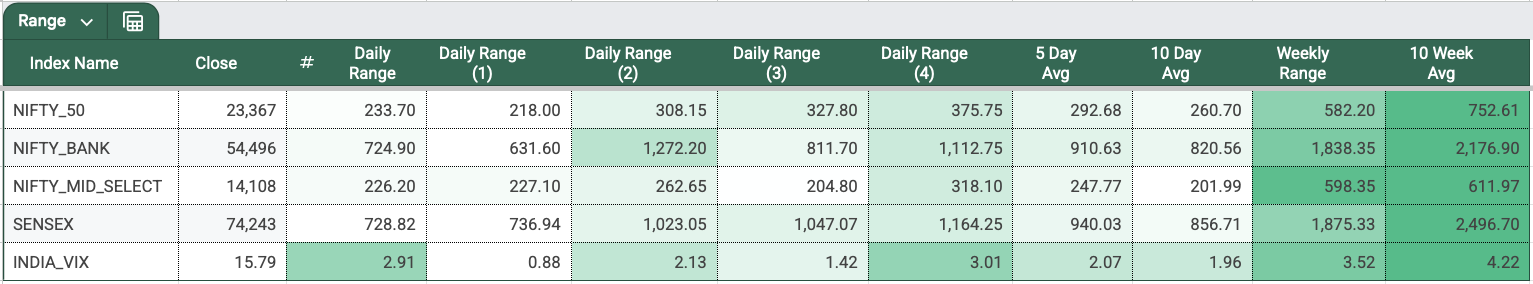
The weekly range remained almost unchanged from last week — 582 points this week versus 605 points last week.
On the daily timeframe, Monday saw the widest range at 376 points, while Thursday came in as the narrowest at just 218 points.
Interestingly, both of those days happened to be weekly expiry days.
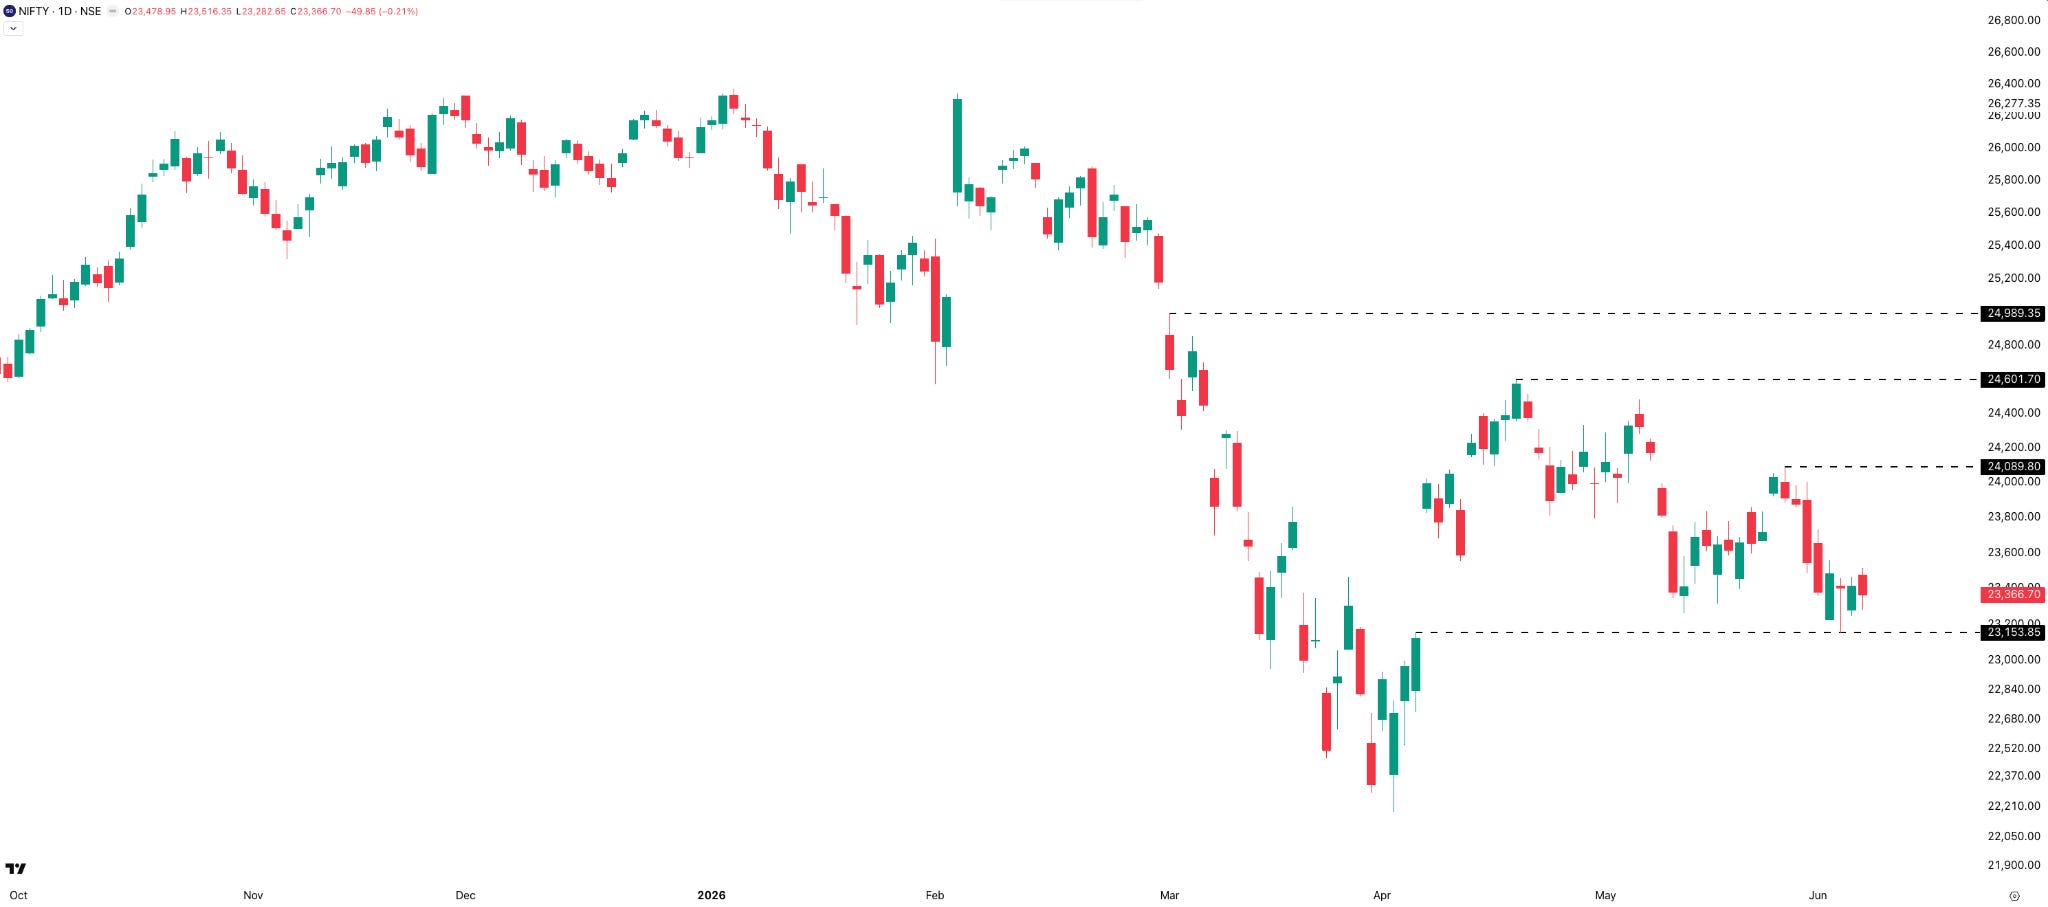
Daily Timeframe

This week’s price action was much cleaner than the previous week, with the index largely moving in one direction — downward.
The notable moment came on Wednesday, when NIFTY filled the April 7th gap at 23,150 and bounced back almost to the point from that exact level.
The fact that NIFTY has not breached that level by the end of the week makes it an important support zone to watch going into next week.
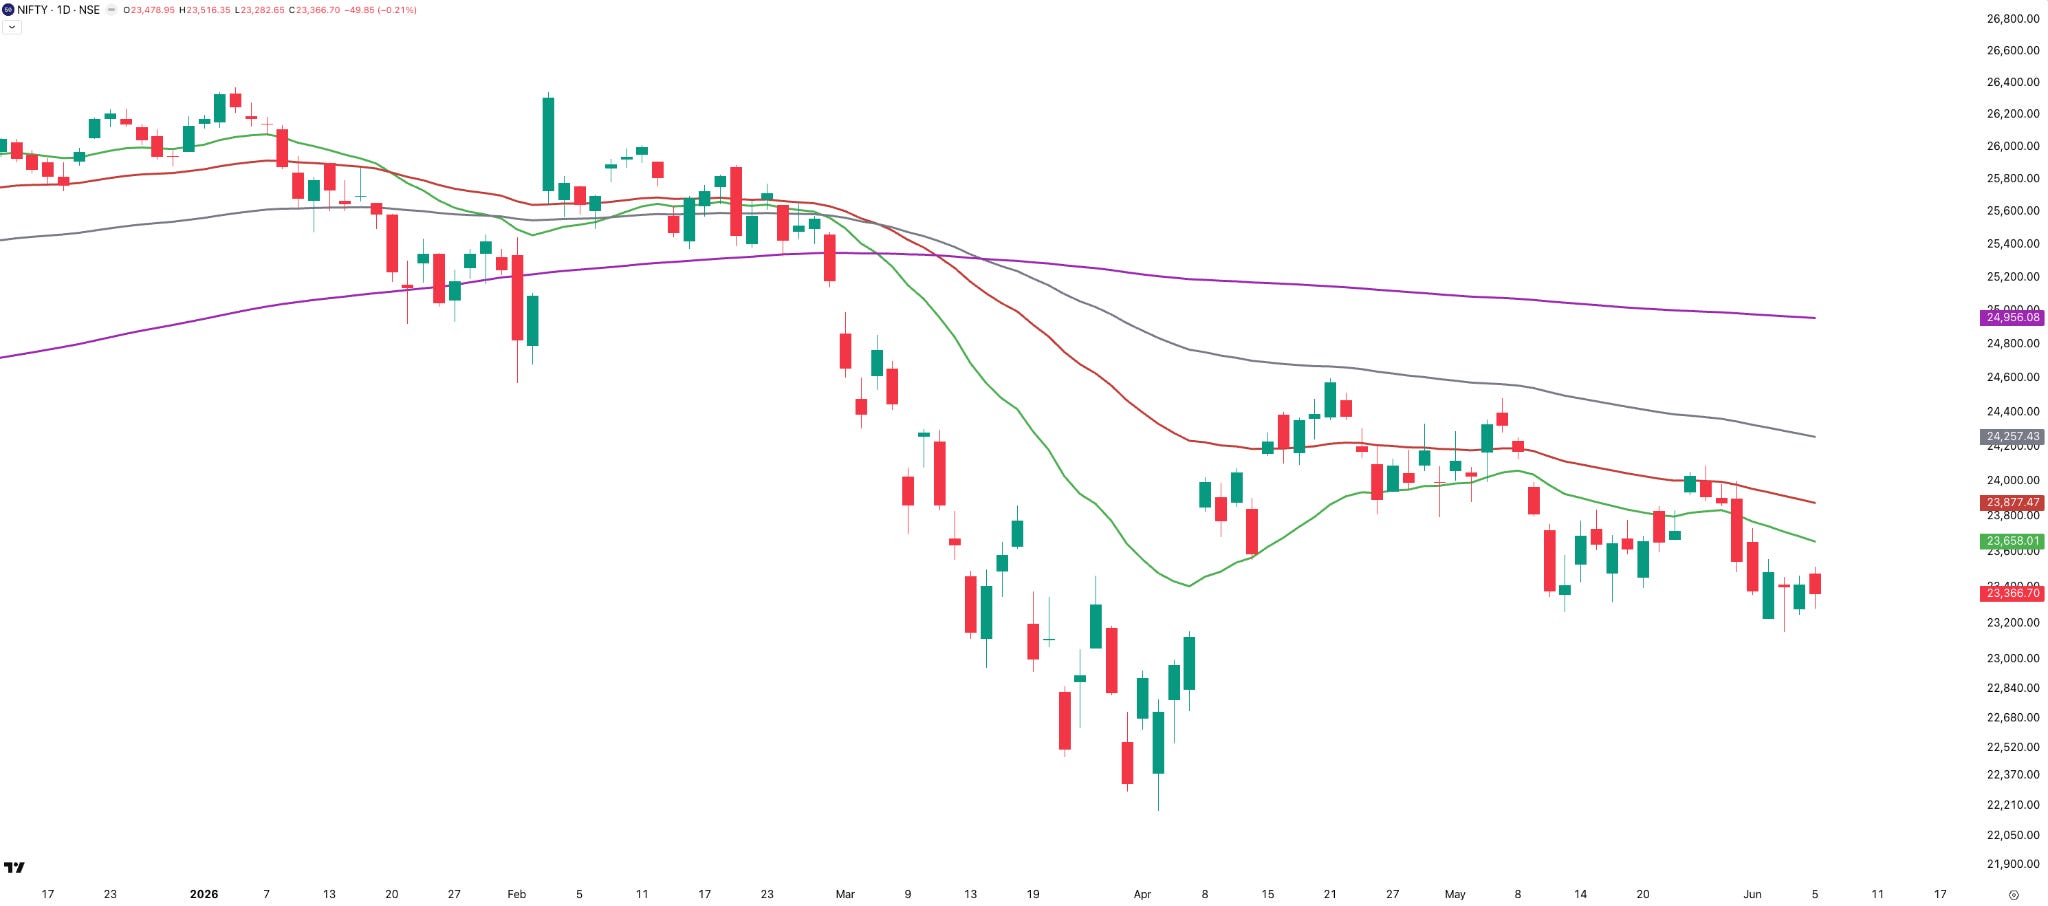
In Week 23 of 2026, NIFTY continues to trade below all its key moving averages — the 21, 50, and 100-day EMAs, as well as the 200-day SMA.
Nothing has changed on that front from the previous weeks.
Hourly Timeframe
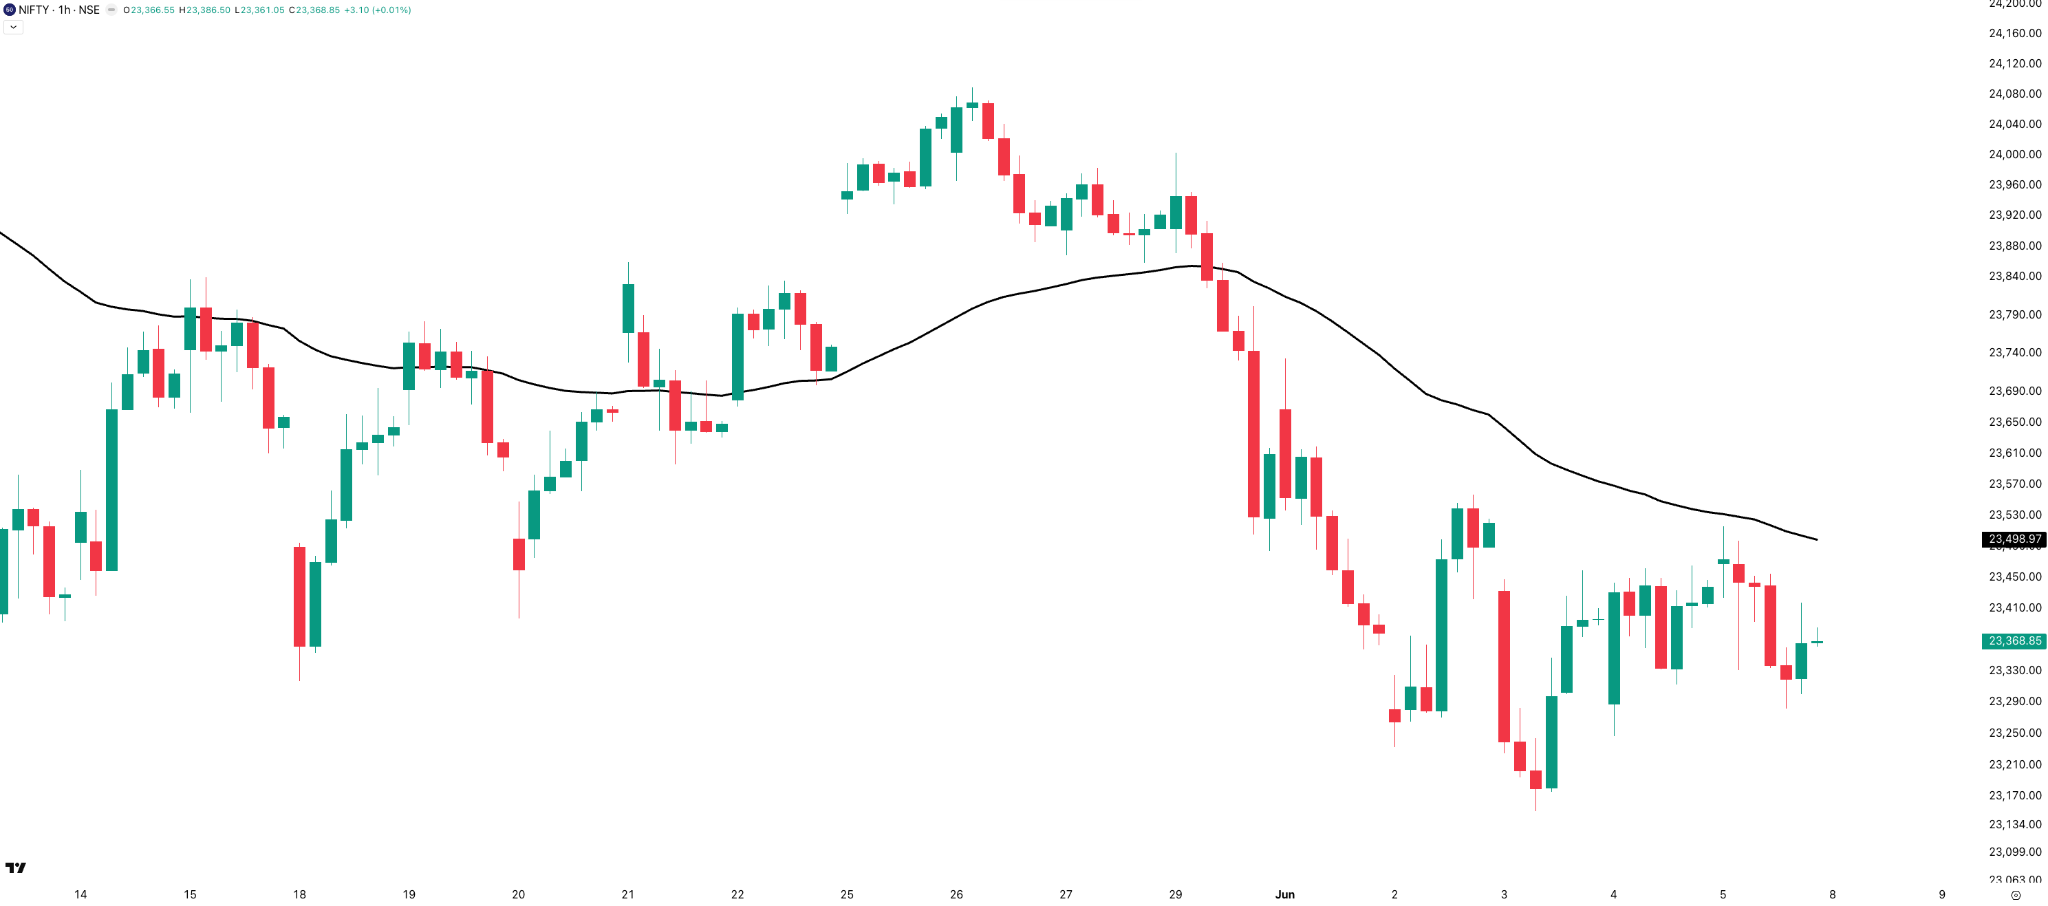
On the hourly chart, NIFTY showed clean price action this week, staying below the 50 EMA throughout.
There were some pullback attempts on Tuesday, Wednesday, and even Friday — but none of them had enough strength to push the price back above the 50 EMA.
Weekly Expiry Review
Talking about the NIFTY weekly expiry on Tuesday:
It had the second-highest daily range of the week at 328 points.
The index opened gap down, with the straddle premium at 122 points.
After the first five minutes, right through till 12:30 PM, it just went sideways in an 115-point range — nothing exciting.
But post 12:30 PM, things got interesting.
There was a sharp upmove of almost 285 points all the way till 2:30 PM, followed by a quick 135-point reversal till 3 PM, and then one final upmove of around 100 points into the close.
So the second half of the expiry was quite volatile.
The only ones who really made decent money were those who caught that 12:30 PM to 2:30 PM move.
For the non-directional player, there wasn’t much on the table.
What to Expect in the Coming Week
Key Levels to Watch
With the April 7th gap now filled, 23,150 becomes the key support level to watch on the downside, while 24,100 remains the resistance on the upside.
Anything that happens in between is essentially sideways noise or a pullback — nothing structurally meaningful.
Market Bias
The overall bias for NIFTY remains bearish to sideways — same as last week, no change there.
What the Straddle Is Pricing In
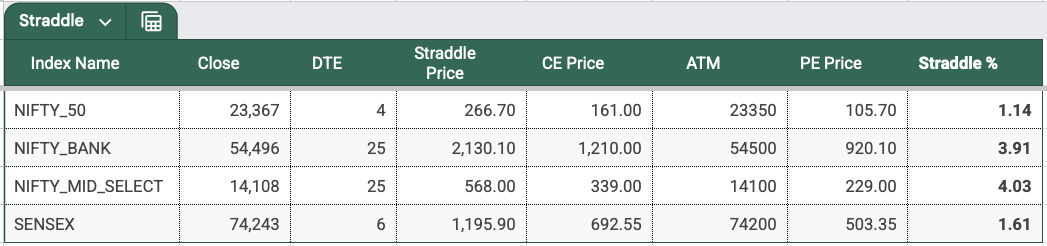
The NIFTY ATM straddle closed at 267 points, down from 319 points last week, implying an expected move of roughly 1.14% on either side.
That gives us an expected range of:
- 23,634 on the upside
- 23,100 on the downside
Looking back at last week’s straddle pricing, realised volatility was significantly higher than what the options market had priced in — something worth keeping in mind when sizing trades this week.
India VIX
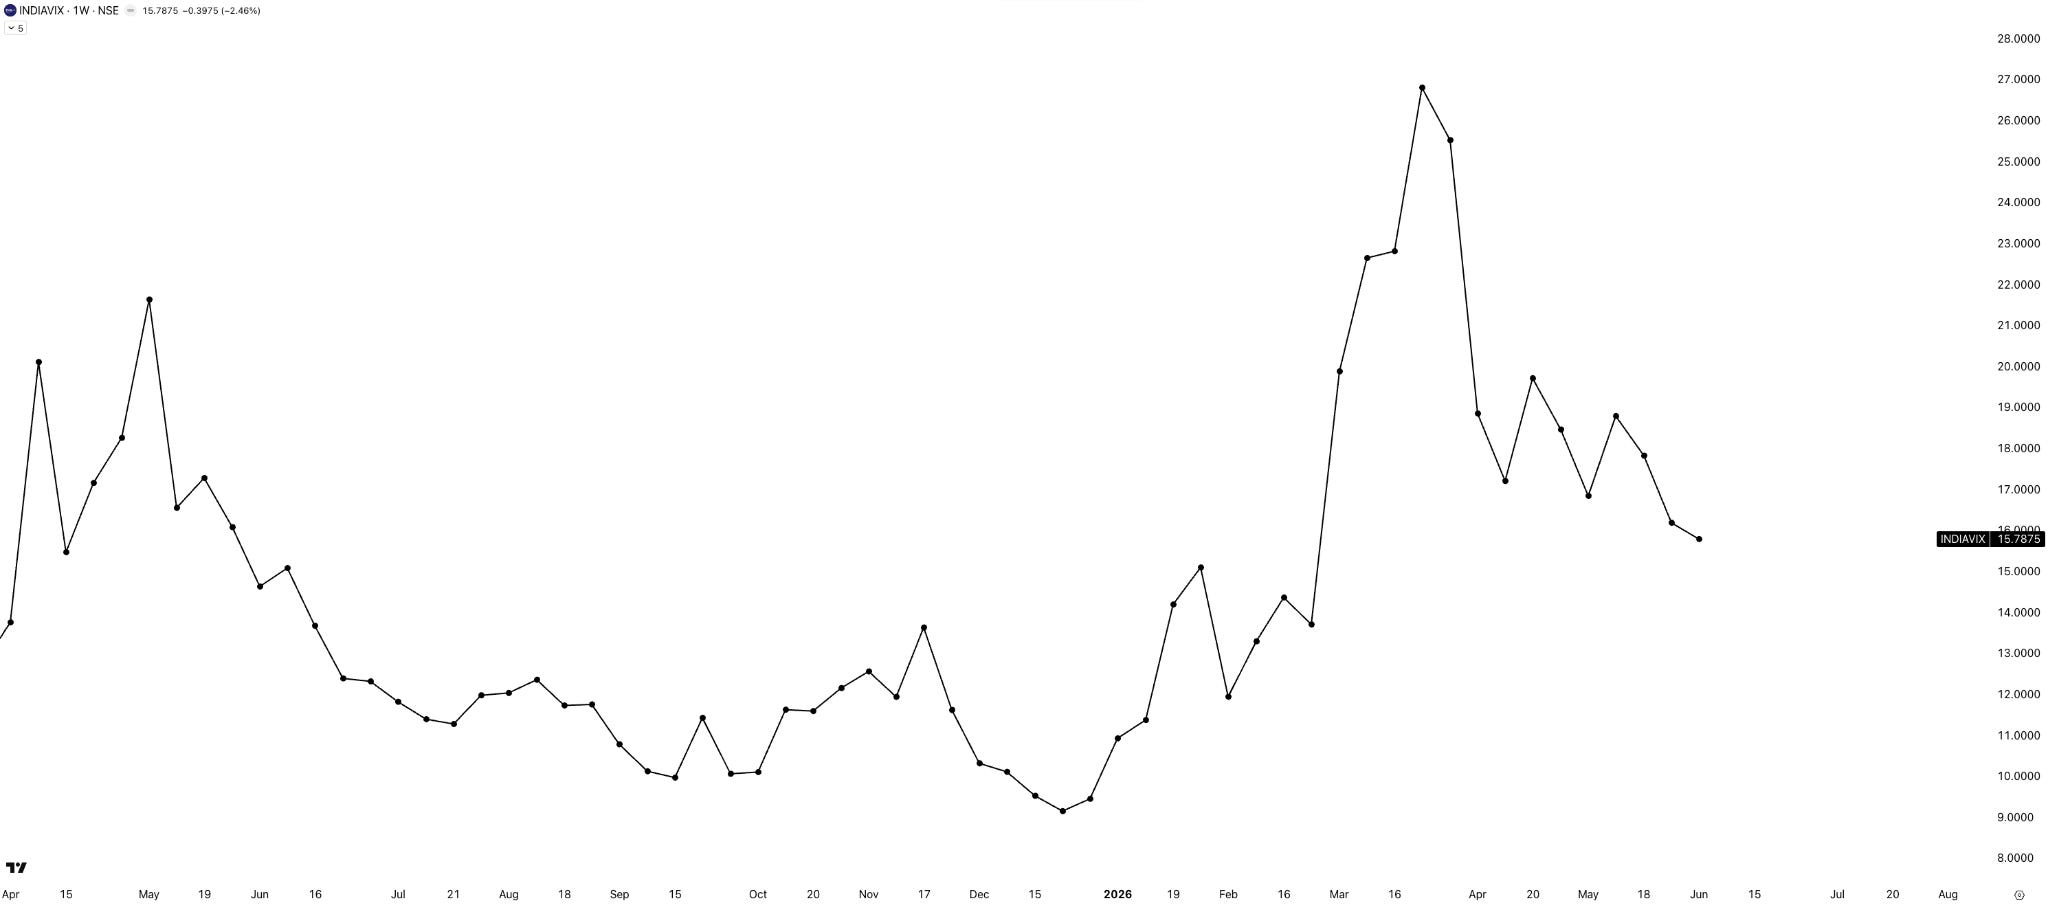
India VIX fell 2.5% this week, closing at 15.79. Nothing much to read there.
Sectoral Performance
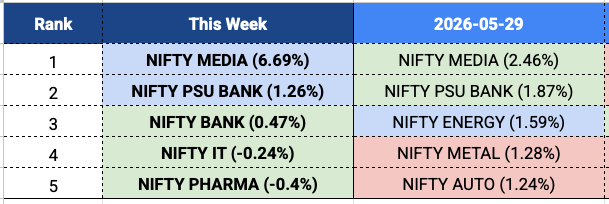
NIFTY MEDIA tops the list this week with a 6.7% gain, holding on to the same top spot it occupied last week.
PSU BANK comes in second at 1.26%, also a carryover from last week’s second position.
As I always say — continuity across weeks is worth paying attention to, and both MEDIA and PSU BANK showing up again is a signal worth watching.
Themes Worth Watching
If we look at the more granular Tijori indices, Communication Equipment continues to hold up well across timeframes.
It is followed by:
- Upstream
- Dairy Products
- Textiles
- Dyes & Pigments
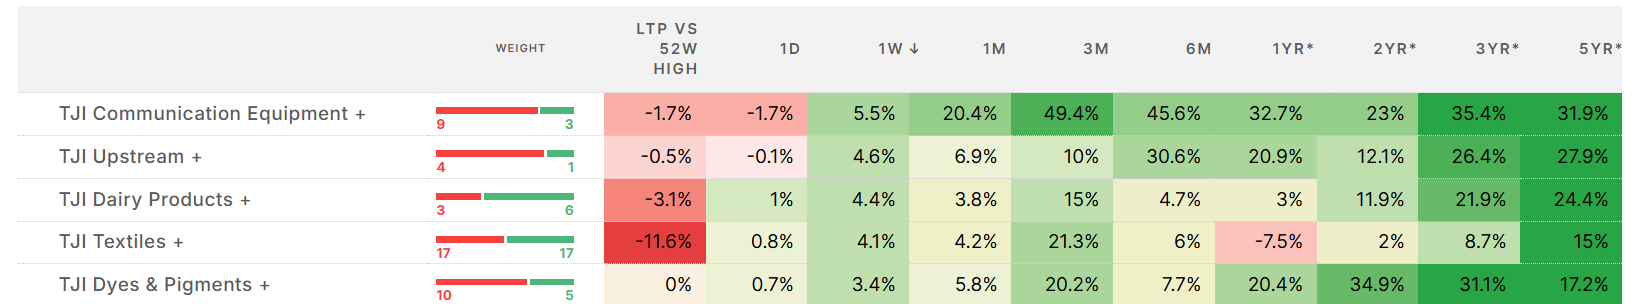
Like I said last week, something is indeed brewing in Communication Equipment. It was right at the top last week as well.
Commodities
Gold & Silver
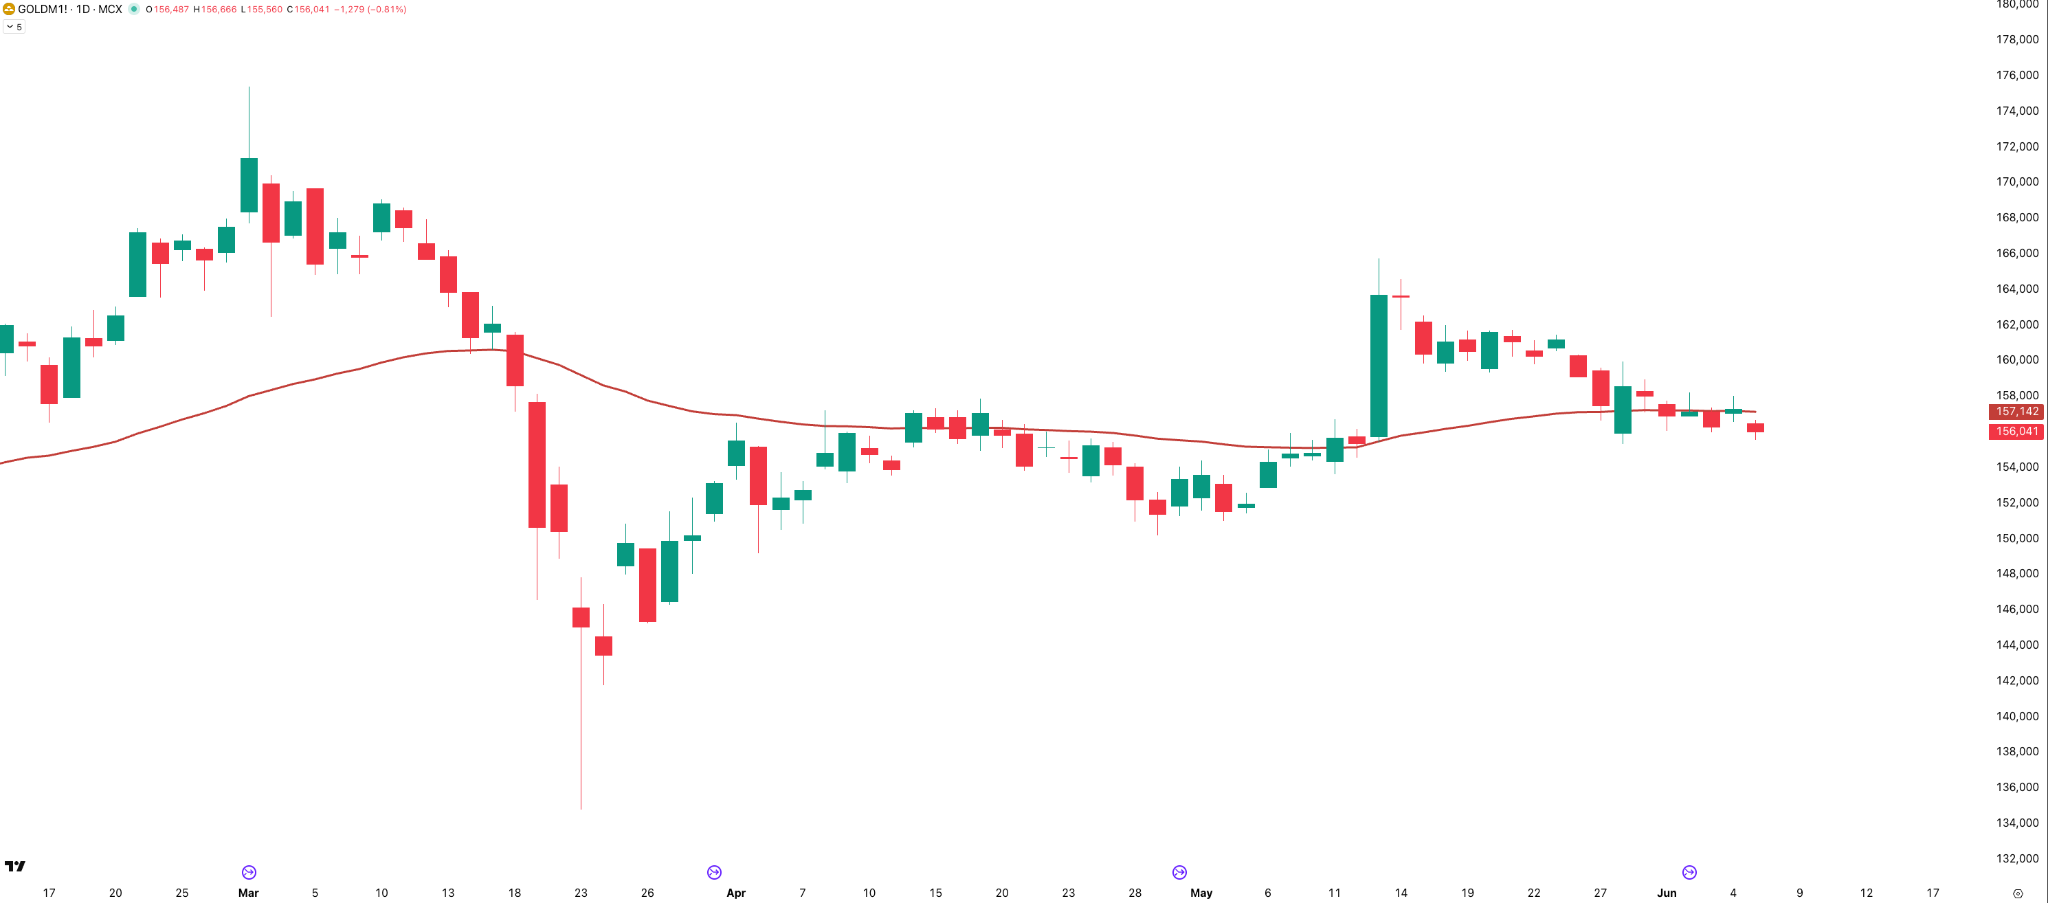
On the daily timeframe, GOLDM is going nowhere fast — drifting around the 50 EMA in a narrow weekly range of just 1.7%, currently trading around ₹1,56,100.
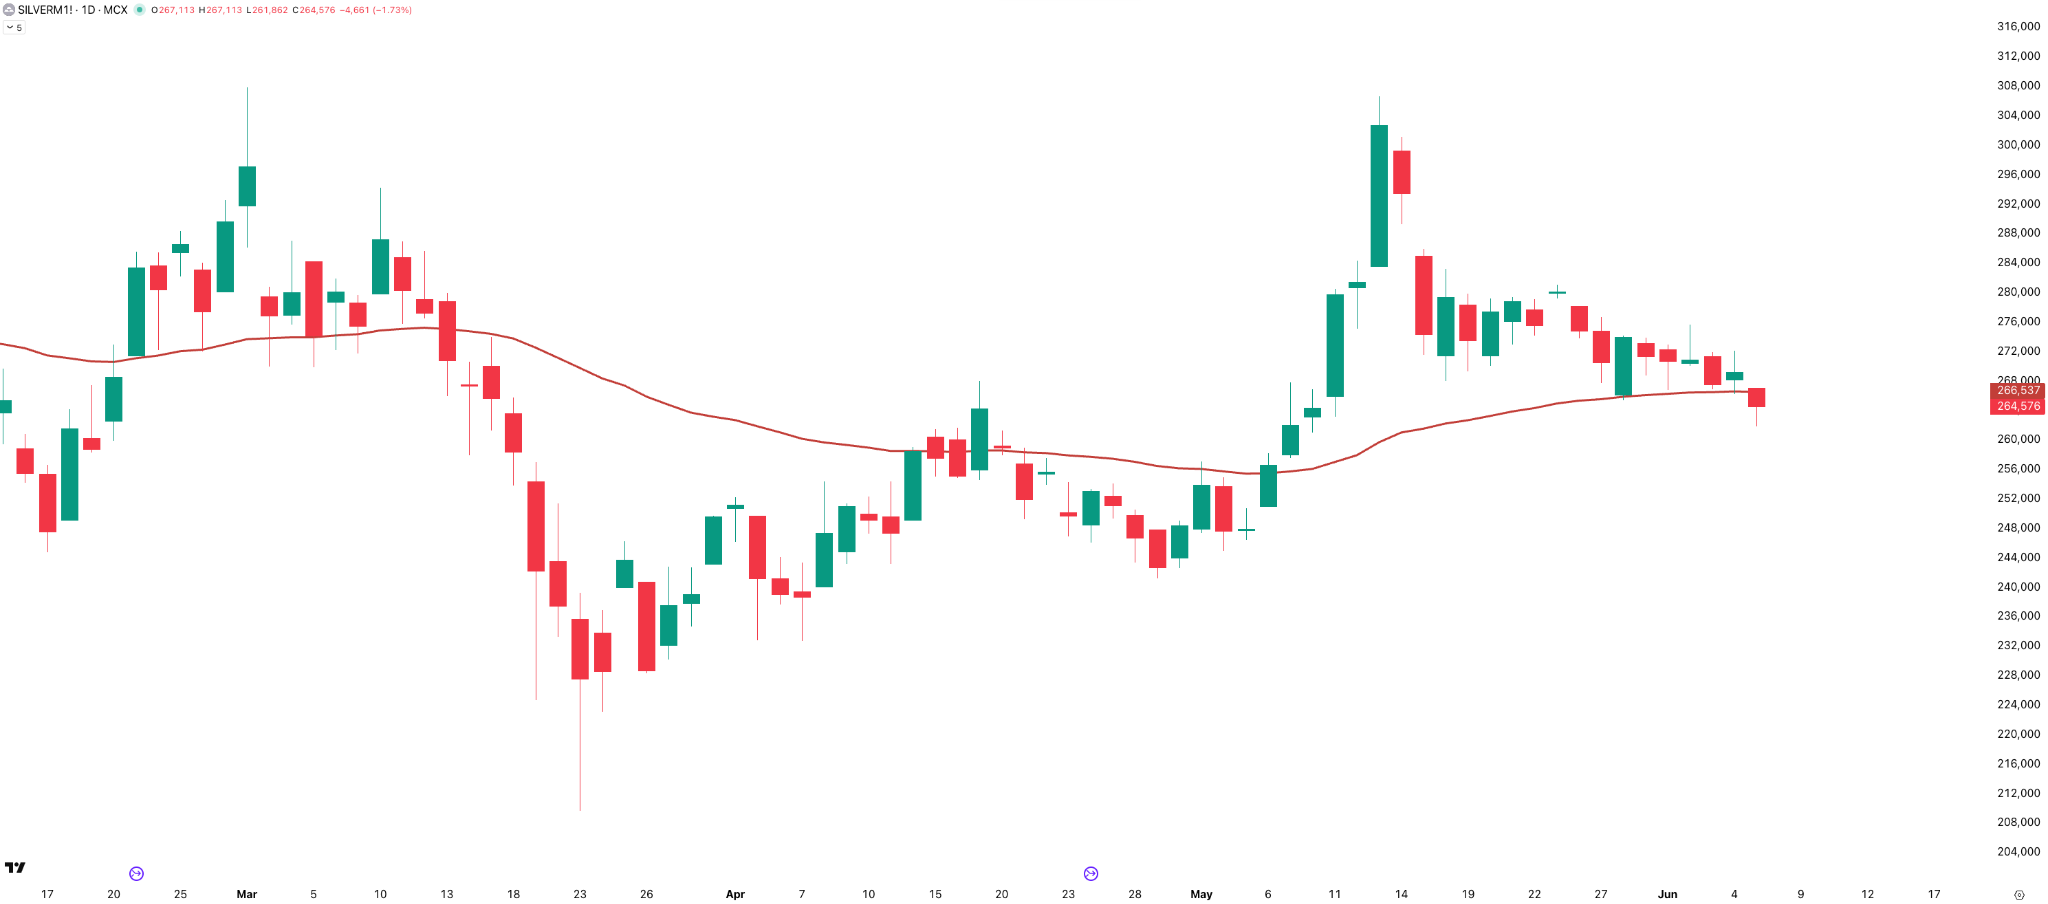
SILVERM had a bit more action this week, making a range of roughly 5%, but it too has closed the week just below the 50 EMA.
Both metals are in a wait-and-watch mode for now.
Weekly Commodity Performance
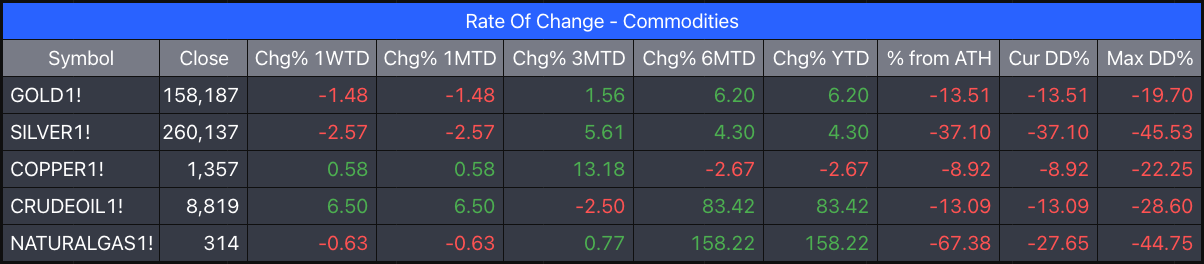
It was a mixed week across commodities.
- Gold: -1.48%
- Silver: -2.57%
- Crude Oil: +6.50%
- Natural Gas: -0.63%
- Copper: +0.58%
Crude was the surprise gainer of the week.
In Summary
Markets ended the first week of June on a cautious note, with NIFTY closing down 0.77% as the RBI held rates steady and geopolitical uncertainty continued to linger in the background.
The Iran peace deal remains a maybe, the rupee stayed under pressure, and a gold sale rumour briefly rattled sentiment — even if the RBI was quick to deny it.
The divergence across market caps continues to be the defining story of 2026 — MICROCAP and SMALLCAP indices are holding up and even gaining ground, while NIFTY 50 remains the clear laggard, down over 10% for the year.
On the sectoral front, MEDIA was the standout for the second week running, and PSU BANK continues to hold its ground — continuity worth watching.
Gold and Silver are both drifting around their 50 EMAs with no clear direction — a wait-and-watch situation for now.
The bottom line: my overall bias continues to remain bearish to sideways — no change there.
What Caught My Attention This Week
Recommendation #1: Persepolis
This week we lost Marjane Satrapi — the French-Iranian author, illustrator, and filmmaker.
Her work, however, remains as relevant as ever.
Persepolis, her autobiographical graphic novel (later adapted into an Oscar-nominated animated film), is a powerful account of growing up through the Islamic Revolution, the Iran-Iraq War, and life under the regime.
Book or film — both are excellent.
Recommendation #2: George Patterson on Top Traders Unplugged
The second recommendation is Episode 35 of the Allocator Series on Top Traders Unplugged.
Host Alan Dunne sits down with George Patterson, CIO of PGIM Quant Solutions, to explore how systematic investing has evolved — covering regime detection, machine learning, inflation risk, and the role of AI in investment research.
About an hour long, but worth every minute.
Events to Factor In Next Week
Looking ahead to next week, it is a five-day trading week with no market holidays.
There are no major known events.
That’s it for this week’s edition of Weekly Market Metrics.
Until then — stay curious, stay steady, and enjoy your weekend.