Hello and welcome to the Weekly Market Metrics! I’m your host, Sandeep Rao, and we’re in Week 28 of 2026. I’ll be honest — this week I learnt a lesson: never celebrate too early.
Last week I sat here and said that for the first time in close to three months, I didn’t have to start with news about the Iran war. Guess what — I clearly jinxed it. The airstrikes are back, the US has reimposed oil sanctions on Iran, and Trump has declared the ceasefire “over.” Technically the peace deal hasn’t been formally scrapped, but it’s showing no signs of life either. We’re back to square one.
And it’s not just geopolitics doing a U-turn. After nine days of surplus rain — where the country received over 40% above normal rainfall in the first week of July — El Niño seems ready to take its revenge, and IMD is now forecasting below-normal rainfall for the month. From almost floods in Mumbai to a possible dry spell, in one week. The tables have truly turned 180 degrees.
Markets didn’t enjoy any of this. Nifty crashed over 2% on Wednesday, almost touching 23,800, before staging a recovery — and as of Friday we’re back around the 24,200 levels. On a weekly basis, we’re almost flat to slightly negative, down about 0.25%.
Also, as a special this week, there’s some analysis on the relative strength trend across Nifty Large, Mid, and Small caps over the past decade. More on that later.
Section 1 — What Happened Last Week
Rate of Change (ROC) Across Indices

After several weeks of steady gains, Nifty 50 took a breather, slipping 0.2% over the week. The broader market, however, continued to show strength. Midcap 150 led the way with a 1.2% gain, while Microcap 250 and Smallcap 250 added 0.8% and 0.7% each. Next 50 also managed to end the week in positive territory.
Over the last three months, Microcap 250 continues to lead with an 18.9% return, while Smallcap 250 has gained 15%. Nifty 50, meanwhile, has slowed to just 0.7% over the same period, suggesting that market leadership continues to lie well beyond the headline index.

Nifty Mid Select was the clear standout this week, gaining 1.9%. It’s now up 7.6% for the year and has become the first major index in our coverage to reclaim its all-time high. Nifty Bank edged higher, adding 0.2%, and continues to trade less than 6% below its record high. Nifty 50 took a small breather after last week’s breakout and remains about 8% below its peak.
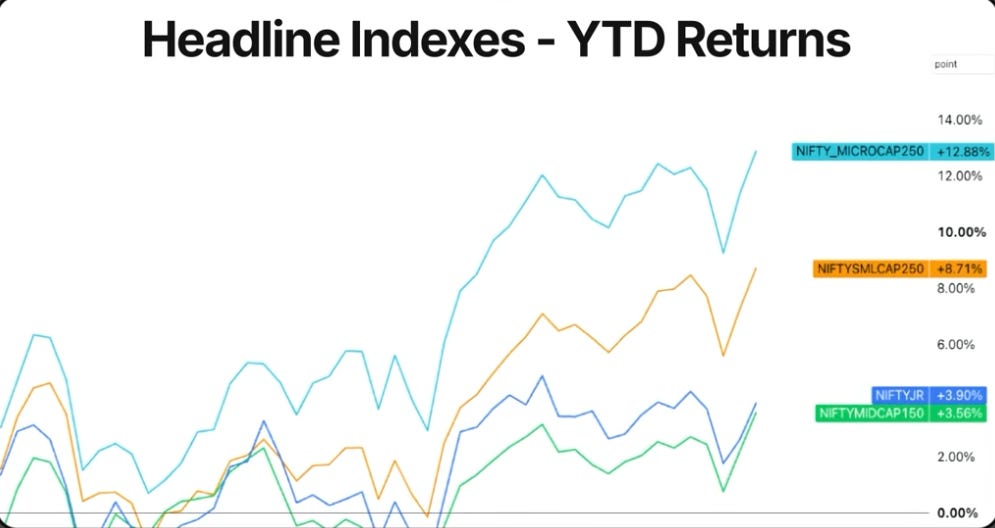
On YTD numbers, Microcap 250 has extended its lead to nearly 13%, followed by Smallcap 250 at 8.7%. Midcap 150 and Next 50 have moved firmly into positive territory at 3.6% and 3.9% respectively. Nifty 50 remains down about 7.4% for the year despite the recovery over the last three months. The gap has narrowed, but the story of 2026 remains the same.
NIFTY
Weekly
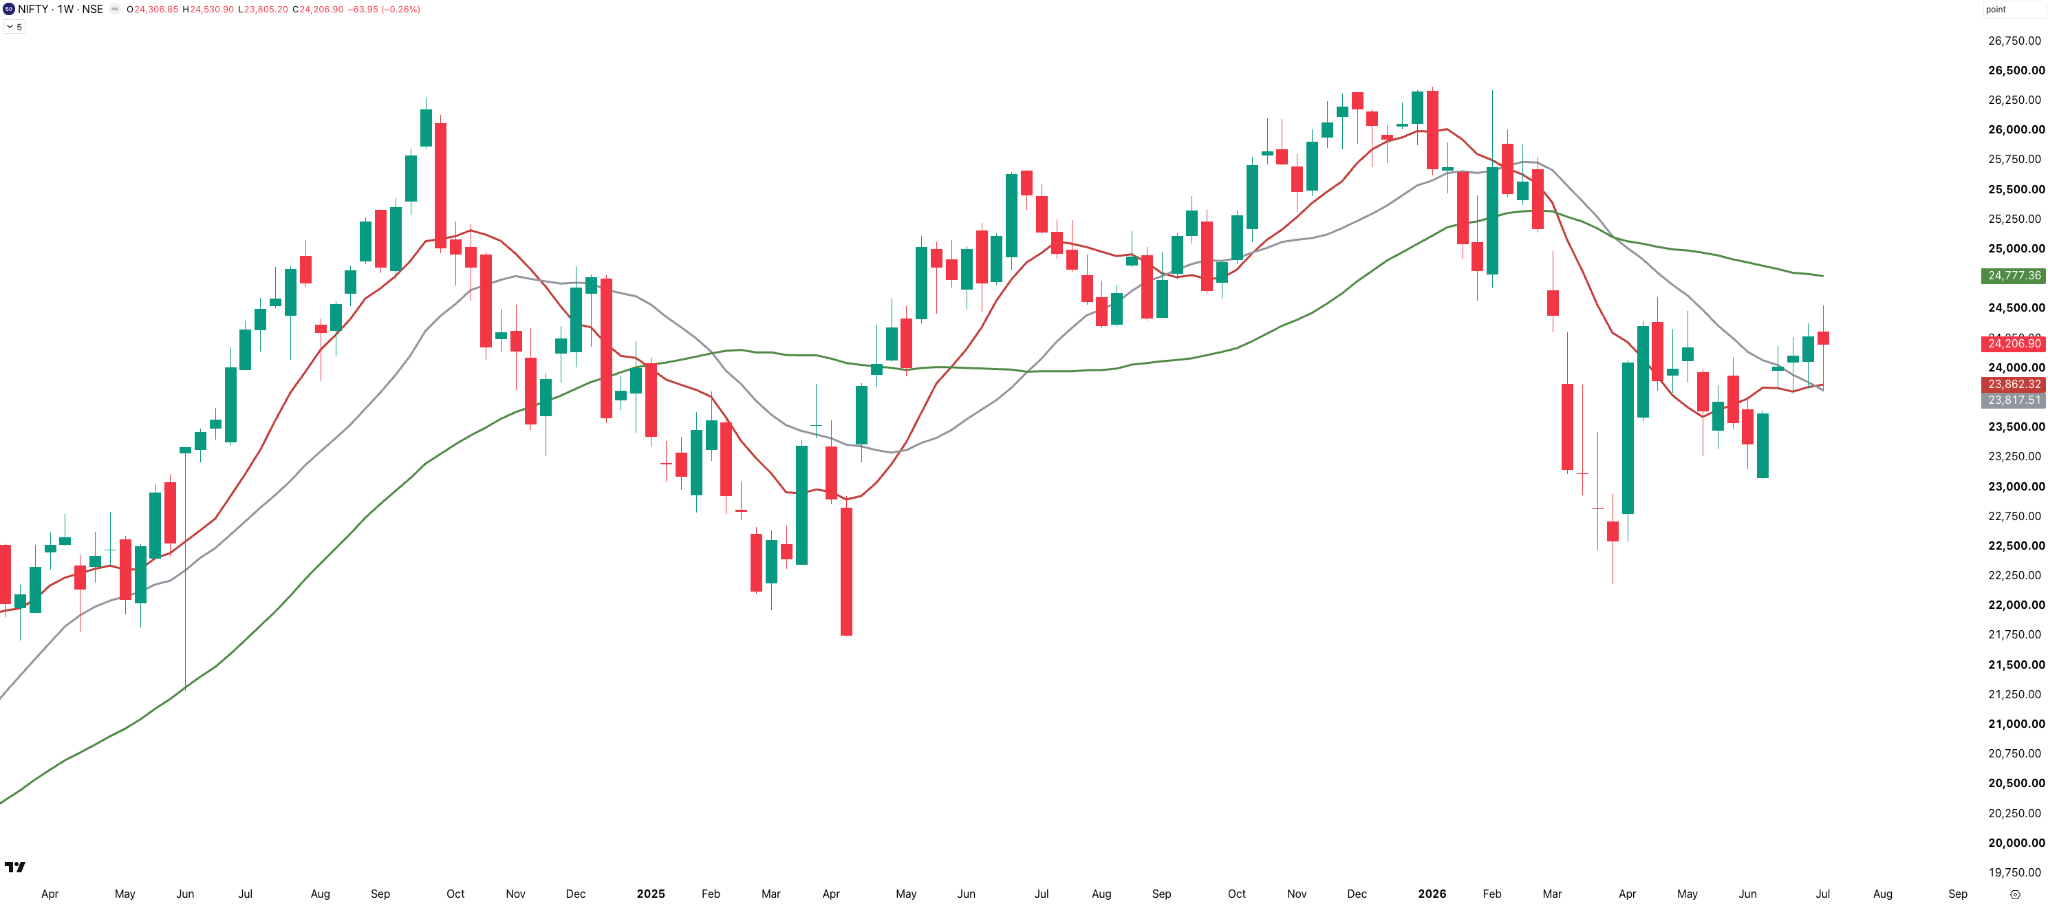
Nifty paused after three consecutive weeks of gains, slipping 64 points, or 0.3%, to close at 24,207. Despite the minor pullback, the medium-term structure remains constructive — Nifty continues to trade above both the 10-week and 20-week SMAs, although it once again failed to reclaim the 40-week SMA, which continues to act as overhead resistance around 24,780.
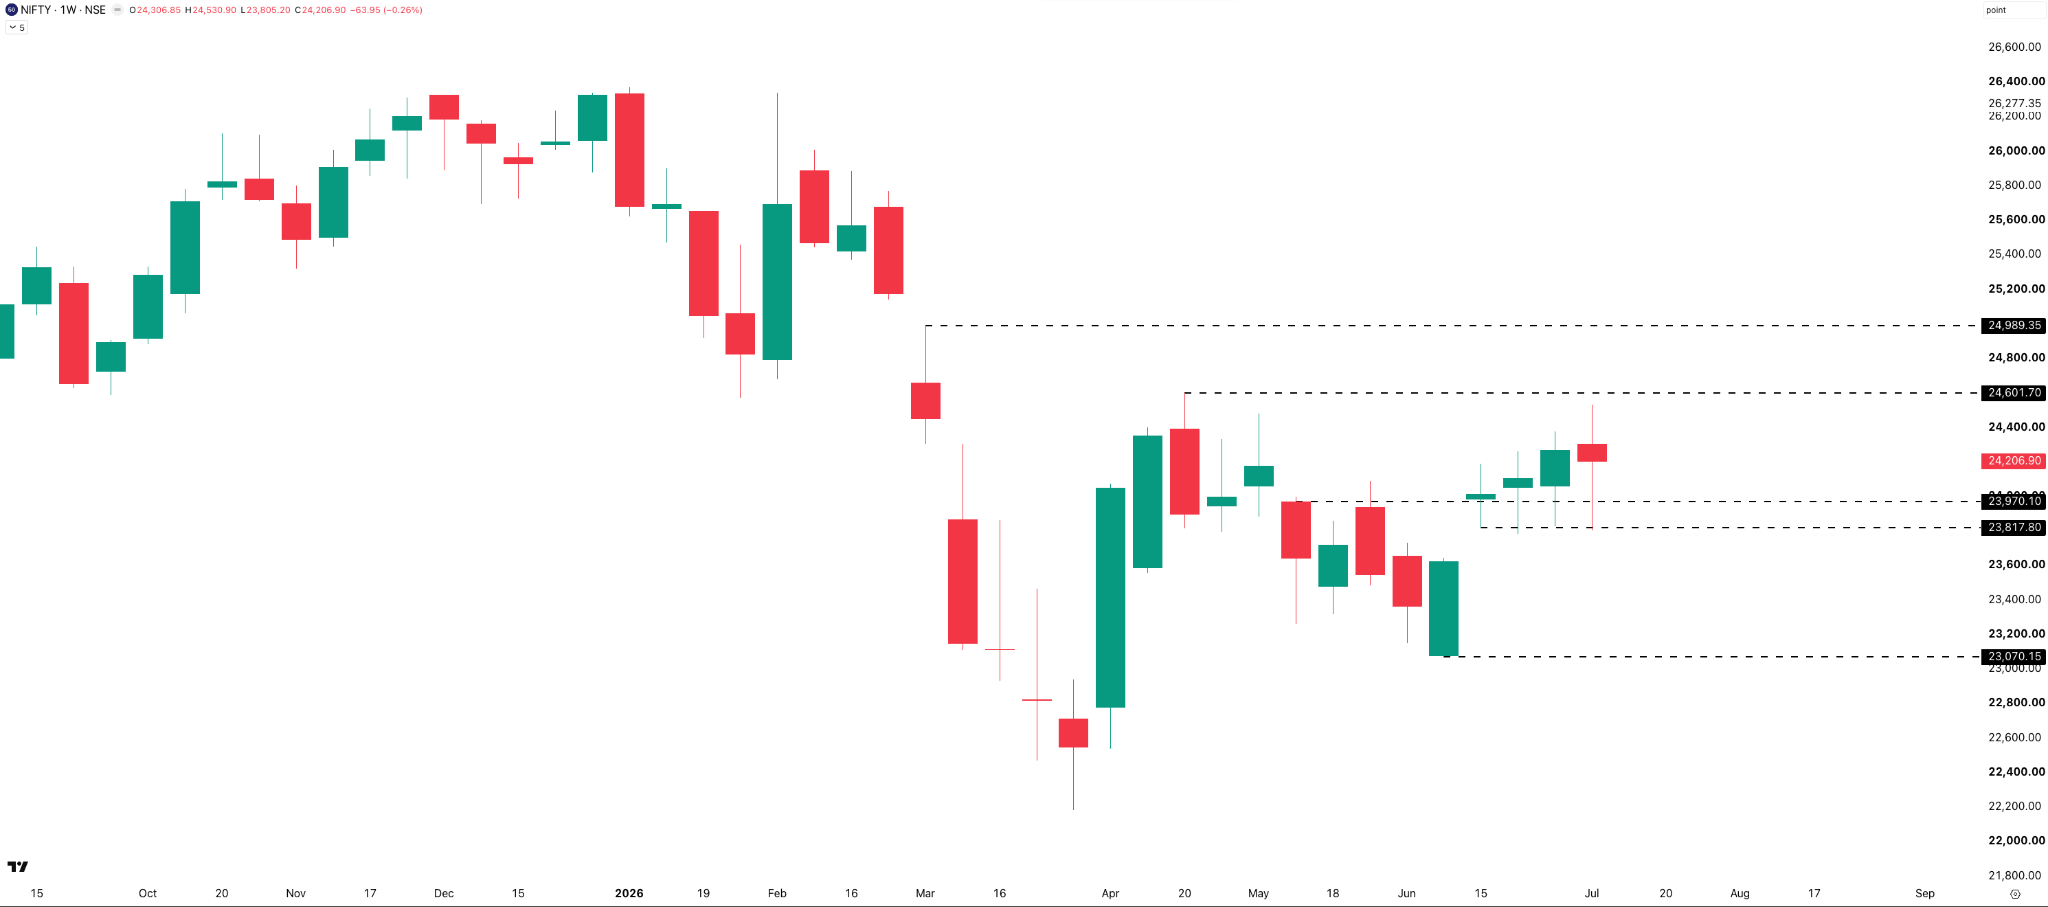
One level that continues to stand out is the 23,800 support zone. Over the last four weeks, Nifty has tested this zone multiple times, including this week, but has failed to register a single weekly close below it.
The weekly trading range continues to expand. After widening from 477 to 549 points last week, it widened further to 725 points this week. Larger ranges suggest volatility is picking up, even though the market is still consolidating rather than trending decisively.
W28

W27

Wednesday stood out with an exceptional 495-point range, accounting for nearly 70% of the week’s total range. The remaining four sessions were relatively subdued — Monday, Tuesday, and Thursday all saw ranges between 170 and 210 points. Friday was the lowest at 108 points. The 5-day average daily range jumped to 233 points, well above the 10-day average of 198 points.
Daily
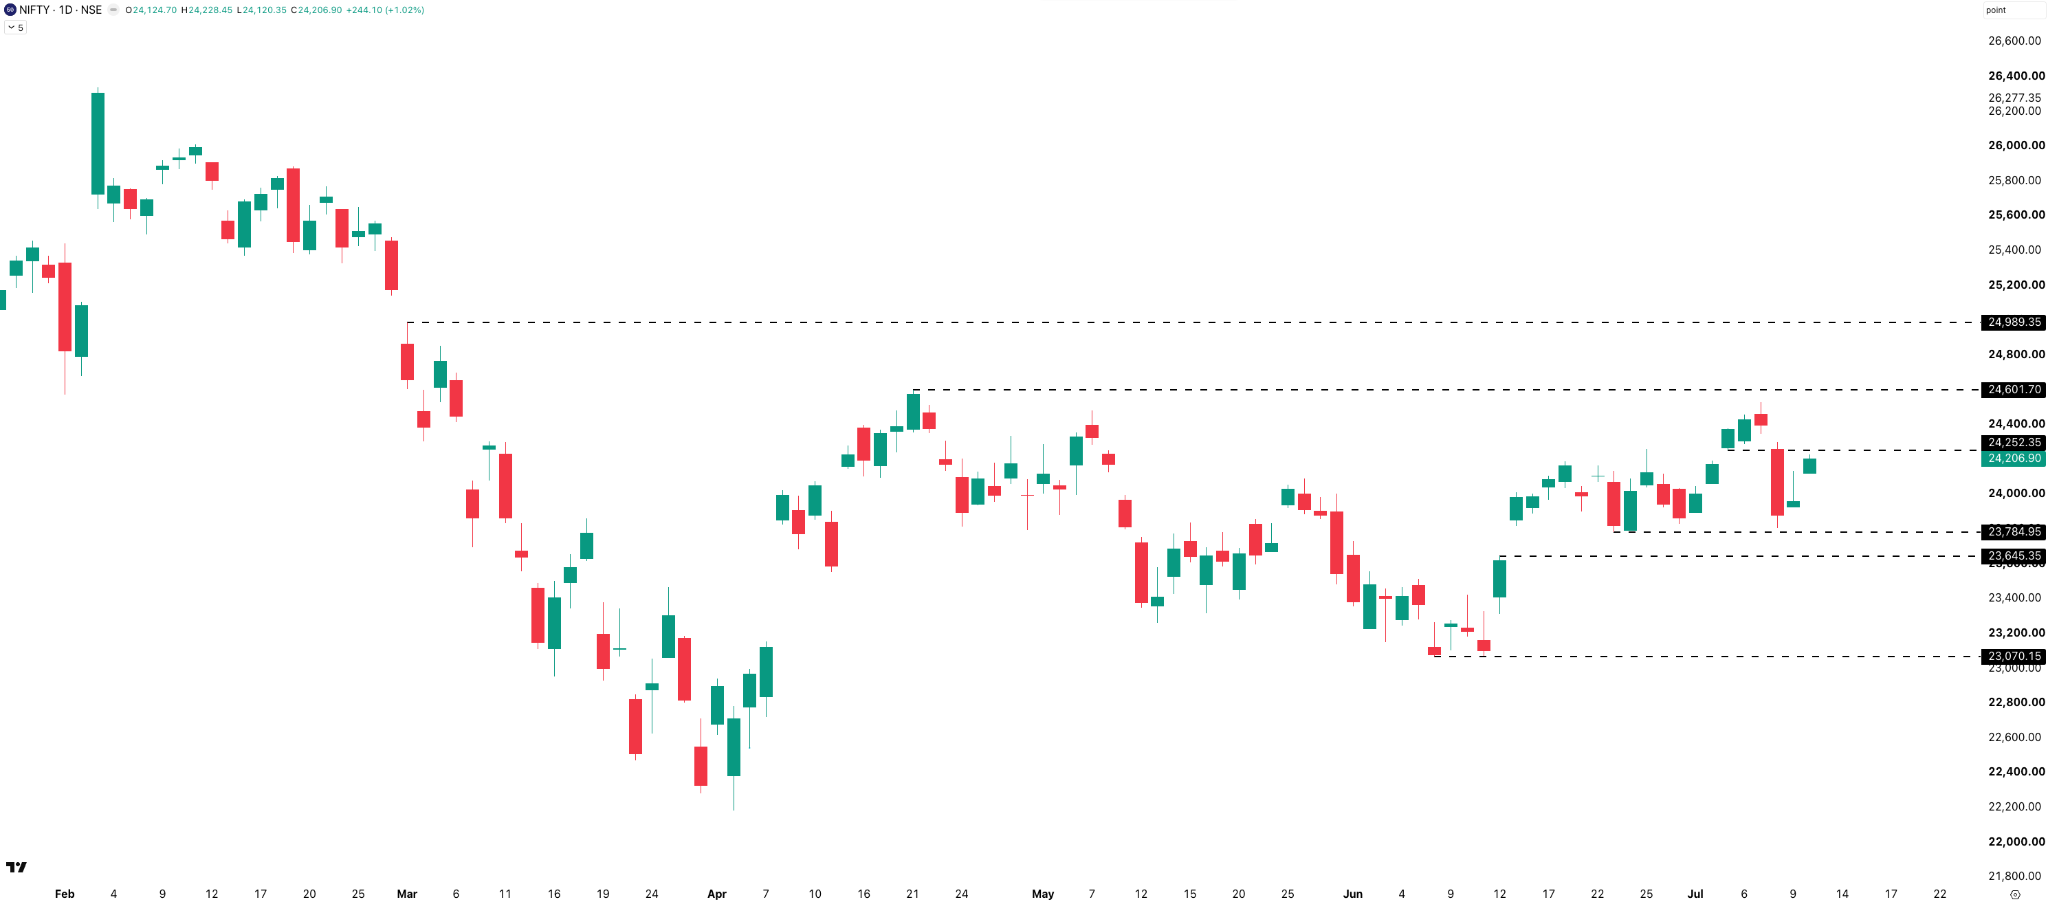
Monday and Tuesday continued the upward momentum from last week, with Nifty pushing towards the 24,600 resistance zone. Wednesday changed everything — in a single session, the index sliced through 24,000 and tested 23,800. That weakness, however, proved short-lived. Thursday and Friday saw a strong recovery, with Nifty ending the week back above 24,200.
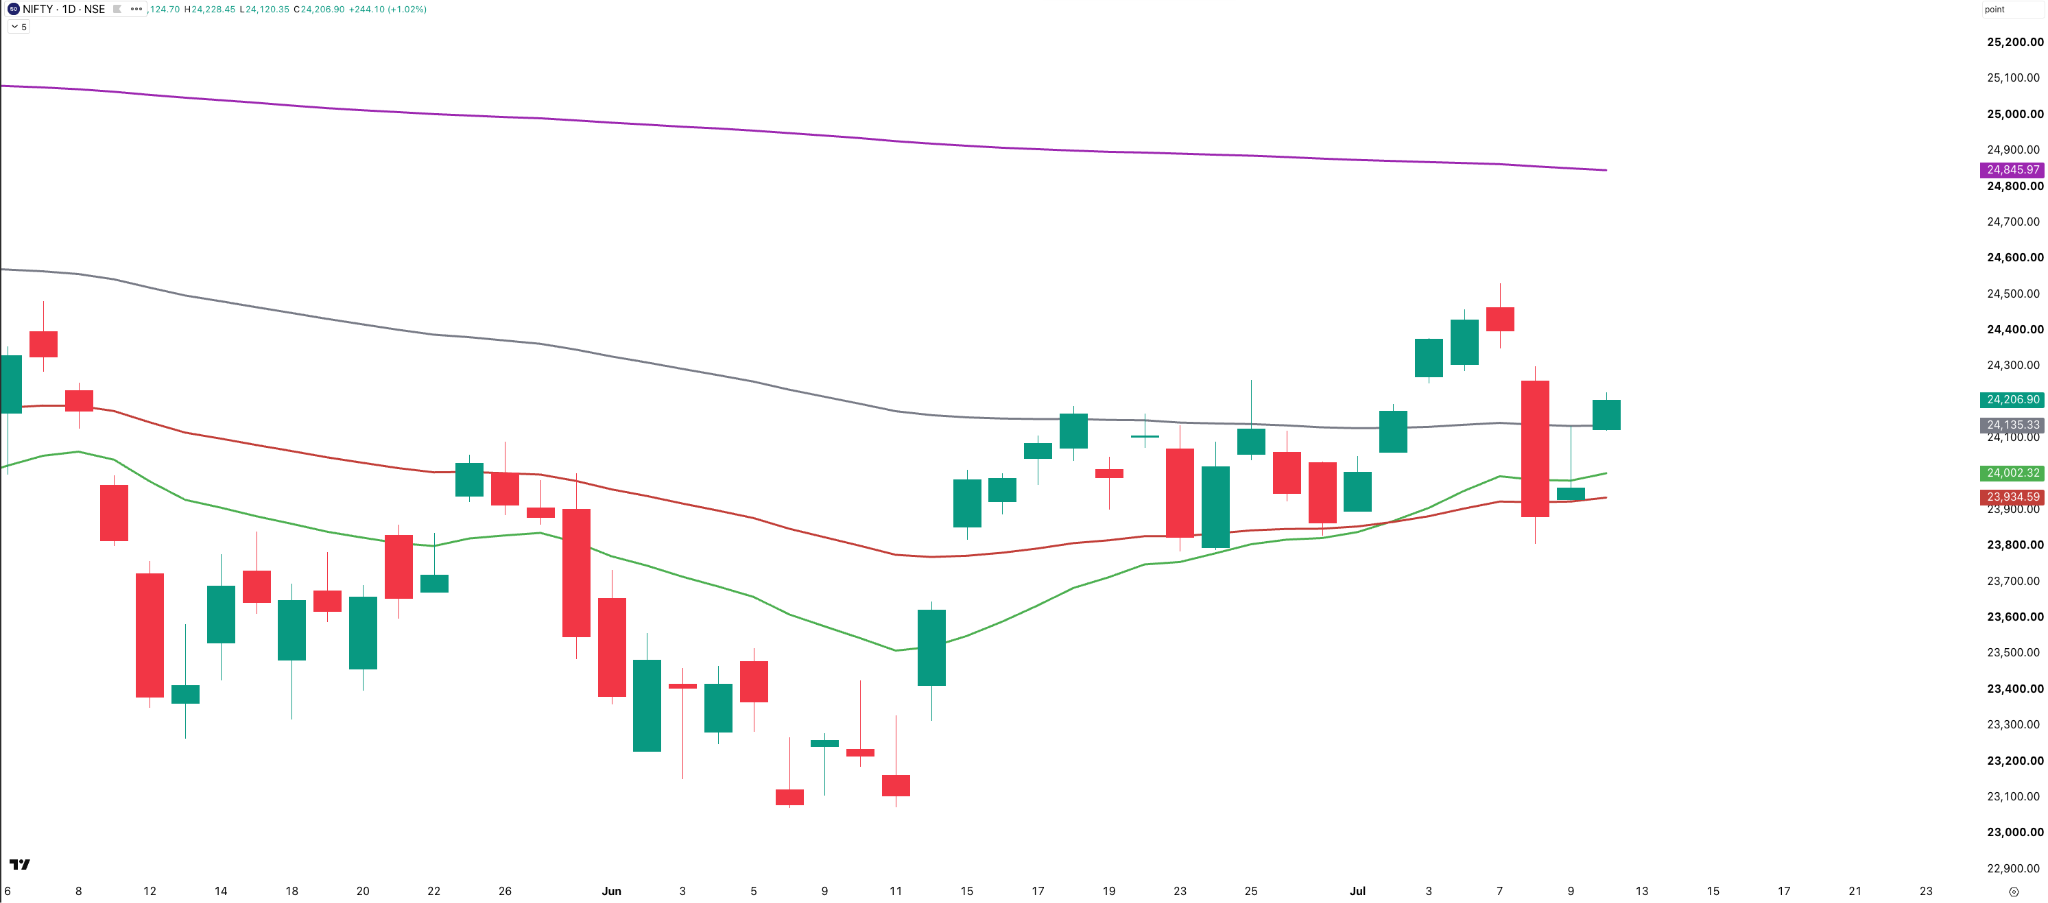
Wednesday’s sell-off briefly disrupted the technical structure, with Nifty closing below the 100-day EMA, the 50-day EMA, and even the 21-day EMA — all in a single session. The recovery on Thursday and Friday pushed the index back above all three moving averages by the end of the week. The next major hurdle is the 200-day SMA, currently placed around 24,850. A decisive close above that level would be an important technical milestone and could pave the way towards the psychological 25,000 mark.
Hourly
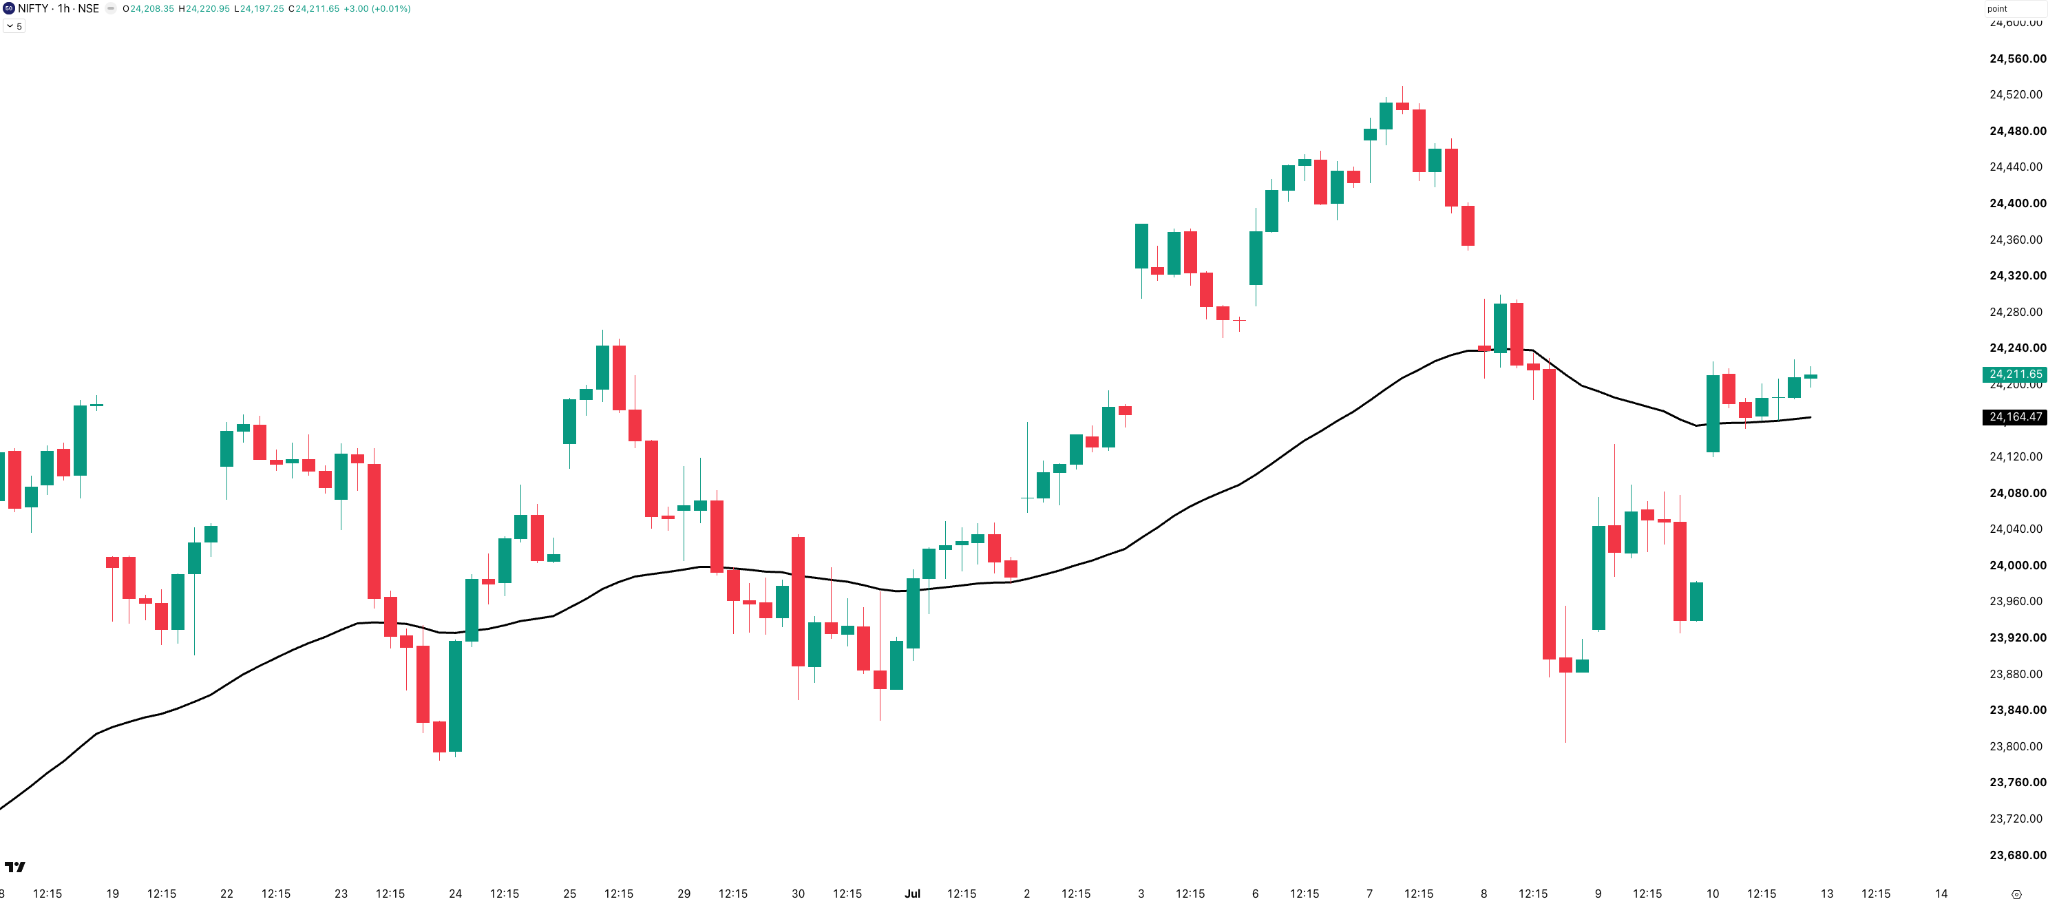
Nifty spent most of Monday and Tuesday trading comfortably above the 50 EMA. Wednesday’s sharp sell-off completely changed the picture, pushing the index well below the 50 EMA and likely triggering short positions across many trend-following systems. But as we’ve seen several times over the past few months, those shorts don’t last long. The recovery over Thursday and Friday pushed Nifty back above the 50 EMA, ending the week once again on the long side of the short-term trend.
Nifty Weekly Expiry — Tuesday, 7 July
The ATM straddle opened at around 99 points, and until 3 PM, Nifty traded within a fairly manageable 112-point range. But the last 30 minutes completely changed the picture — a sharp 110-point move after 3 PM expanded the day’s total range to 182 points. We’ve been seeing these 3 PM moves quite frequently on expiry days, which makes me wonder if there’s an edge in being long gamma after 3 PM. Let me know in the comments if you’ve been able to identify, trade, and consistently profit from this pattern.
Section 2 — What to Expect in the Coming Week
NIFTY
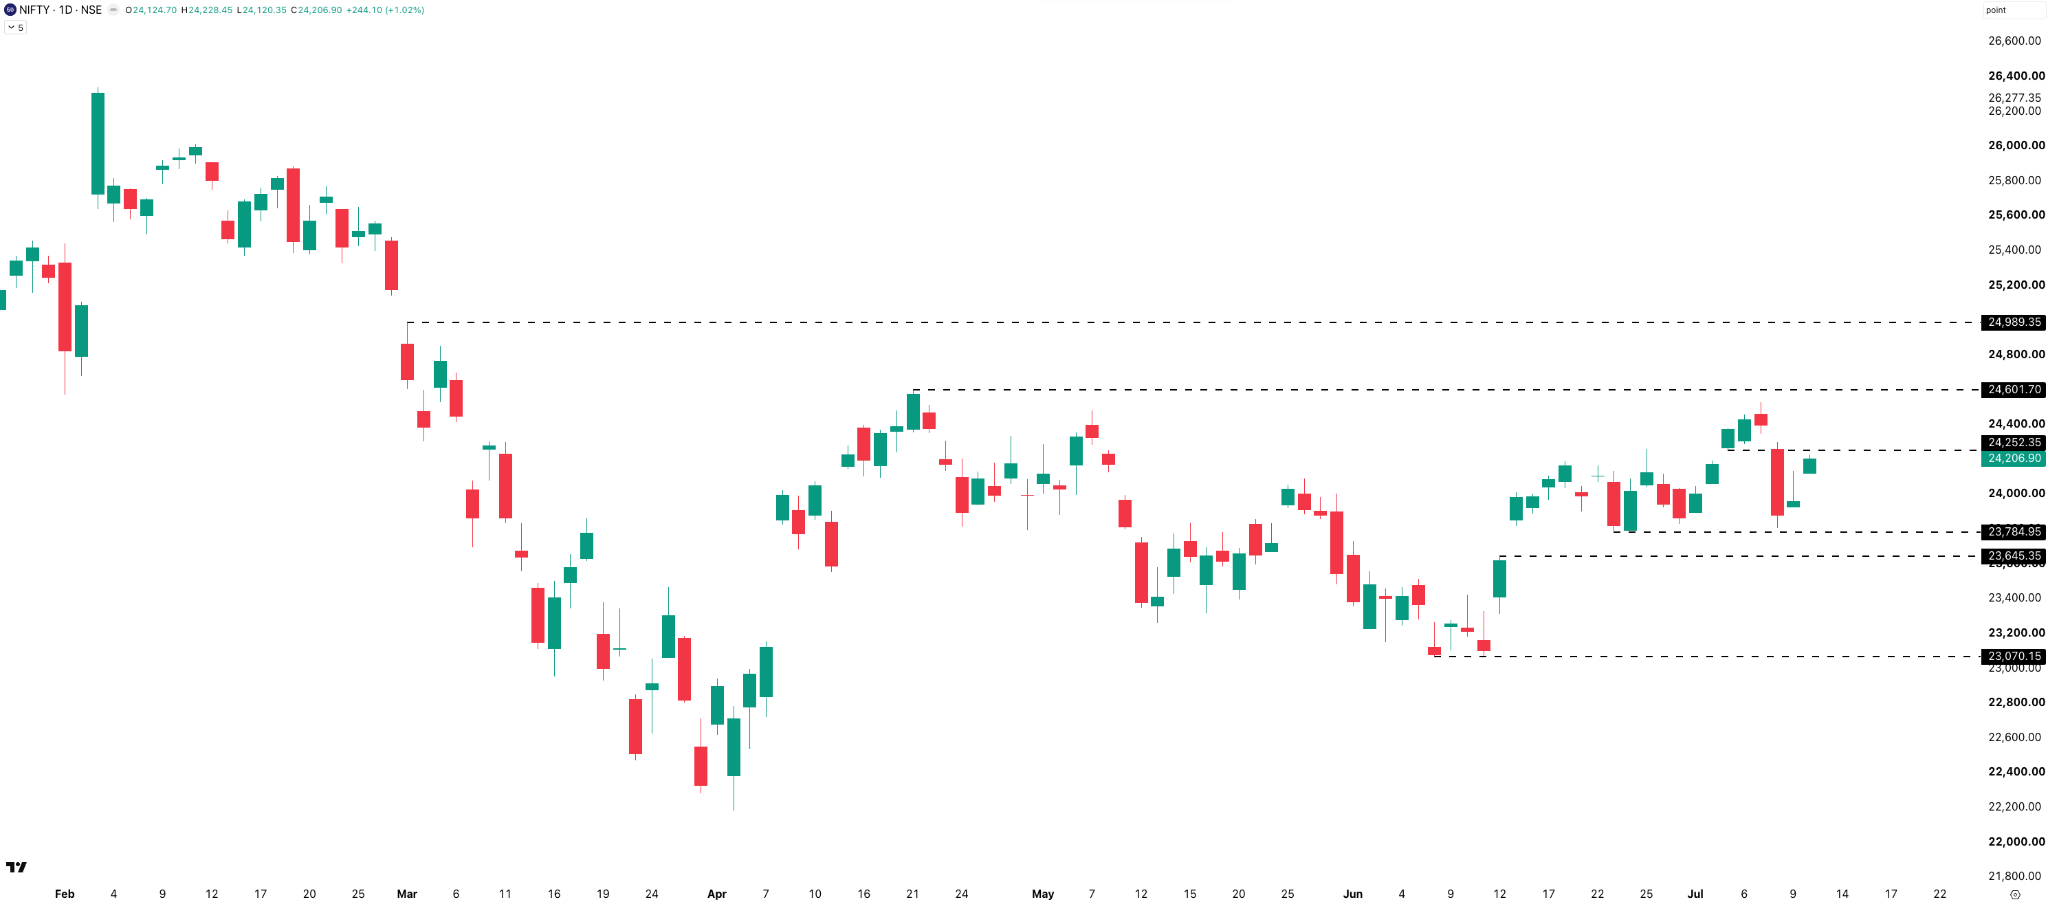
The first level to watch is the 24,200–24,250 zone. As long as Nifty holds above it, the short-term structure remains positive. On the downside, the 23,800–23,650 zone continues to be an important support area, having held up through multiple tests over the past few weeks.
On the upside, the next major hurdle remains the 200-day SMA around 24,850. A decisive close above that level would be an important technical milestone and could open the door towards the psychological 25,000 mark.
The overall bias remains cautiously bullish . The market has once again defended key support and recovered quickly from a sharp sell-off. The question is whether the bulls can carry this momentum into next week and finally challenge the long-term resistance around the 200-day moving average.
The Nifty ATM straddle closed at 192 points, up from 173 points last week, implying an expected move of roughly 0.79% on either side. That gives an expected range of approximately 24,399 on the upside and 24,015 on the downside for the upcoming weekly expiry on Tuesday, 14 July .
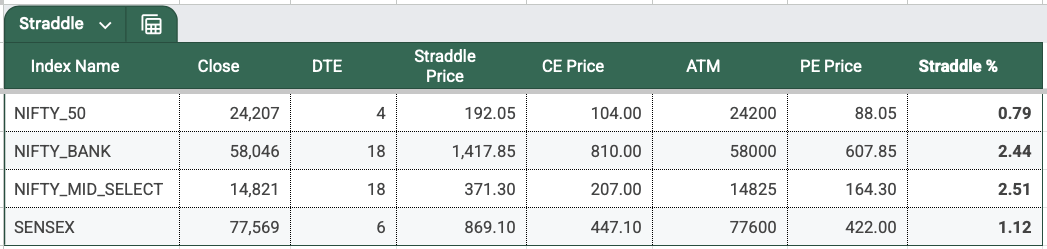
Implied volatility has ticked up slightly, suggesting the options market is pricing in a wider move. Whether the actual move stays within this range — or once again surprises with a sharp post-3 PM swing — will be worth watching.
India VIX
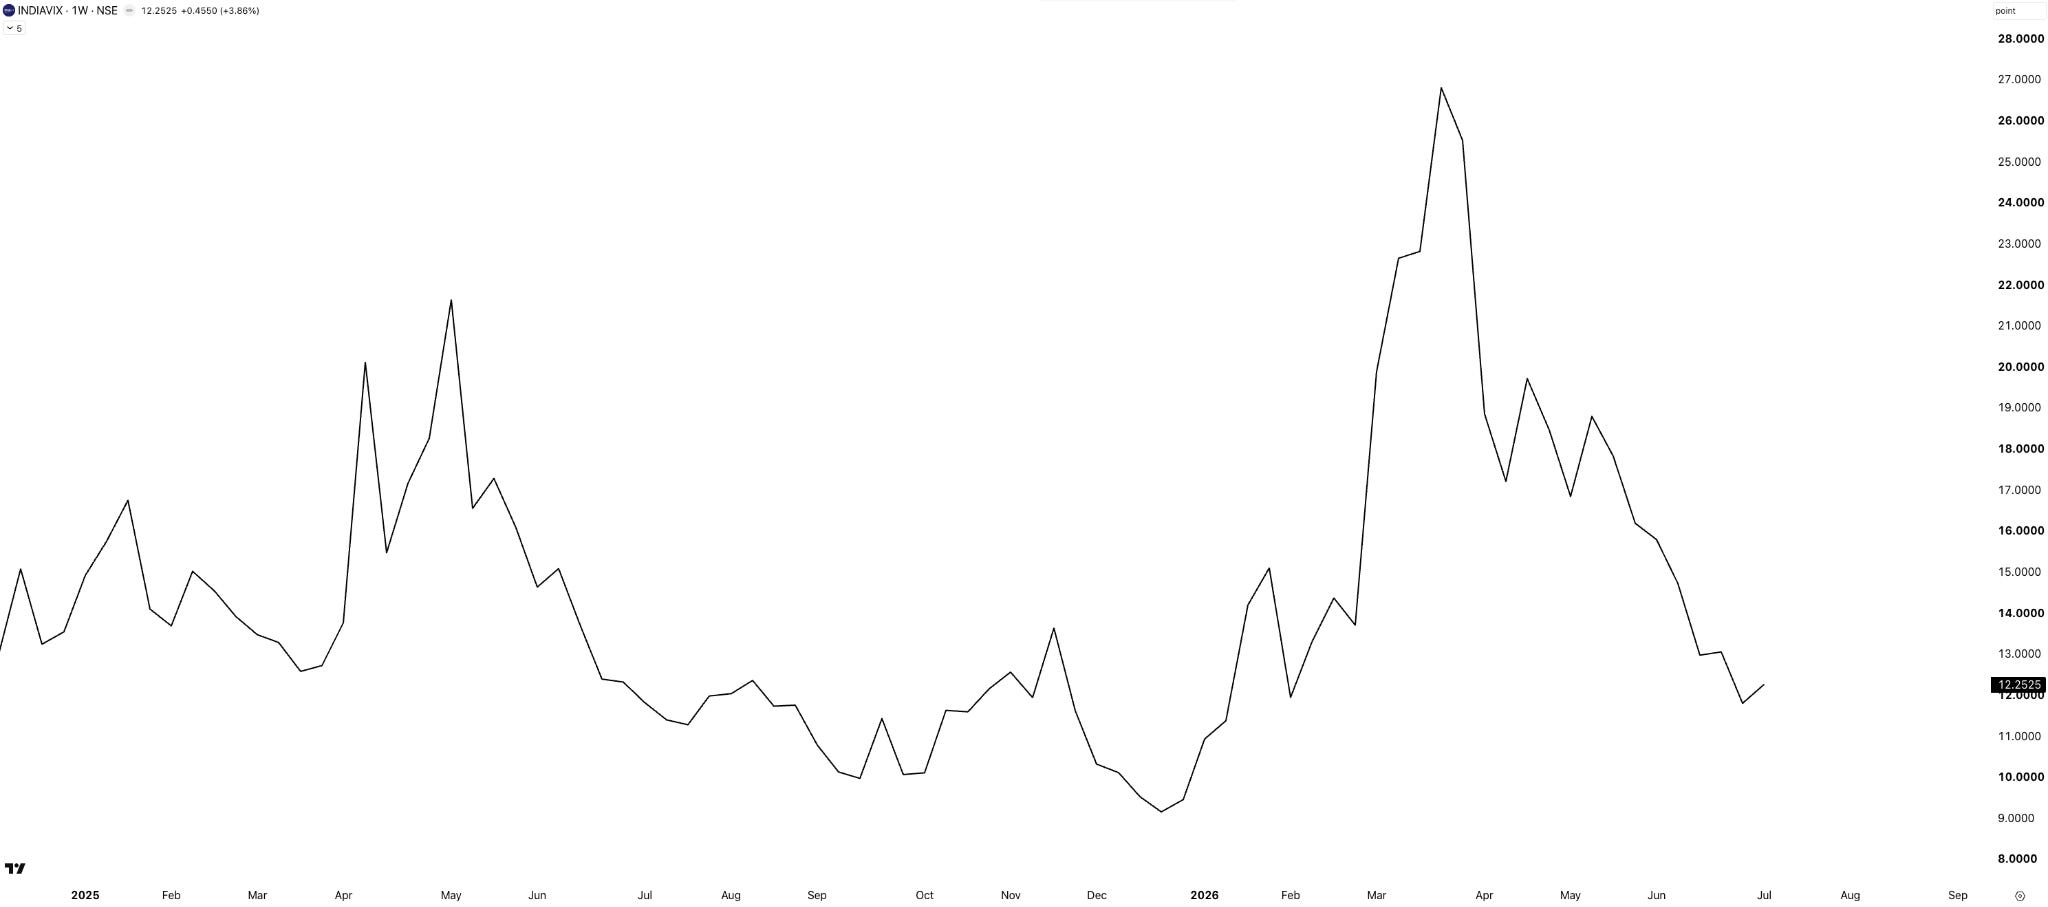
India VIX edged up slightly this week, rising from 11.8 to 12.3 after touching its lowest levels in several months. While volatility expectations have picked up a bit, VIX remains relatively low. As we’ve seen recently, though, a low VIX doesn’t rule out sharp intraday swings — especially on expiry days.
Sectoral Performance
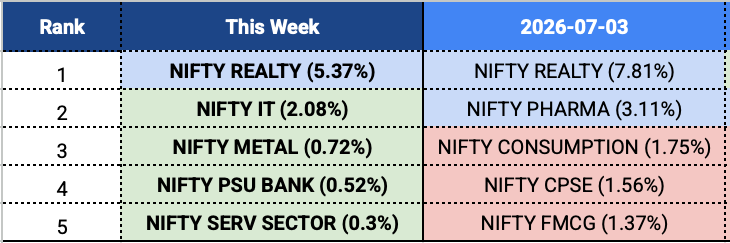
Nifty sector view: Leadership shifted again this week, with gains more muted than last week. Nifty Realty retained the top spot with a 5.4% gain, followed by IT and Metal. PSU Bank and Services rounded out the top five. The market rotated away from defensive sectors like Pharma, FMCG, and Consumption, with cyclicals such as IT and Metal making a comeback. Realty continued to dominate for the fourth week in a row.
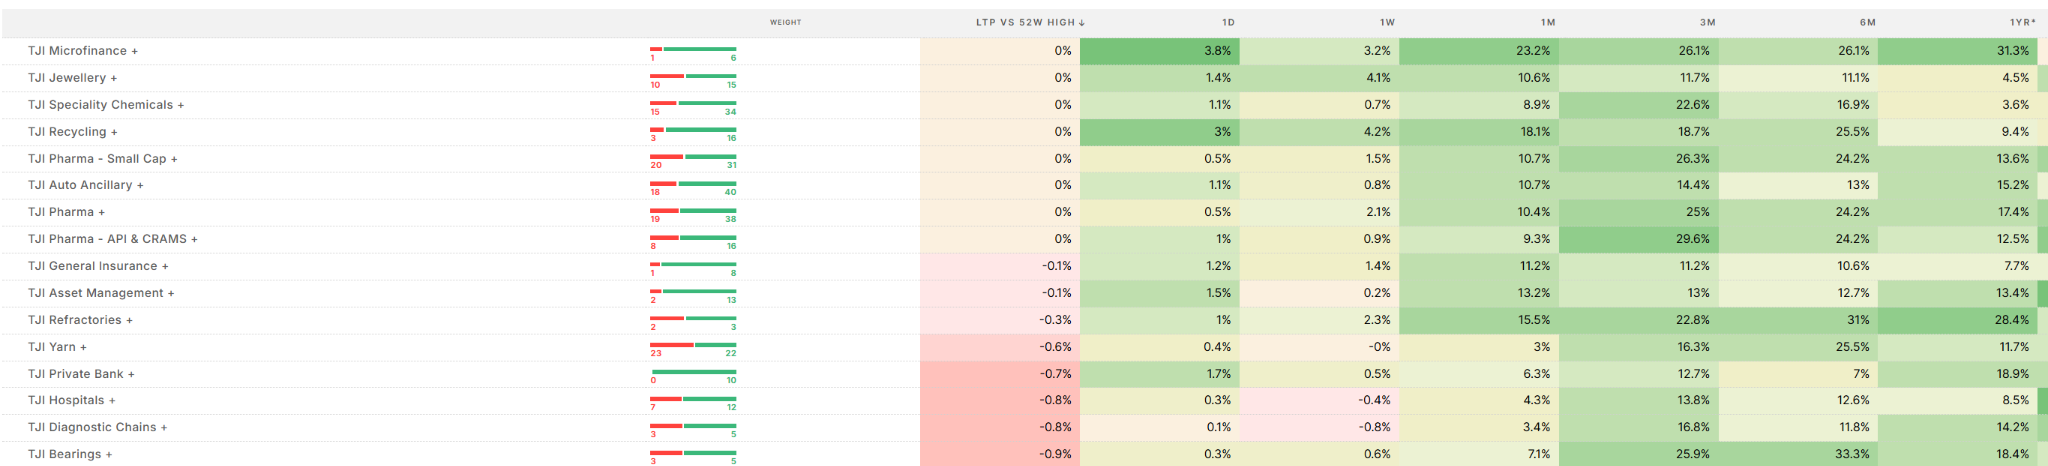
Tijori index view: IT Large Cap and Recycling both gained 4.2%, with Jewellery close behind at 4.1%. A word of caution on IT — the basket is still down nearly 27% over the year, so this looks more like a bounce than a turnaround.
The one that really stands out is Microfinance — up 3.2% this week, but the more interesting picture is the consistency: 23% over a month, 26% over three and six months, 31% over the year, and trading right at its 52-week high. There are genuine industry tailwinds as the sector comes out of its latest credit cycle. There’s a fascinating conversation on Zerodha’s Subtext podcast where Kashish speaks with Tamal Bandyopadhyay of Business Standard — one of the sharpest observers of Indian banking — on the microfinance credit cycle. A must-listen. Watch on YouTube
52-week high view: Eight Tijori indexes are at their 52-week highs this week — Microfinance, Jewellery, Speciality Chemicals, Recycling, Auto Ancillary, and all three pharma baskets. Pharma, Pharma Small Cap, and API & CRAMS are each at their highs, each up around 24 to 25% over six months. That’s not one stock or one story — that’s the entire pharma complex moving together.
W28 - 52WH
W28

For consistency across timeframes, two sectors stand out. Refractories is up 15% over a month, 23% over three, 31% over six, and 28% over the year — steady compounding, quarter after quarter. Recycling shows a similar staircase.
In a conversation this week with Nooresh Merani, a veteran market analyst, he too highlighted parts of banking and auto ancillary as worth watching. And sure enough — Auto Ancillary is sitting at its 52-week high and Private Bank is less than 1% away from its own 52-week high.
Commodities
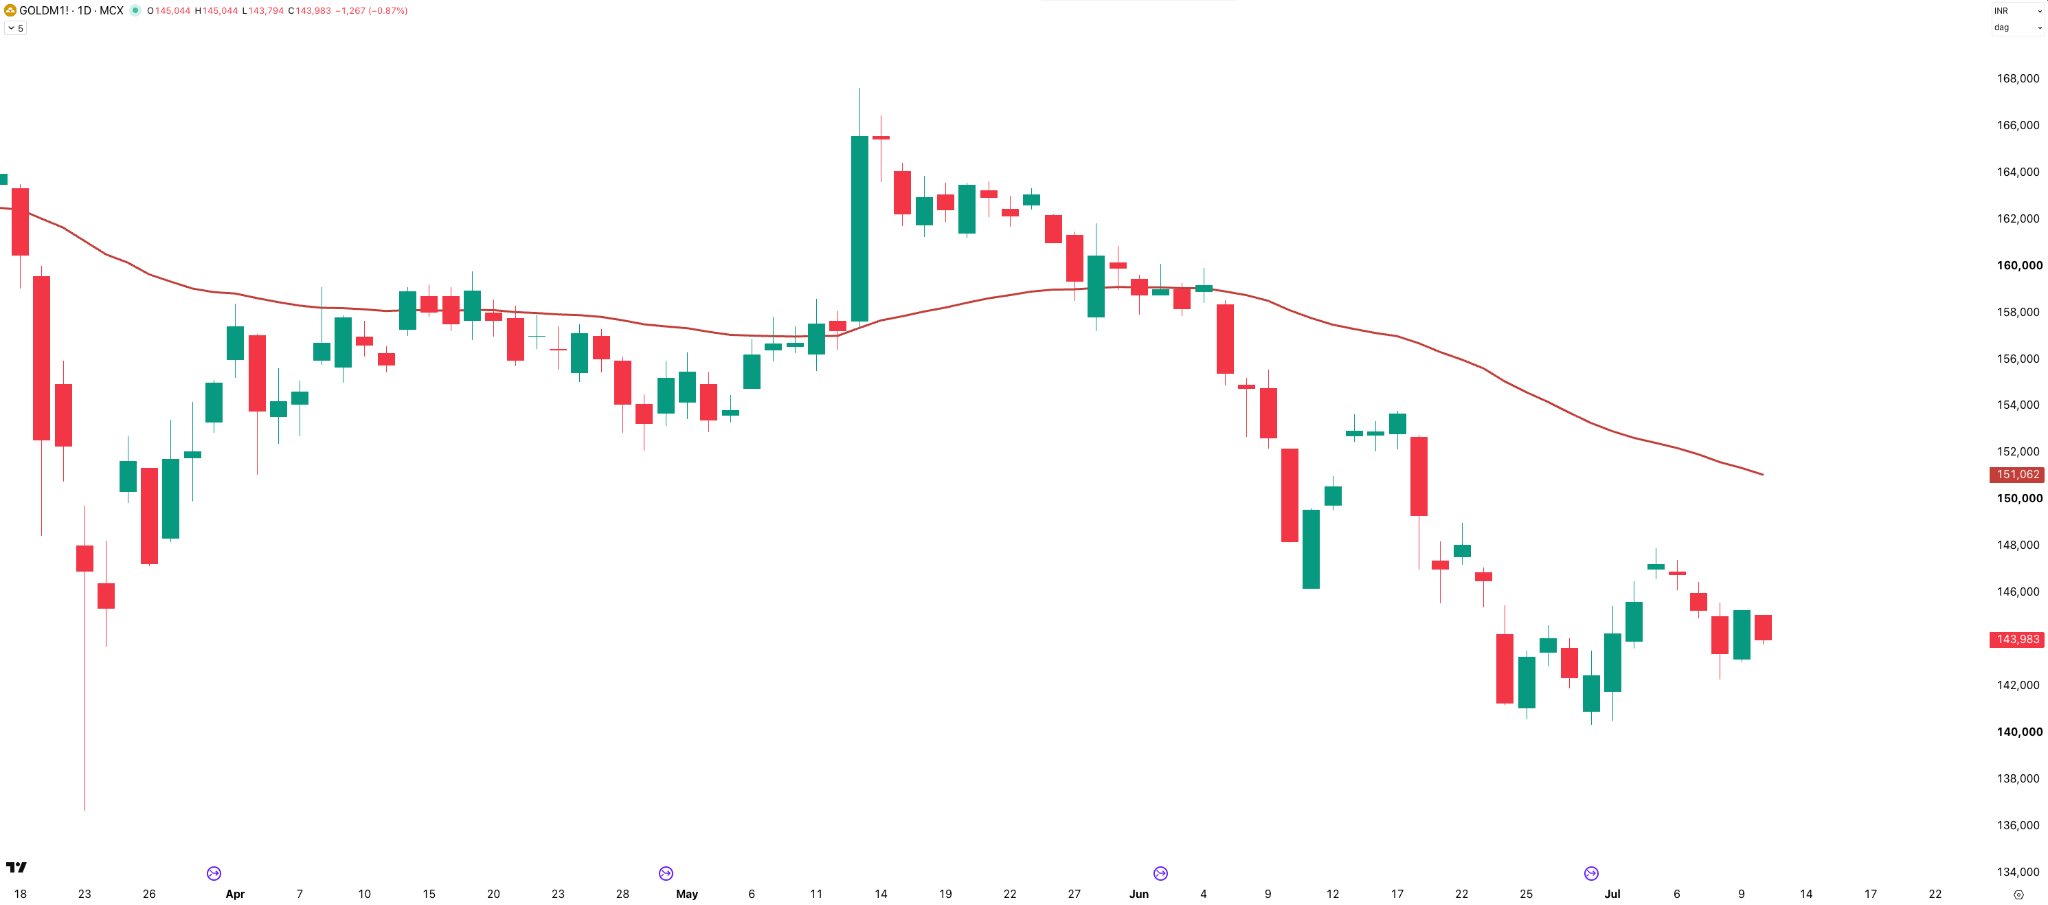
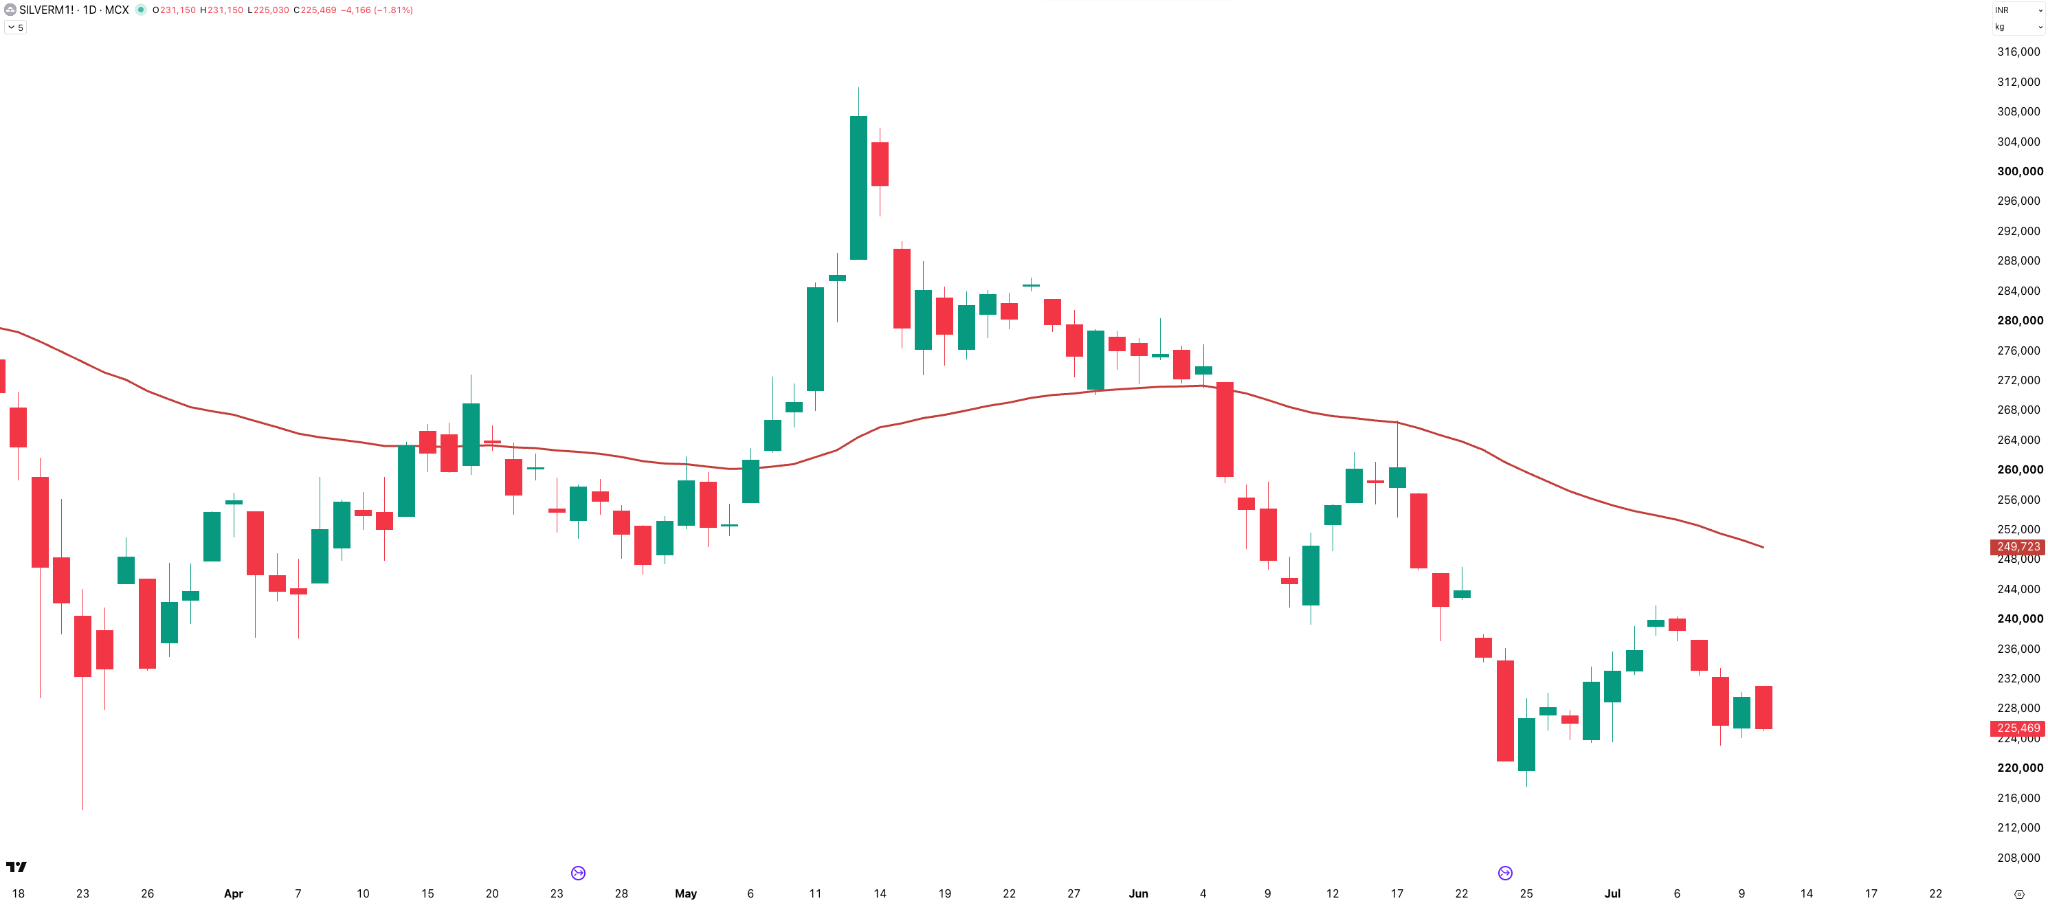
After last week’s relief rally, both Gold and Silver came under pressure again. Gold futures slipped back towards ₹1,44,000, while Silver fell below ₹2,26,000. Both continue to trade well below their 50 EMAs, keeping the broader trend firmly bearish. Until they reclaim those moving averages, any bounce is likely to be treated as a relief rally rather than the start of a sustained uptrend.
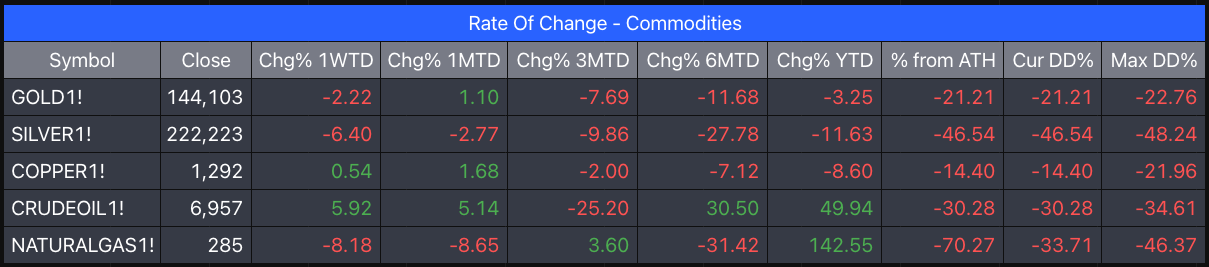
On a weekly basis, commodities were mixed. Crude Oil was the standout performer, rallying nearly 6% — you know why. Copper posted a modest gain of 0.5%. Gold fell 2.2%, while Silver dropped a sharper 6.4%. Natural Gas was the weakest performer, declining over 8%, although it still remains the best-performing commodity of 2026, up more than 140% year-to-date.
Special Study — Large, Mid, and Small Cap Relative Strength Over the Past Decade
Since the past several weeks, I’ve been saying that mid and small caps are doing better than large caps — but this isn’t a new phenomenon. Here’s how that performance divergence has played out over the past 10 years.
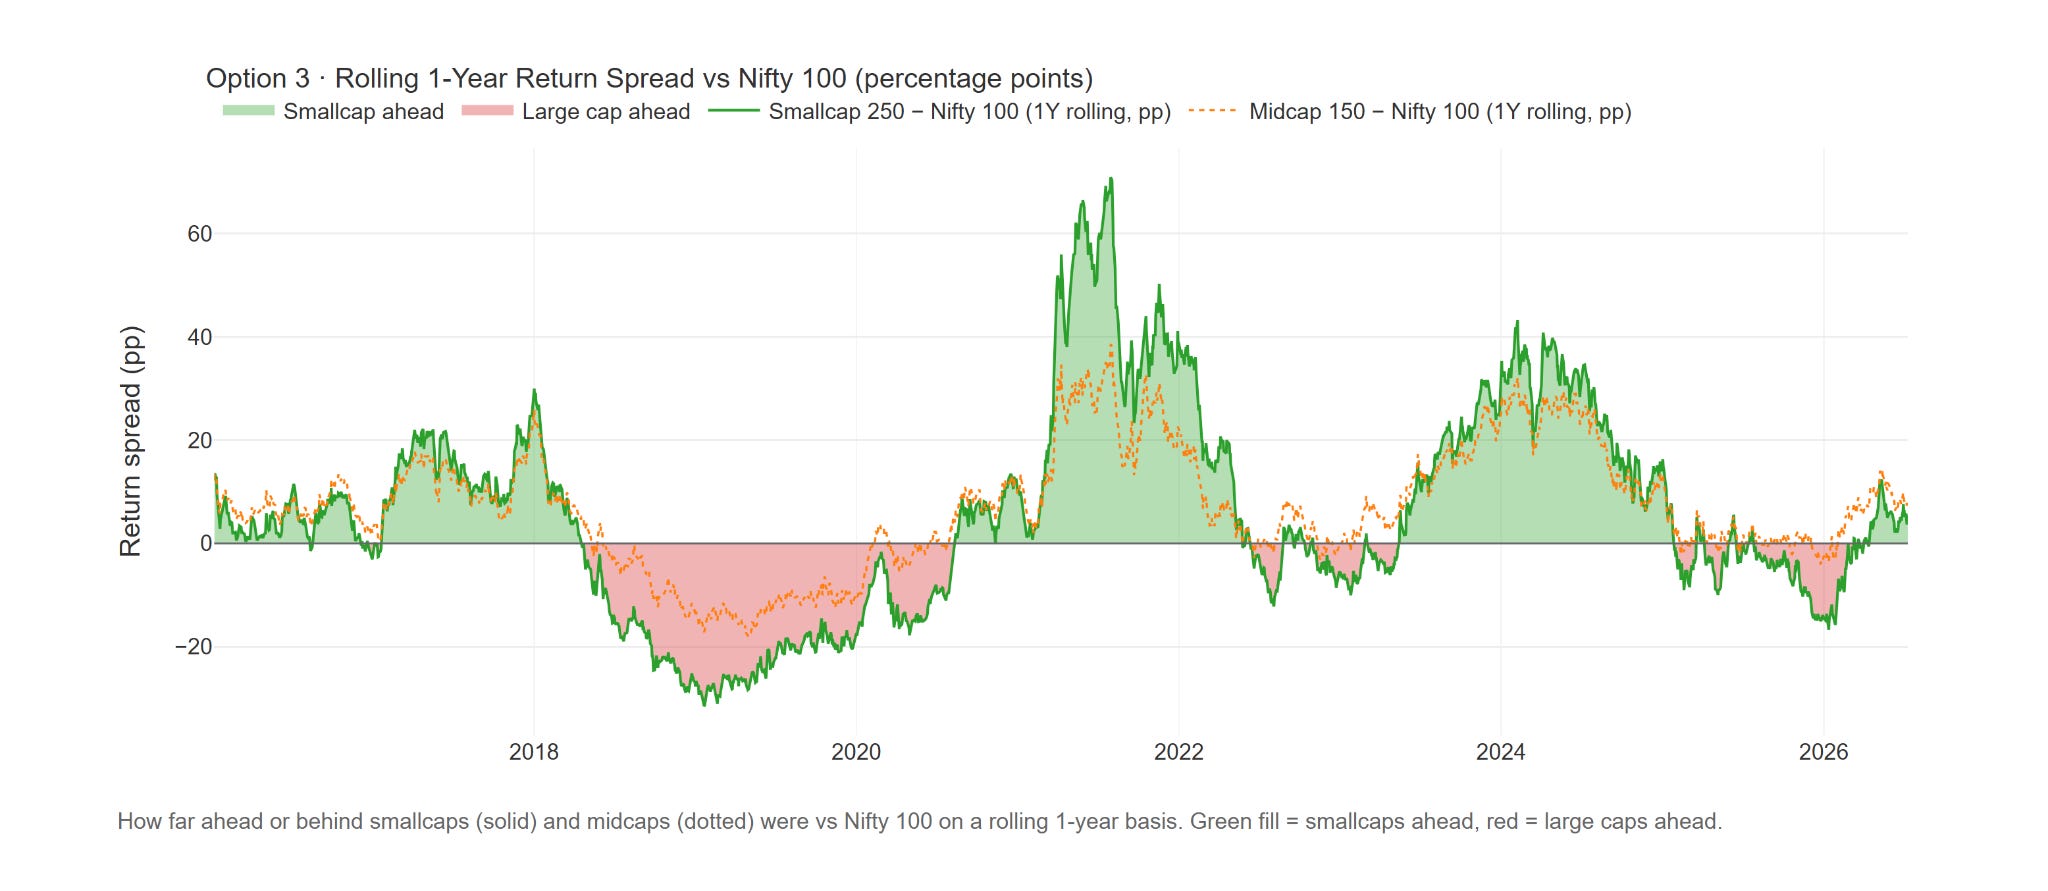
The chart looks at rolling one-year returns: on any given day, we look back exactly one year and check how much the Smallcap 250 returned versus how much the Nifty 100 returned. The difference — measured in percentage points — is what’s plotted. When the line is above zero (green), smallcaps have beaten large caps over the trailing year. When it’s below zero (red), large caps were leading.
What stands out in a decade of data:
- 2016 to early 2018: firmly with smallcaps, the spread stayed green almost throughout.
- April 2018 to August 2020: the longest red patch — a brutal 28-month stretch where large caps stayed ahead without a break. At the worst point in January 2019, smallcaps were trailing the Nifty 100 by over 31 percentage points on a one-year basis.
- Post-Covid recovery: smallcaps ran ahead for a year and a half, peaking at nearly 71 percentage points of outperformance in July 2021 — the widest gap of the decade.
- Mid-2023 to early 2025: another long green run.
- Late July 2025 to February 2026: the second-longest red zone of the entire decade — roughly seven months of large-cap leadership — before the market flipped back to green, which is exactly the shift discussed over the past several weeks.
Zooming out: smallcaps have spent roughly 60% of all trading days ahead of large caps, and midcaps a remarkable 75% . While leadership swings both ways, the broader market has spent more time winning.
Is there merit in chasing mids and smalls over the long run? What do you think — let me know in the comments.
Summary
Nifty ended the week almost flat, but it was anything but quiet. Wednesday’s sharp sell-off briefly broke the short-term structure, only for Thursday and Friday to reclaim the 21, 50, and 100-day EMAs. The 23,800 zone once again held firm, while the 200-day SMA around 24,850 remains the next major hurdle.
The broader market continued to outperform, with midcaps and smallcaps extending their lead over Nifty. Nifty Mid Select also became the first major index to reclaim its all-time high.
Sector leadership remained with Realty, while Microfinance, Pharma, and Auto Ancillary continue to stand out. In commodities, Crude Oil rallied, but Gold and Silver remained under pressure.
The bottom line: the broader trend remains constructive — not much structural damage done. As long as Nifty holds above the 24,200–23,800 support zone, the focus remains on a potential move toward the 200-day SMA and, eventually, 25,000.
What Caught My Attention This Week
Read: A long read from The Indian Express on India’s seafarers. Nearly one in five sailors worldwide is Indian, and this piece takes you inside the academies that train them, the small towns they come from, and what it feels like to take an oil tanker through the Strait of Hormuz with missiles overhead. Given the week we’ve had, timely and very human. Read it here
Listen: The Systematic Investor podcast from Top Traders Unplugged featuring Cem Karsan — one of my favourite market analysts — arguing that America is quietly drifting from free market capitalism towards a more strategic model, with government, markets, and technology deeply intertwined, and the US midterms as the next big catalyst. Provocative in many ways, and at under an hour, an easy and interesting listen. Listen here
Events to Factor In
A fairly quiet week on the macro front. India’s CPI inflation on Monday and WPI inflation on Tuesday are the key scheduled events, but unless there’s a significant surprise, they’re unlikely to move the markets in a major way. Otherwise, it’s a relatively light calendar with no major known macro events lined up.
If you find this series useful, don’t forget to subscribe to the channel — and do share it with your friends.
Until then — stay curious, stay steady, and enjoy your weekend.
https://inthemoneybyzerodha.substack.com/p/weekly-market-metrics-what-to-expect-c7f