Hello and welcome to the Weekly Market Metrics! I’m Sandeep Rao, and we’re in Week 30 of 2026. Last week I promised not to predict anything. Patting my back in hindsight.
Trump is back to his antics — three things worth knowing.
One — New tariffs on sixty countries , with forced labour as the stated reason. America spent months investigating which trading partners allow bonded or coerced labour in the goods they export. Countries that had banned such imports got the lower rate. India passed that rule in June, so we got 10% instead of 12.5%. Also, courts threw out his last set of tariffs. This one rests on much older law, so it isn’t going away.
Two — And this one affects us more. Generic drugmakers have two years to move manufacturing to America or face a 100% tariff — rising to 200% from 2029. India supplies 47% of every generic prescription in America. Dr Reddy’s has said moving isn’t practical — it’ll just raise American prices instead.
Three — The oil issue. With Hormuz still shut, Saudi Arabia rerouted its exports through Bab al-Mandab near Yemen — where the Houthis, an Iran-backed rebel group, decided to hit the tankers. As a consequence, Brent crossed $100, and India is one of the buyers at the far end of that route.
And none of it occupied the headlines here, because of the student protests — building for weeks, taking a serious turn that the Prime Minister had to address the day before yesterday.
Obviously, all of this wasn’t positive for the markets. Nifty ended last week at 24,334. This week, by Friday, we closed at 23,767 — all five daily sessions ending in the red.
Section 1 — What Happened Last Week
Rate of Change (ROC) Across Indices

It was a red week across the board, with all headline indices ending lower. Nifty 50 declined 2.3%, while Smallcap 250 fell by a similar margin. Microcap 250 was relatively resilient, slipping just 0.5%.
Looking beyond the week, the six-month trend still favours the broader market. Microcap 250 continues to lead with gains of over 21%, followed by Smallcap 250 at nearly 15%. Nifty 50 remains the weakest performer, down just over 5% over the same period.

Among the major indices, Nifty Mid Select held up the best, declining 1.9%, while Nifty Bank was the weakest performer, falling 3.1%. Nifty 50 and Sensex lost 2.3% and 2.7% each.
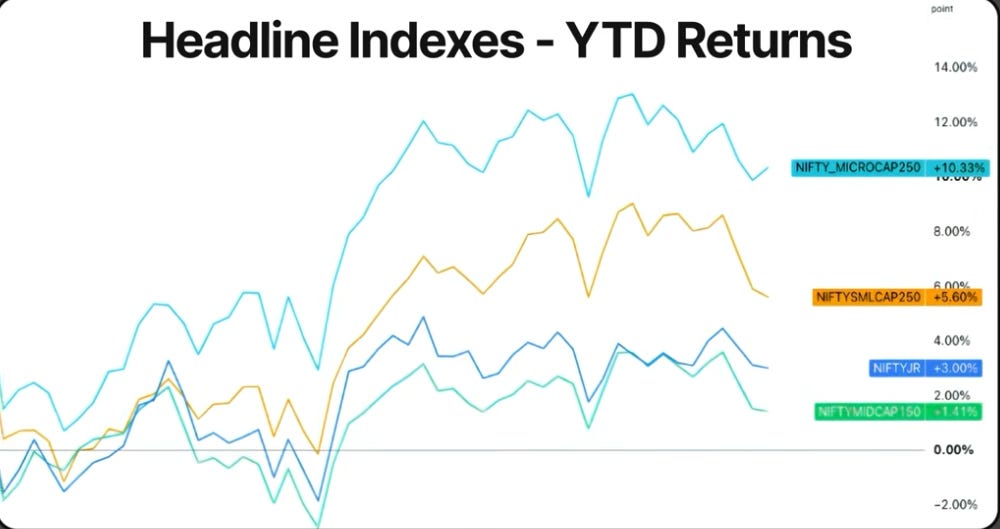
On YTD performance, Nifty Mid Select remains the only major index in positive territory, up 4.8%. Nifty Bank has recovered significantly over the past few months but is still down nearly 5% for the year. Nifty 50 and Sensex continue to lag, with both indices down around 9–11% year-to-date.
We’re now in Week 30 of 2026, and there is still no sign of Nifty recovering into positive territory for the year. In fact, if Nifty finishes July with a year-to-date decline of around 9% or more, it would be the first time since 2011 that the index has been down by at least 9% at the end of July.
NIFTY
Weekly
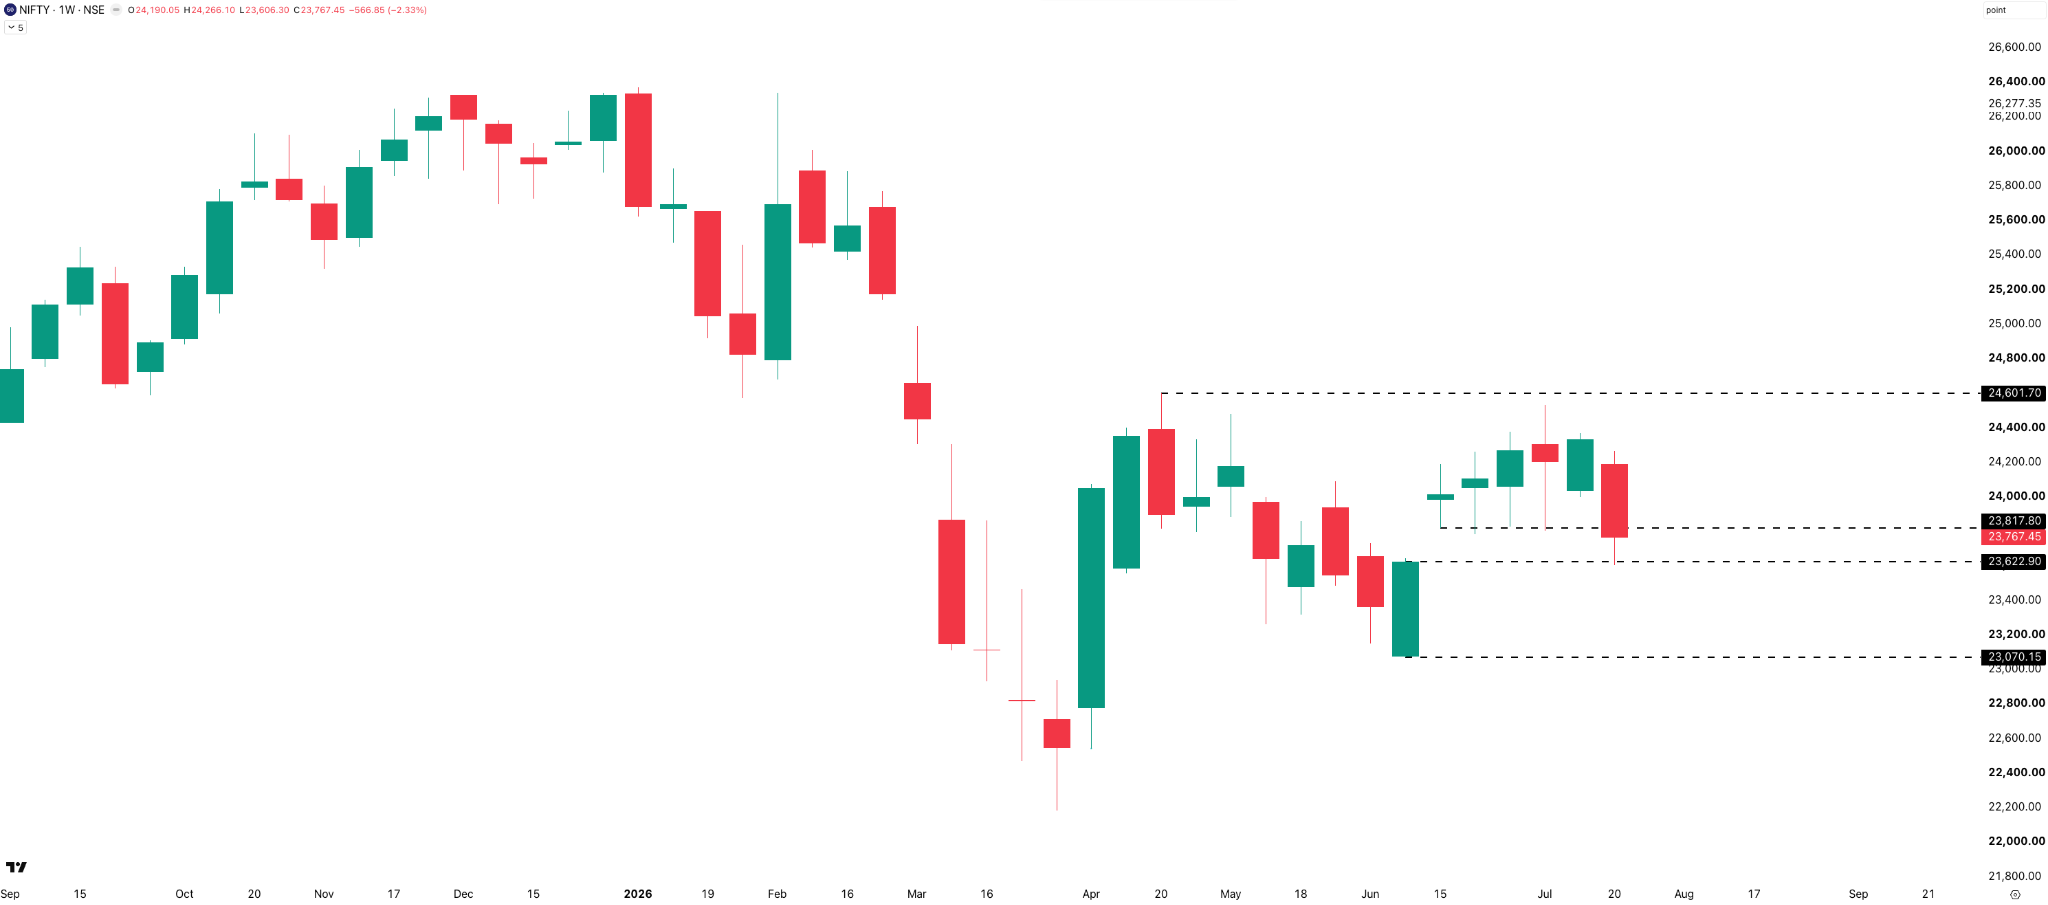
The weekly chart has turned noticeably weaker. Nifty has slipped below the important 23,800 support zone — a level that had been tested multiple times over the past few weeks but had managed to hold until now. This week, that support finally gave way, with the index even testing the 23,600 level before closing the week at 23,767.
What’s interesting is how quickly sentiment has changed. Just last week, it looked like Nifty was building momentum for a move above the 24,600 resistance. Instead, within a matter of days, the index dropped nearly 1,000 points and is back testing 23,600 levels. Going into next week, the 23,800 zone now turns into the first resistance to watch. On the downside, if 23,600 fails to hold, the next major support comes in around the 23,000 mark.
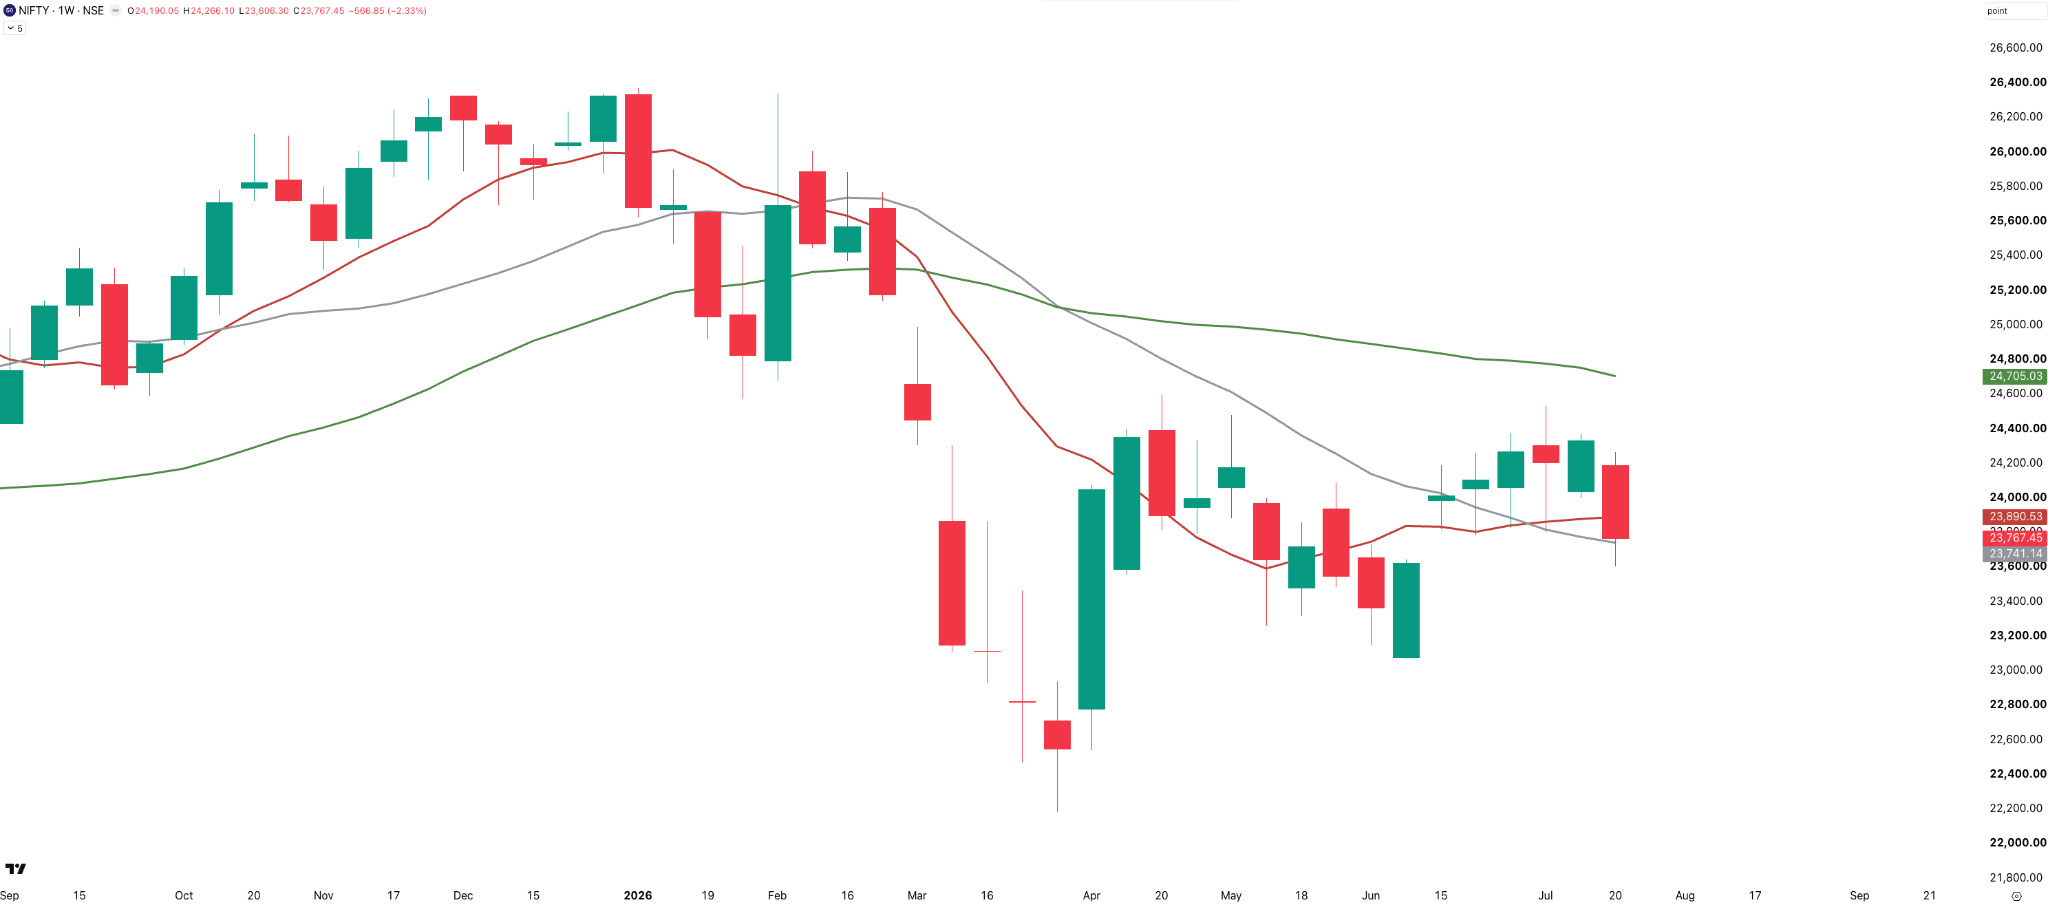
From a moving average perspective, the picture is mixed. After several months of sideways movement, the moving averages have started converging and crossing each other, reflecting the lack of a sustained trend. Nifty is currently trading below the 10-week SMA and around the 20-week SMA, while the 40-week SMA near 24,750 continues to be the key long-term resistance.
W30

W29

Volatility returned this week, with the weekly trading range expanding sharply from 367 points last week to nearly 660 points. The week, however, wasn’t volatile throughout — Monday and Tuesday were relatively calm, with daily ranges of just 127 and 130 points respectively. Friday was the most volatile session, recording a 217-point intraday range.
Daily
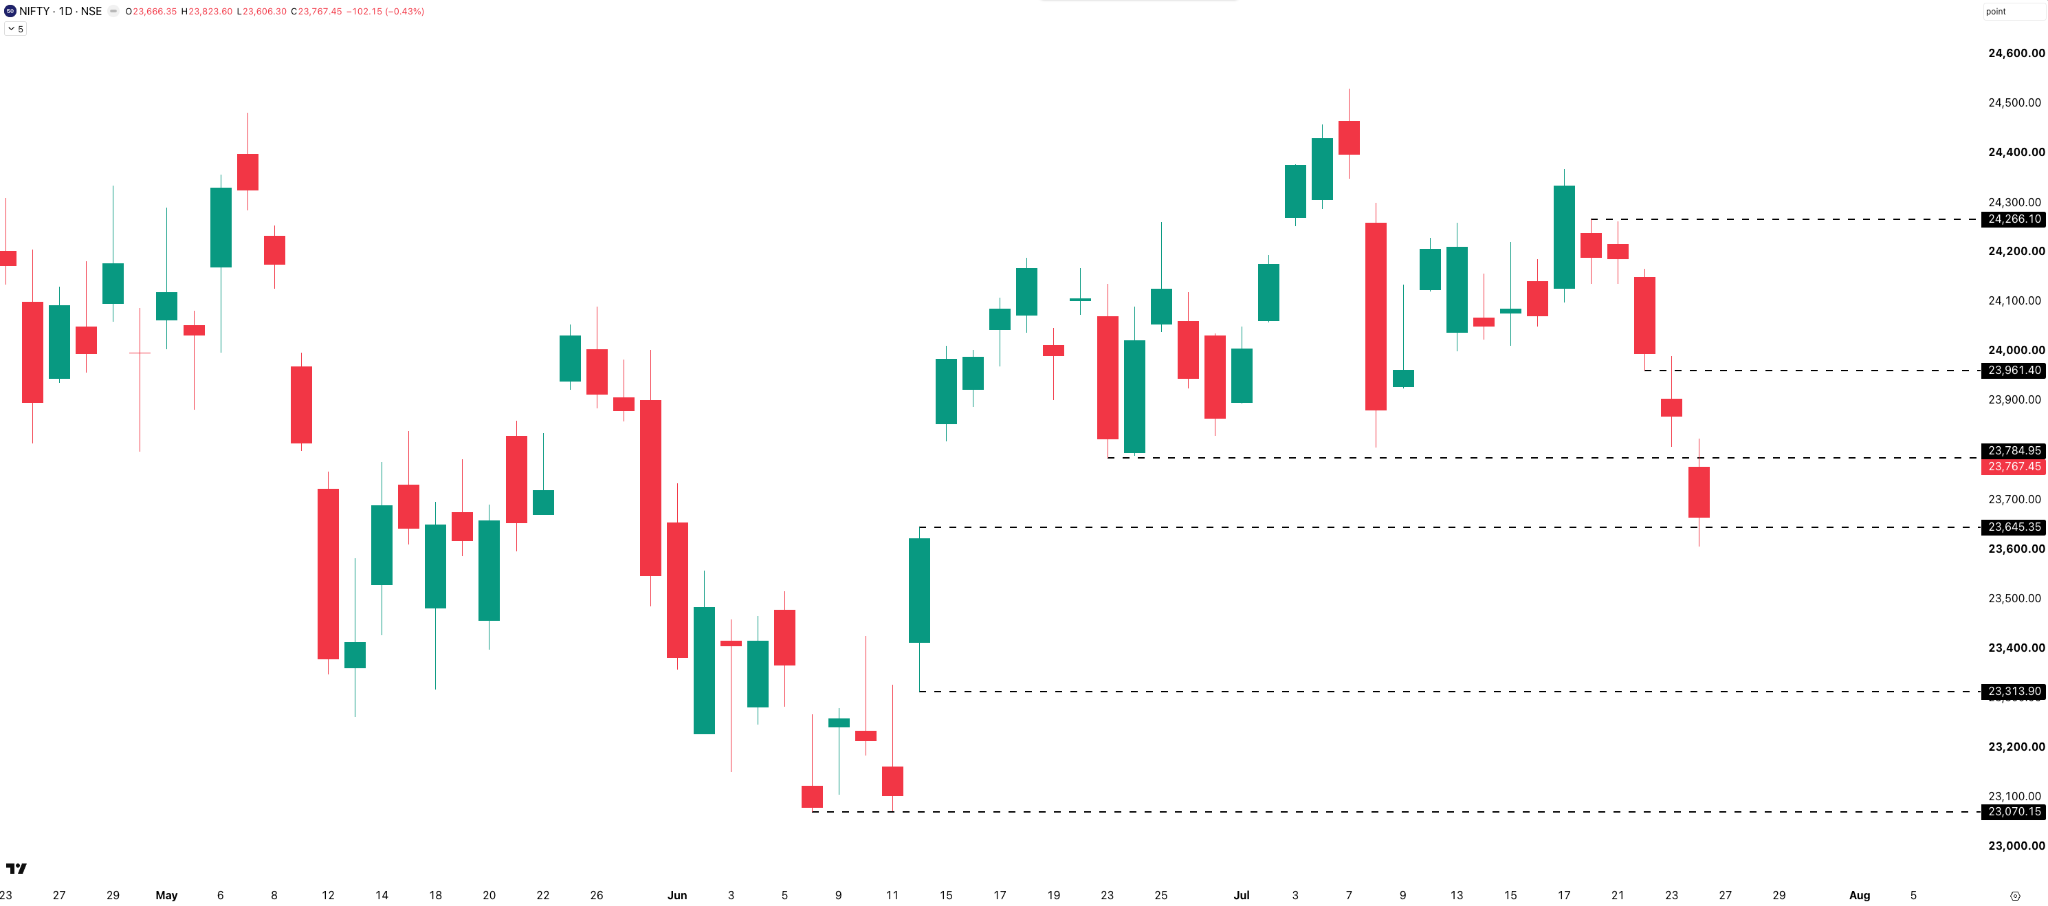
Nifty started the week with a brief attempt to hold above 24,200, but selling pressure intensified in the second half. The index first broke below 24,000, then breached the important 23,800 support, and by Friday had tested the 23,600 zone before closing at 23,767. All five trading sessions ended with negative closes — consistent selling pressure throughout.
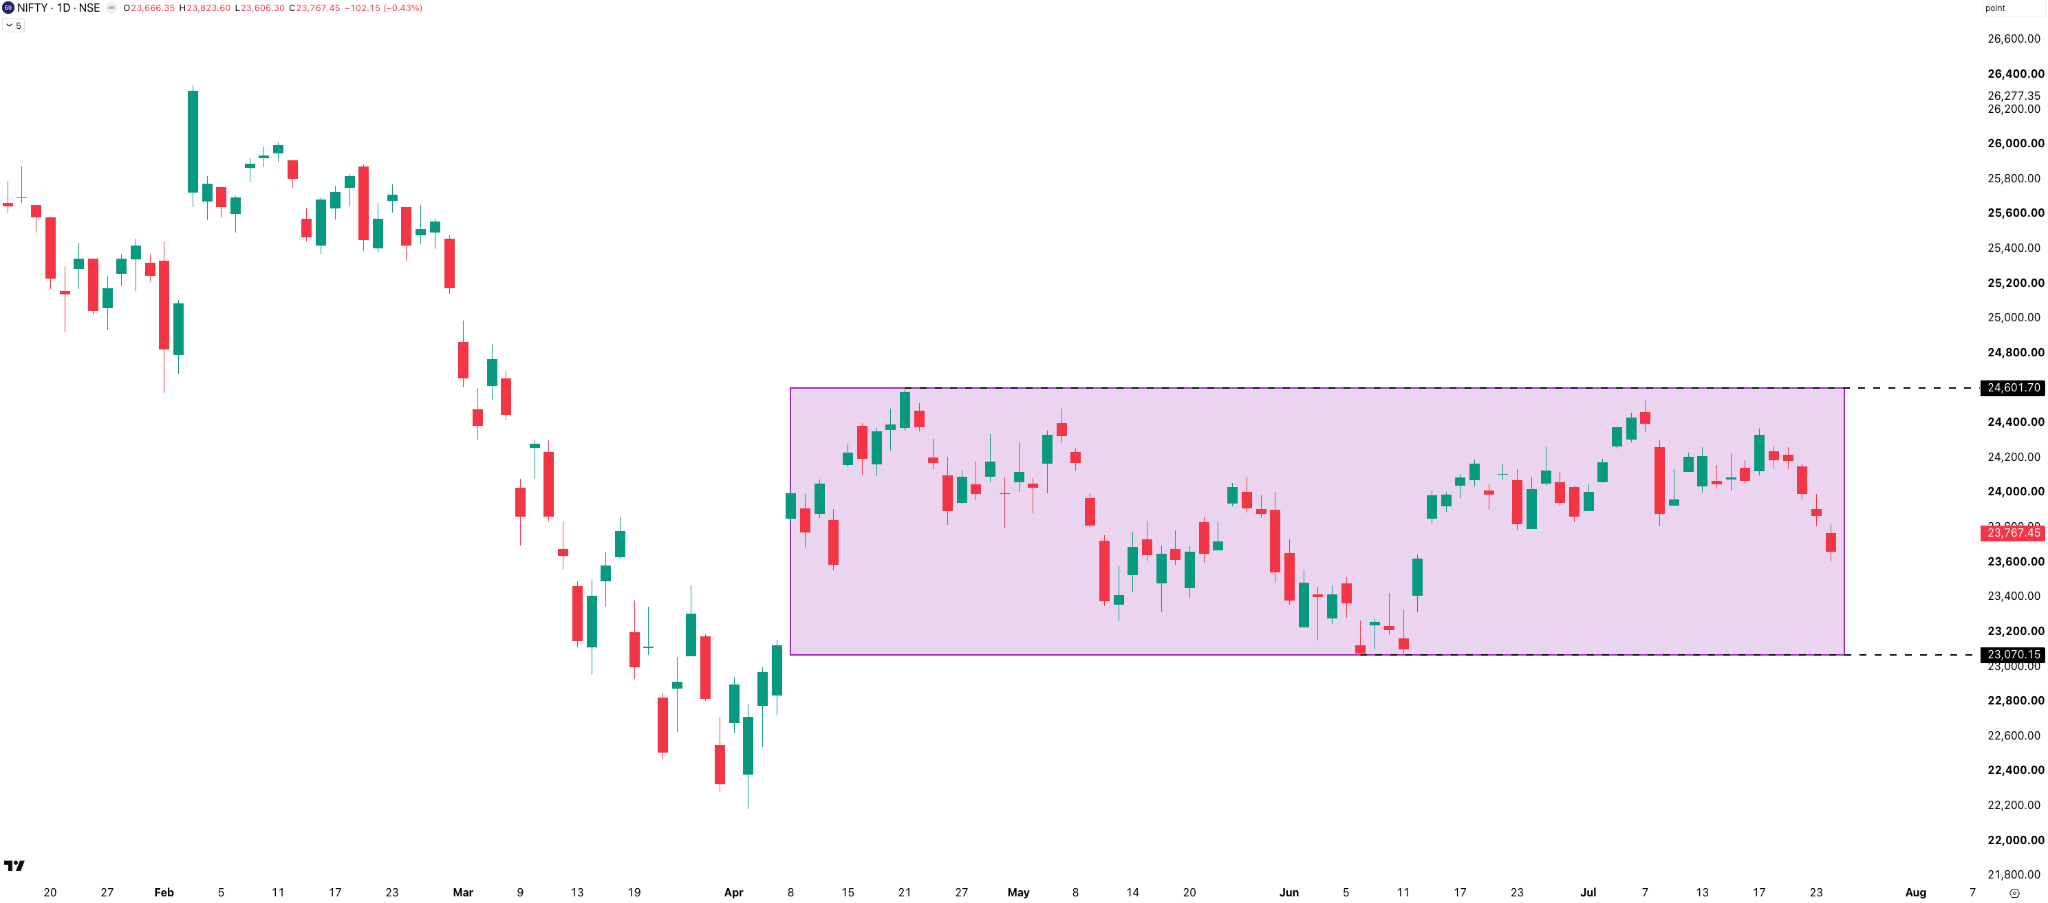
Zooming out on the daily chart, something interesting stands out: since April 2026, Nifty has essentially been stuck in a range between 23,070 and 24,600 — a range of roughly 1,500 points. That’s 73 trading days, 107 calendar days, 15 weeks, or three and a half months inside this range.
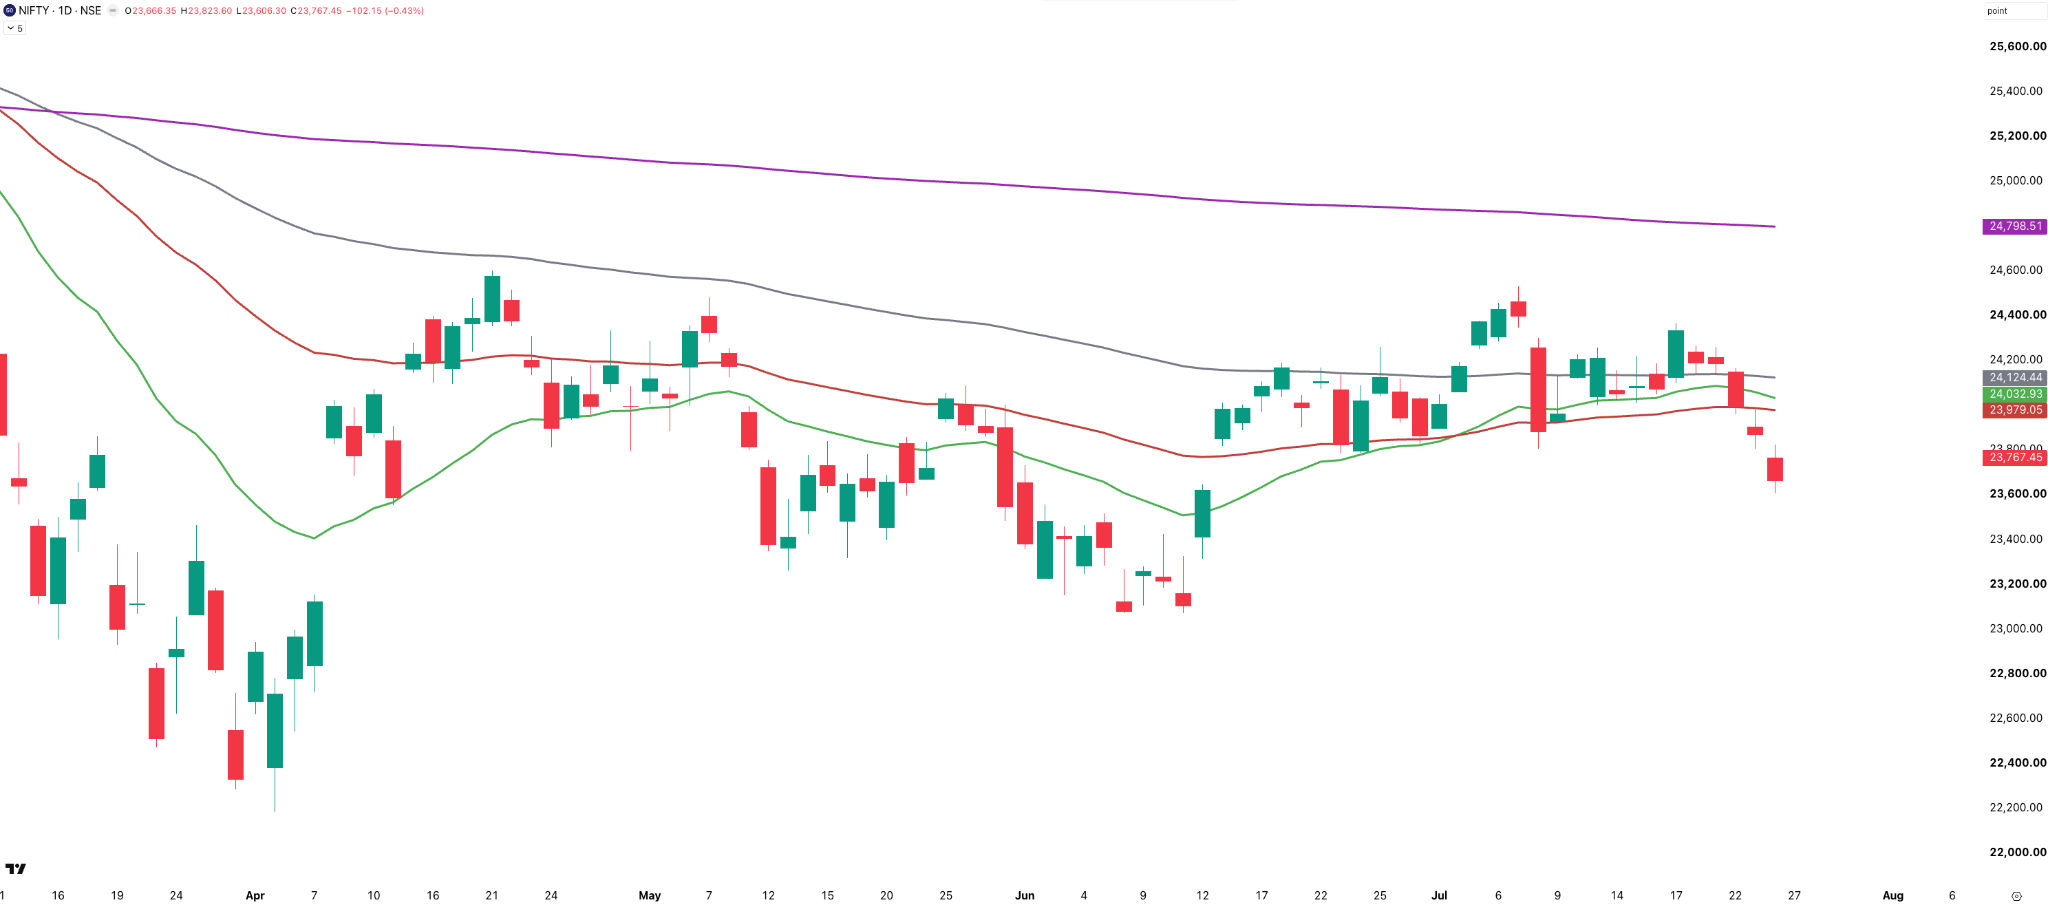
From a moving average perspective, the technical picture has deteriorated further. Nifty has slipped below the 21-day, 50-day, and 100-day moving averages, all of which are now clustered between 23,950 and 24,150 and will act as an important resistance zone. The 200-day SMA near 24,800 remains well above, making it a distant long-term resistance. For the bulls, the first challenge is to reclaim the 21-day EMA, followed by the 50-day and 100-day moving averages. Until then, the short-term trend remains bearish.
Hourly
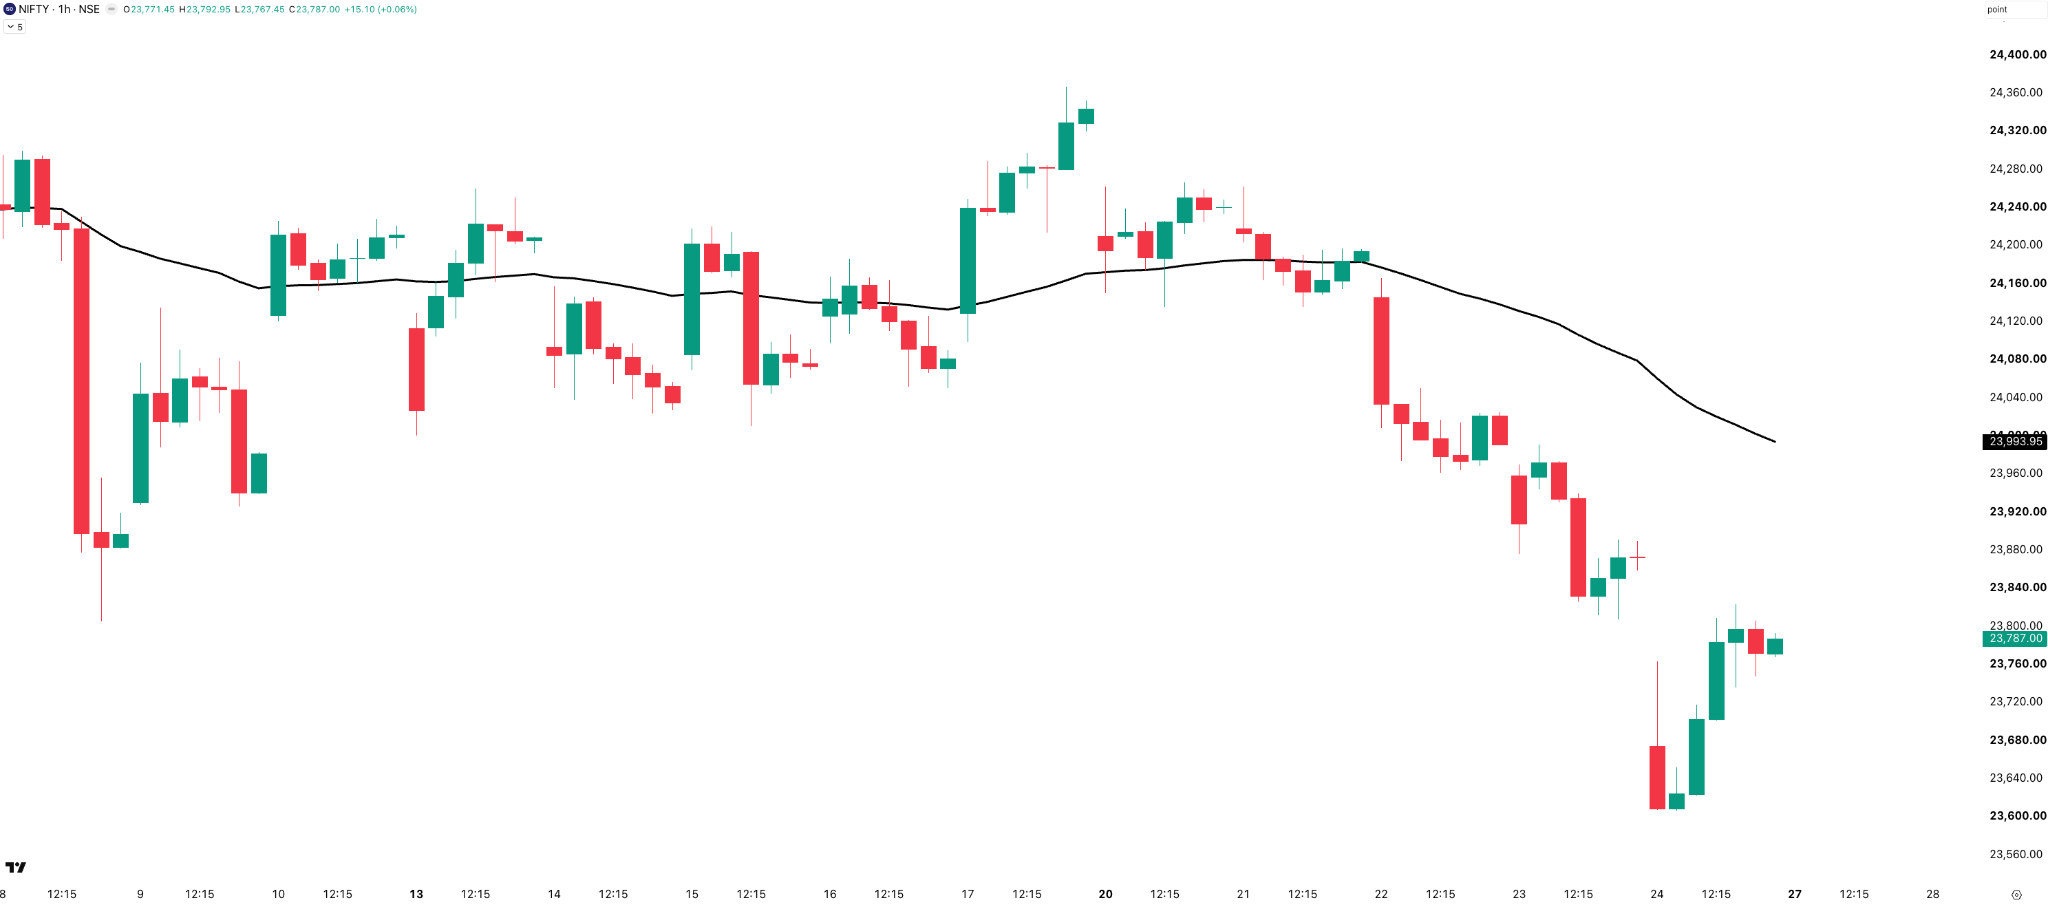
The trend remained bearish throughout the week. Nifty stayed below the 50 EMA for most of the week, and every intraday bounce was met with selling. The index ended the week well below the 50 EMA, reinforcing the short-term bearish trend.
Nifty Weekly Expiry — Tuesday, 21 July
The ATM straddle opened at around 108 points, while the entire day’s range was just 127 points — the narrowest trading range of the week, much like last Tuesday. That makes it two relatively easy expiries in a row for option sellers, with the entire day’s move staying very close to the straddle premium at the open. Two easy expiries down — let’s see if the monthly makes it three in a row. Let me know in the comments how your expiry trading went.
Section 2 — What to Expect in the Coming Week
NIFTY
23,800 is now the first level to watch — it acted as support for weeks, but after this week’s breakdown, it now becomes resistance. On the downside, 23,600 remains the immediate support. If that gives way, Nifty could head towards the 23,000 mark.
Overall, the short-term bias has turned bearish . The key question for next week is whether the bulls can reclaim 23,800, or if the correction continues.
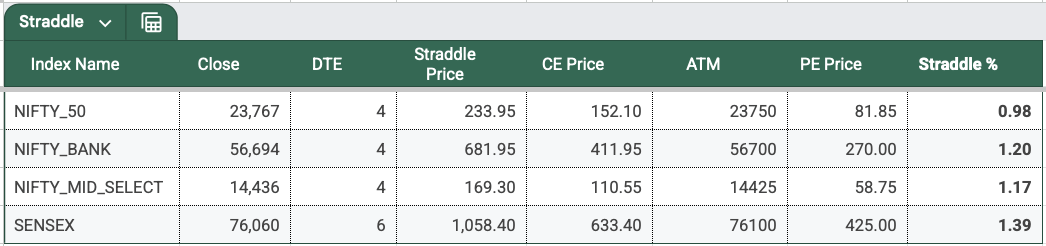
The Nifty ATM straddle is trading at around 234 points, implying an expected move of about 0.98% from the current level. That gives an expected range of approximately 23,533 on the downside and 24,001 on the upside for the upcoming monthly expiry on Tuesday, 28 July .
Since this is a monthly expiry, it’ll be interesting to see if realised volatility finally exceeds implied volatility — in simple terms, whether Nifty moves more than the 234 points currently being priced in.
India VIX
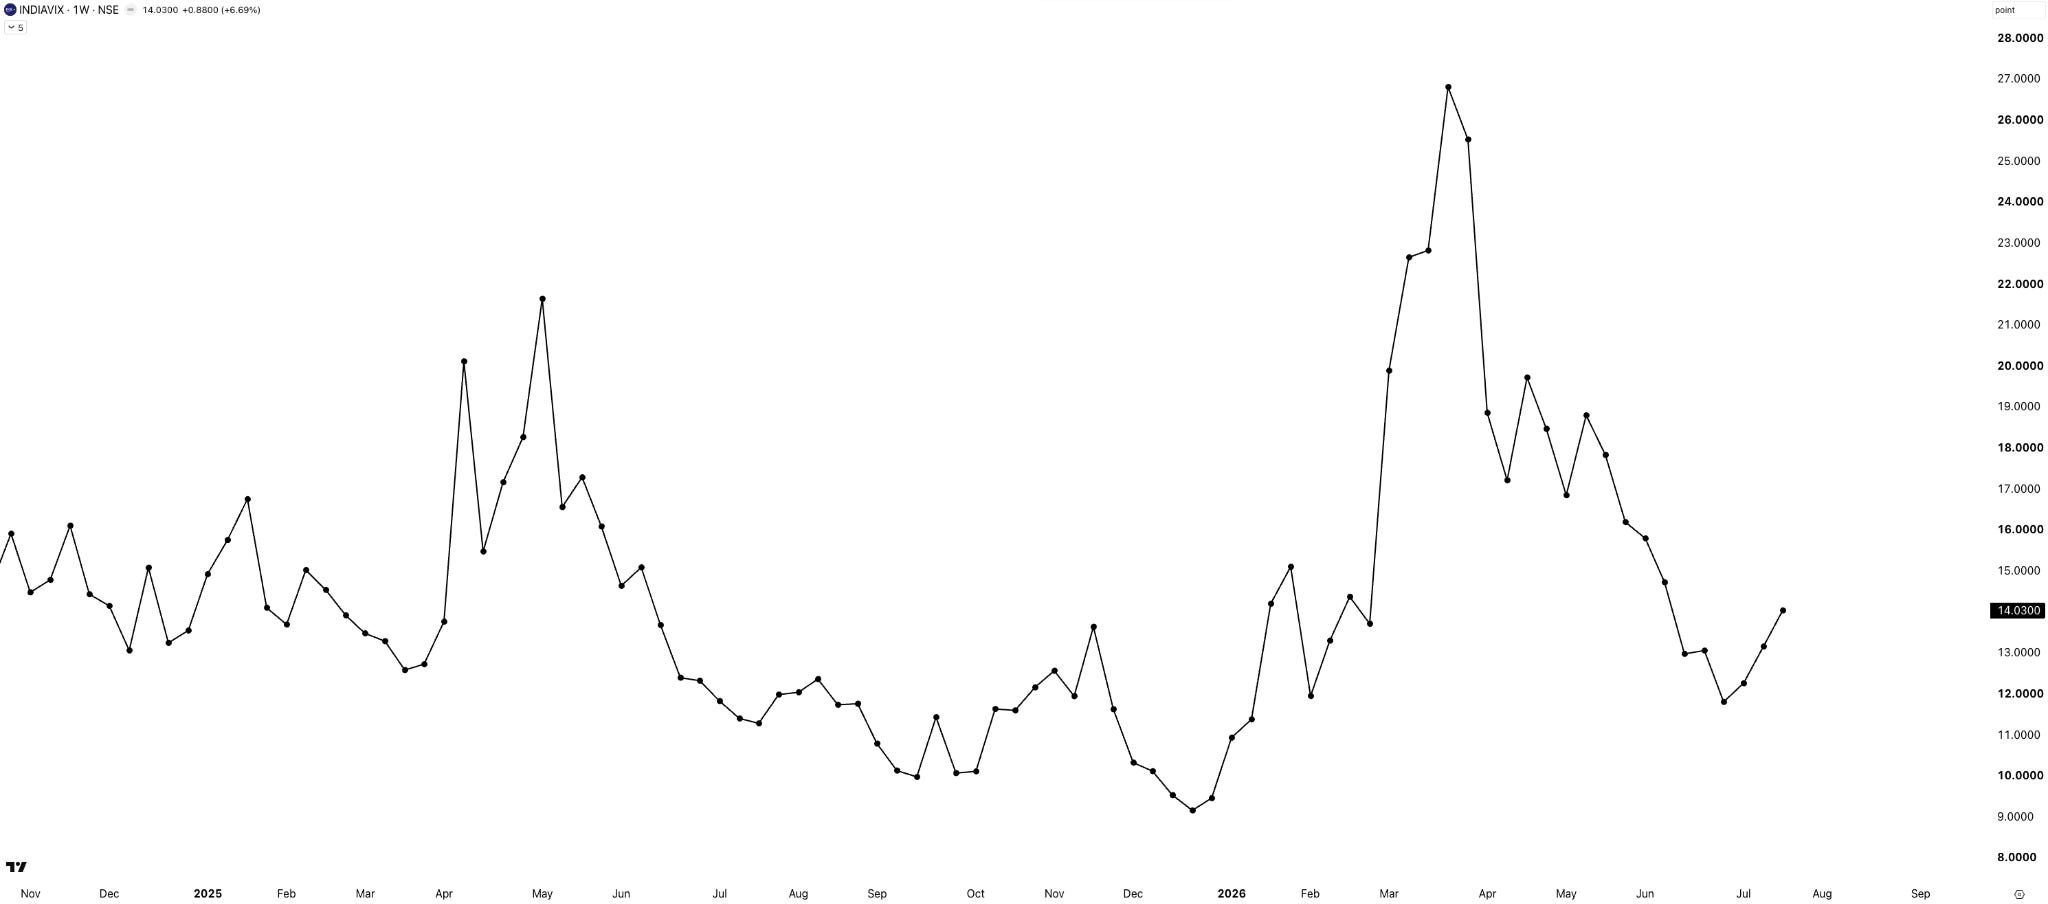
India VIX has now risen for three consecutive weeks. After falling to a low of 11.8 earlier this month, it has climbed back to 14. While still well below the panic levels seen in March and April, it does suggest that traders are starting to price in a bit more uncertainty ahead of the monthly expiry.
Sectoral Performance
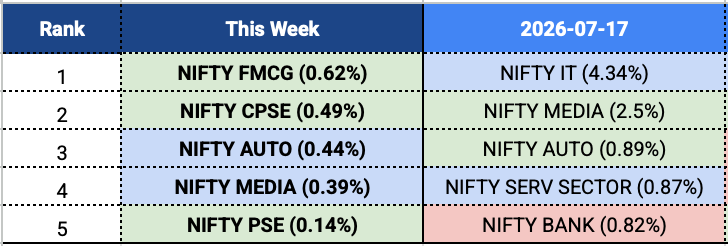
Nifty sector view: Another quiet week with no sector gaining even 1%. FMCG was the best-performing sector, up 0.6%, followed by CPSE and Auto. Media, which was among the top performers last week, also managed to stay in the top five, while PSE rounded out the list. Compared to last week, IT — which topped the charts with a gain of over 4% — is no longer in the top five, reflecting the broader weakness seen across the market.
W30

W29

Tijori index view: Paper & Board, Paint Manufacturers, Dyes & Pigments, and Wires & Cables. Other than Wires & Cables — something discussed in earlier editions — none of the others show a sustained sectoral tailwind. And similar to last week, not a single basket is at its 52-week high. Breadth has paused.
Commodities
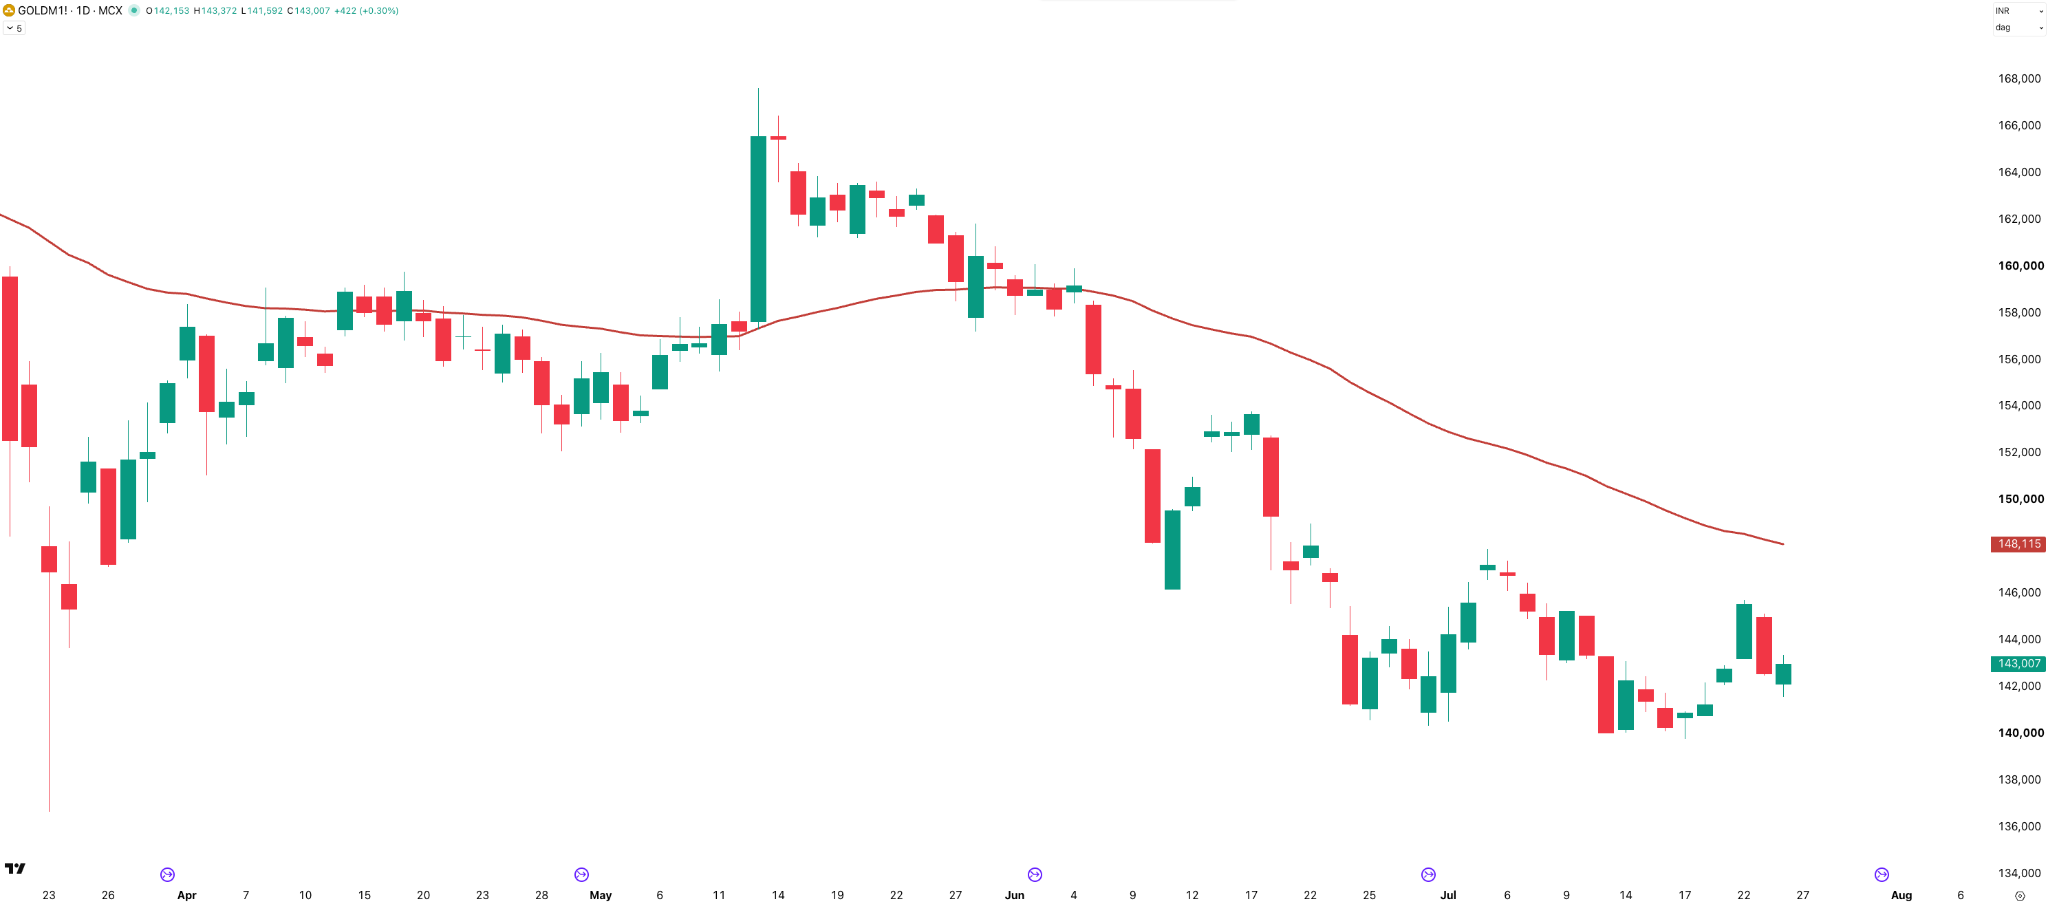
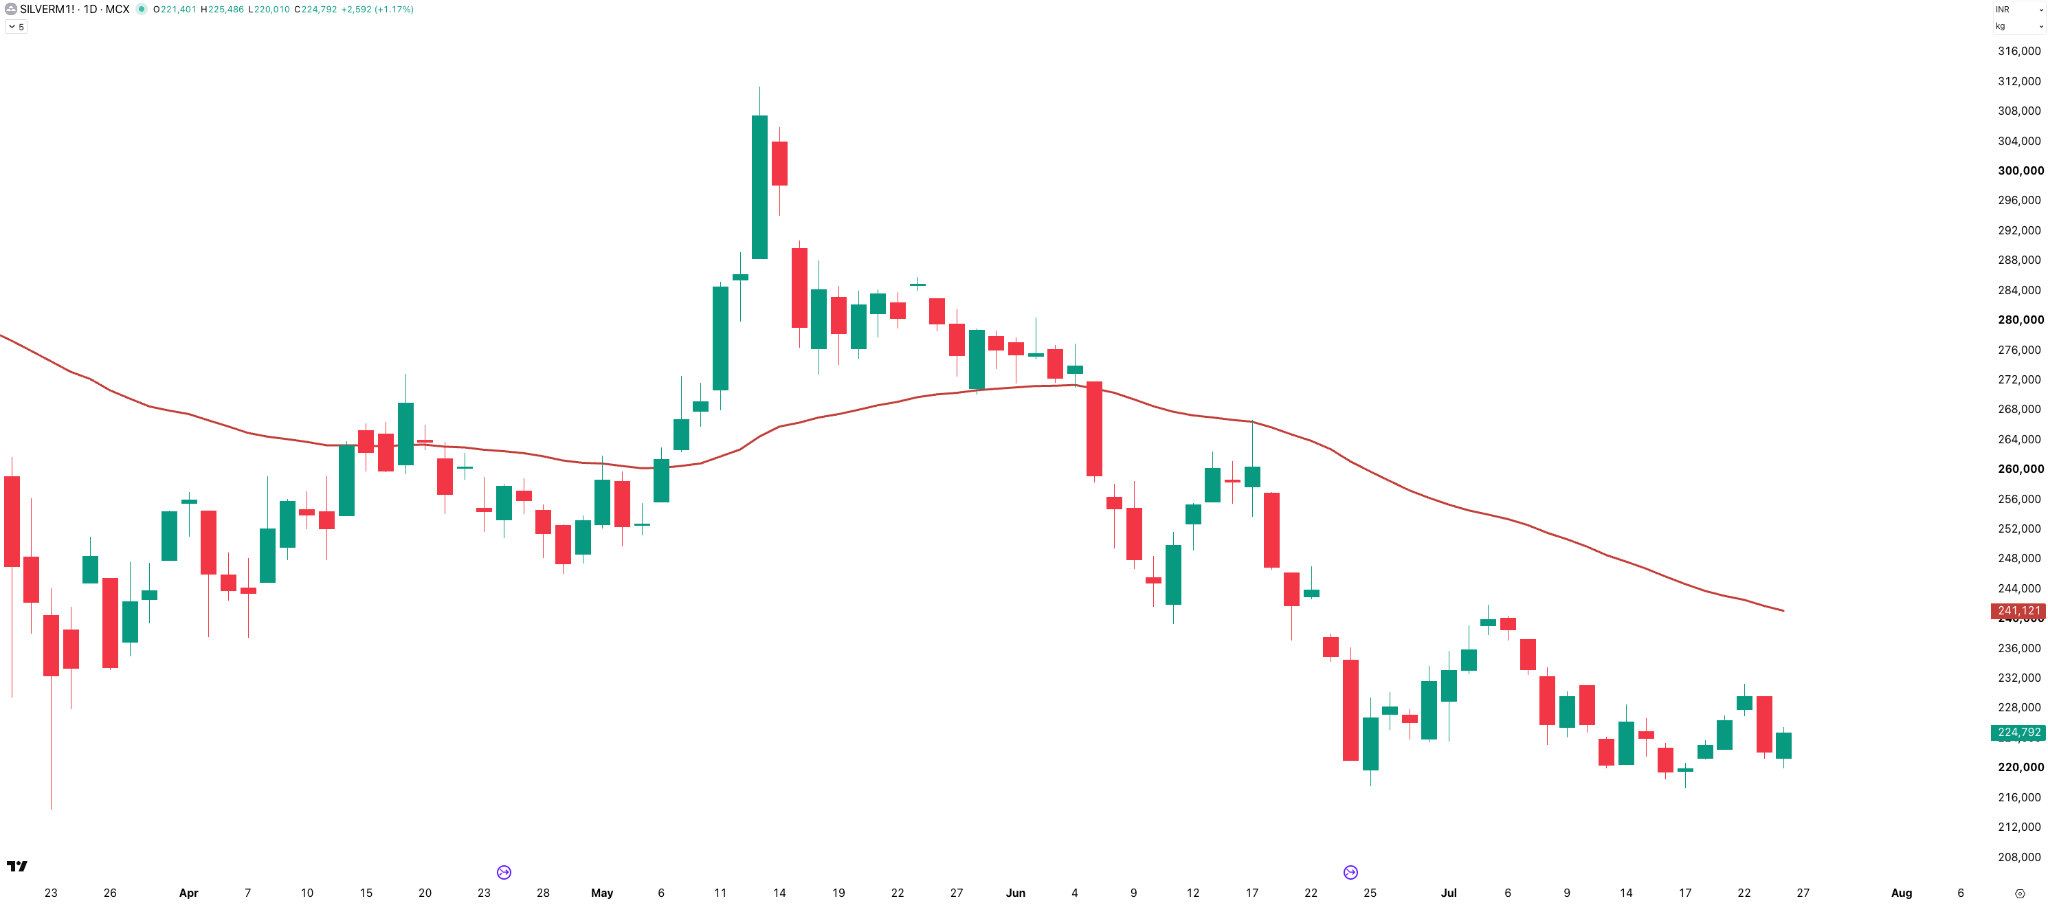
On the daily timeframe, both Gold and Silver remain in a short-term downtrend. Although they’ve seen a small bounce over the past few sessions, both continue to trade well below their 50-day moving averages. Until they reclaim those levels, the trend remains weak, and any pullback is likely to be viewed as a relief rally rather than the start of a new uptrend.
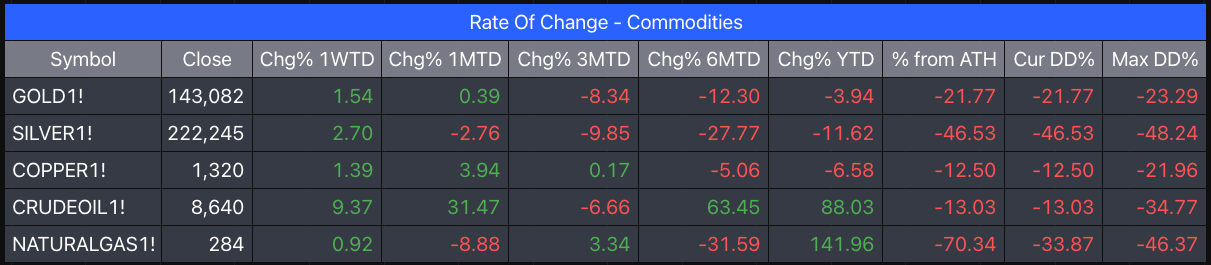
On a weekly basis, commodities were mostly positive. Crude Oil was once again the standout performer, gaining over 9% during the week. Gold and Silver also rebounded, rising 1.5% and 2.7% respectively, while Copper ended slightly higher. Natural Gas was largely flat.
Despite this week’s bounce in precious metals, both Gold and Silver remain in negative territory for the year. Crude Oil leads as the second-best performer, up nearly 88% year-to-date, while Natural Gas remains the top performer with gains of around 142%.
Summary
The market showed signs of weakness after spending more than three months in a range. Nifty broke below the important 23,800 support; the short-term trend has turned bearish, and traders will now be watching whether 23,600 holds or if the correction extends towards 23,000.
Volatility has started to pick up, but with the monthly expiry coming up, the big question is whether the market delivers a move larger than what’s currently being priced in.
Overall, an uncertain week ahead with a bearish skew.
What Caught My Attention This Week
Listen: The FT’s Story of Money podcast on Jesse Livermore — the trader who shorted the crash of 1929. He is known to have made and lost several fortunes. His life became Reminiscences of a Stock Operator , a novel that thinly disguised real people, and traders still quote it a century on. Just under an hour. Fair warning: the ending is a sad one, and it covers his suicide. Watch on YouTube
Read: Thinking about the students protesting on the streets all of last week led to Azim Premji University’s State of Working India report. India adds roughly 50 lakh graduates a year, and only about 28 lakh find work of any kind — meaning 50% of graduates don’t find work within a year. Of that, just 17 lakh find a salaried job. And this isn’t new — graduate unemployment has been between 35% and 40% since 1983. Something worth thinking about. Read the report
Events to Factor In
- Tuesday, 28 July — Monthly expiry for all NSE index derivatives: Nifty, Bank Nifty, and Midcap Nifty.
- Thursday, 31 July — Monthly expiry for BSE indices: Sensex and Bankex.
- Wednesday, 29 July (night) — US Federal Reserve interest rate decision. No rate cut is expected, but the commentary and guidance could influence global markets and may have an impact on Thursday’s Sensex monthly expiry.
Other than that, no major scheduled macro events — but as we’ve seen over the past few weeks, geopolitical developments can emerge at any time and quickly change market sentiment.
If you find this series useful, don’t forget to subscribe to the channel — and do share it with your friends.
Until then — stay curious, stay steady, and enjoy your weekend.