Hello and welcome to the Weekly Market Metrics! I’m Sandeep Rao, and we’re in Week 31 of 2026.
I want to start with what’s been happening in South Korea since last week. Their market, the Kospi, slid three straight days — down close to 17%, wiping hundreds of billions of dollars off its value — then came back roaring almost 18% from the lows on Friday. The trigger? Strong earnings from Amazon and Microsoft revived optimism about the billions being poured into artificial intelligence, and chipmakers SK Hynix and Samsung shot up around 30% and 28% in a single session. This is a market that has more than doubled this year and been halted repeatedly by circuit breakers. One can only imagine what retail traders and investors must be going through over there.
Elsewhere, the world got a tad bit peaceful: President Trump announced a deal for Hamas to disarm and Israel to withdraw from Gaza. The caveat — as with all things Trump — is that neither side has confirmed it, and the timelines stretch close to a year.
Closer home, the news is rather sombre. Assam’s floods have now claimed 80 lives, with over 2.12 lakh people affected across eight districts. A reminder that the biggest stories of the week don’t have to show up on tickers.
Back to our own market: Nifty closed the week in the green, up 2.6%. And since this is our month-end edition, we’ll also dig into the monthly seasonality.
Section 1 — What Happened Last Week
Rate of Change (ROC) Across Indices

It was a positive week across the board, with all headline indices ending higher. Nifty 50 and Next 50 led the way, both gaining 2.6%, while Midcap 150, Smallcap 250, and Microcap 250 also ended in the green.
Looking beyond the week, the picture remains positive across all timeframes. On a one-month basis, all headline indices are in the green. The same is true over three months. Even on a six-month basis, all broader market indices remain positive, with Microcap 250 leading at over 20%. Nifty 50 is the only headline index still in the red over six months.

Nifty 50 and Sensex were the top performers this week, gaining 2.6% each. Mid Select also had a strong week, rising 2.4%, while Bank Nifty lagged with a gain of just about 1%.
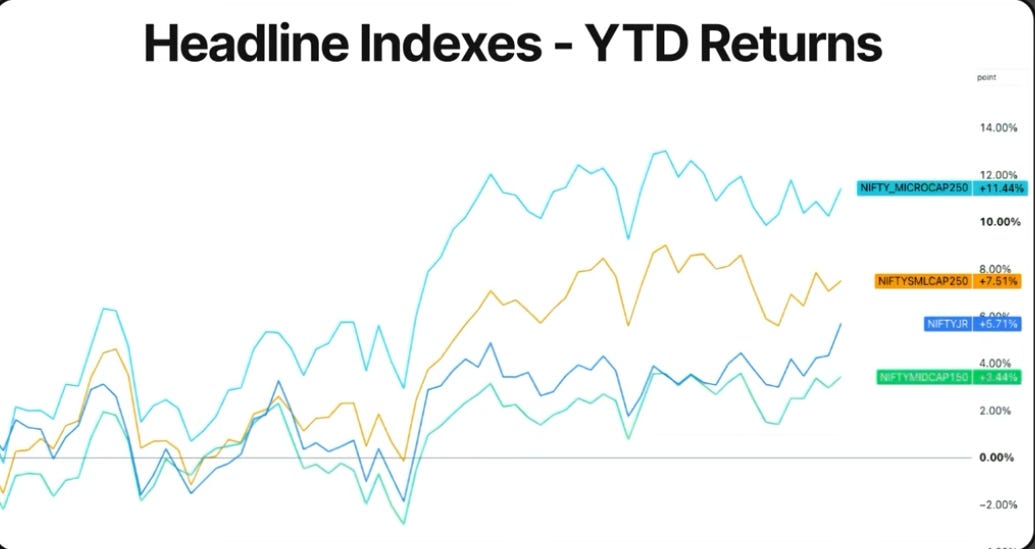
On a YTD basis, Mid Select remains the only index in positive territory, up over 7%, while Nifty 50 and Sensex continue to be the weakest performers, still down nearly 7% and 8% each. Microcap 250 leads with gains of over 11%, followed by Smallcap 250, Mid Select, and Next 50. The broader market continues to hold on to its lead in 2026.
Last week, we mentioned Nifty was on track for its weakest performance at the end of July since 2011. This week’s rally changed that, with the index trimming its year-to-date losses to around 6.7% by the end of July.
Nifty Monthly Seasonality
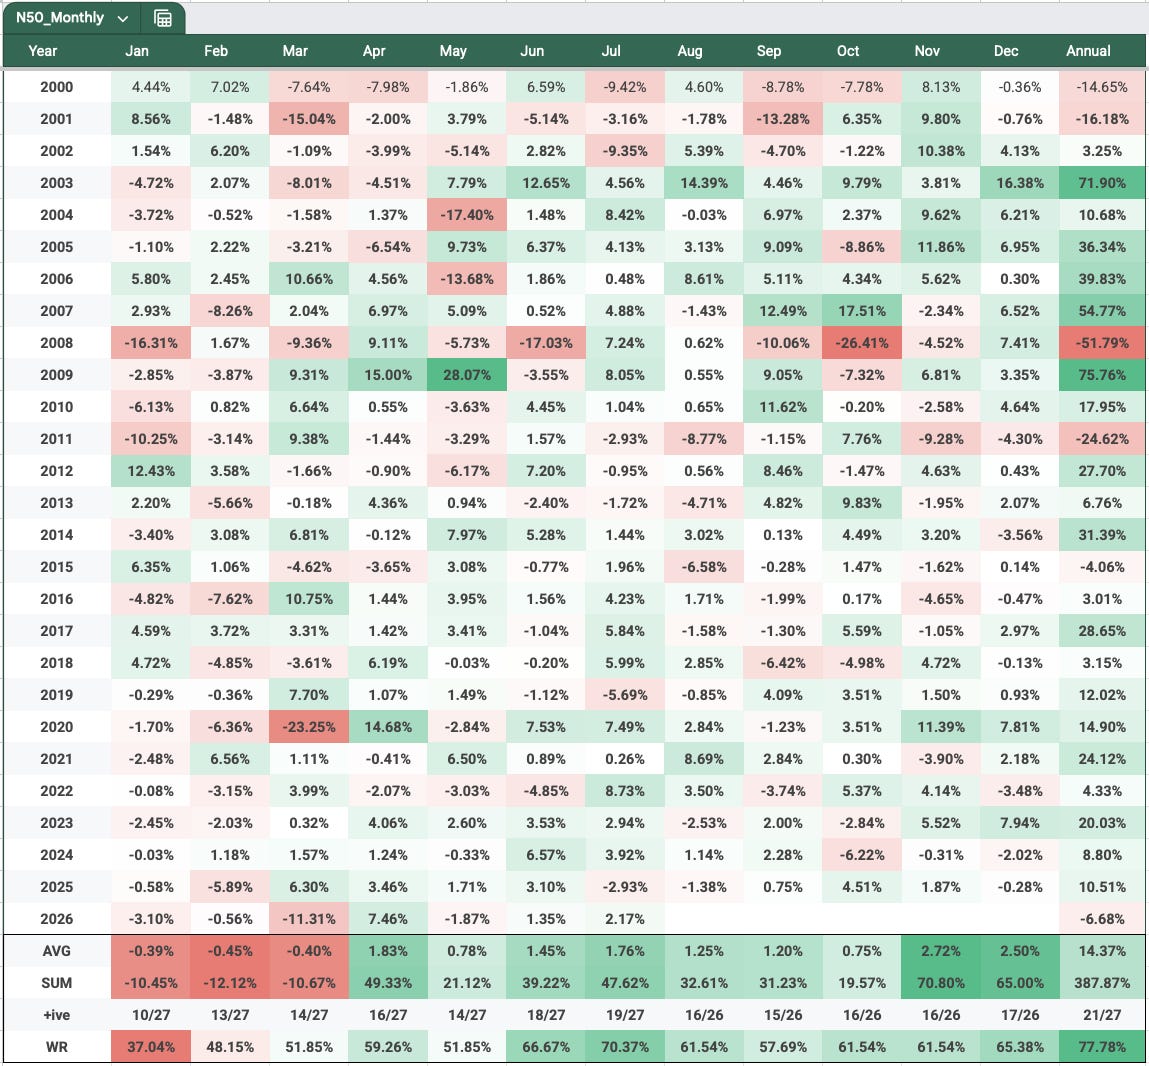
July 2026 finished in the green with a gain of 2.17%, extending the recovery that began in June. However, despite two consecutive positive months, Nifty is still down 6.7% for the year.
Historically, August has also been a positive month, though not as strong as July. Over the last 26 years, August has finished higher in 16 years, giving it a 61.5% win rate and an average return of around 1.25%.
Looking at recent history, August has delivered positive returns in 4 of the last 6 years, with 2023 and 2025 being the exceptions. It’ll be interesting to see if August can continue the recovery and help Nifty reduce its year-to-date losses further.
NIFTY
Weekly
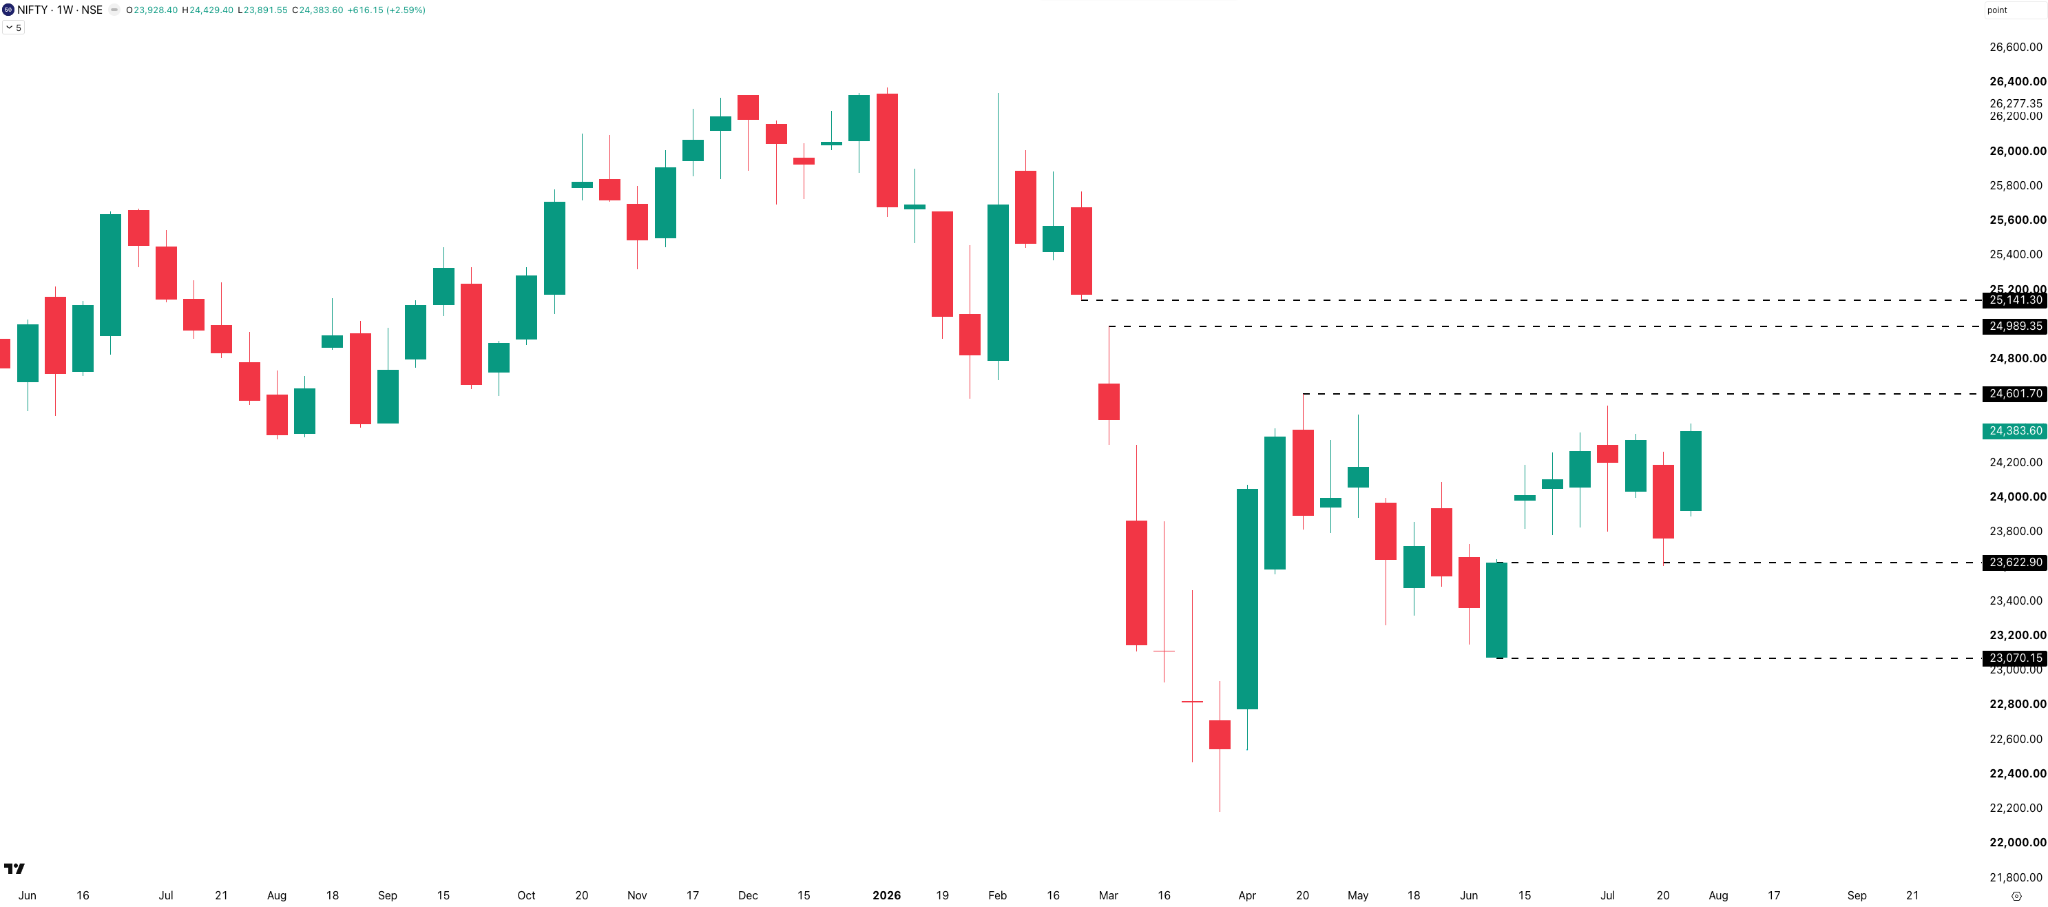
Nifty staged a solid recovery after last week’s weakness. The index gained over 600 points during the week, reclaiming the 24,200 level and closing at 24,384. This is also Nifty’s highest weekly close in 21 weeks — nearly five months — with the last higher weekly close recorded during Week 10 of 2026 in March.
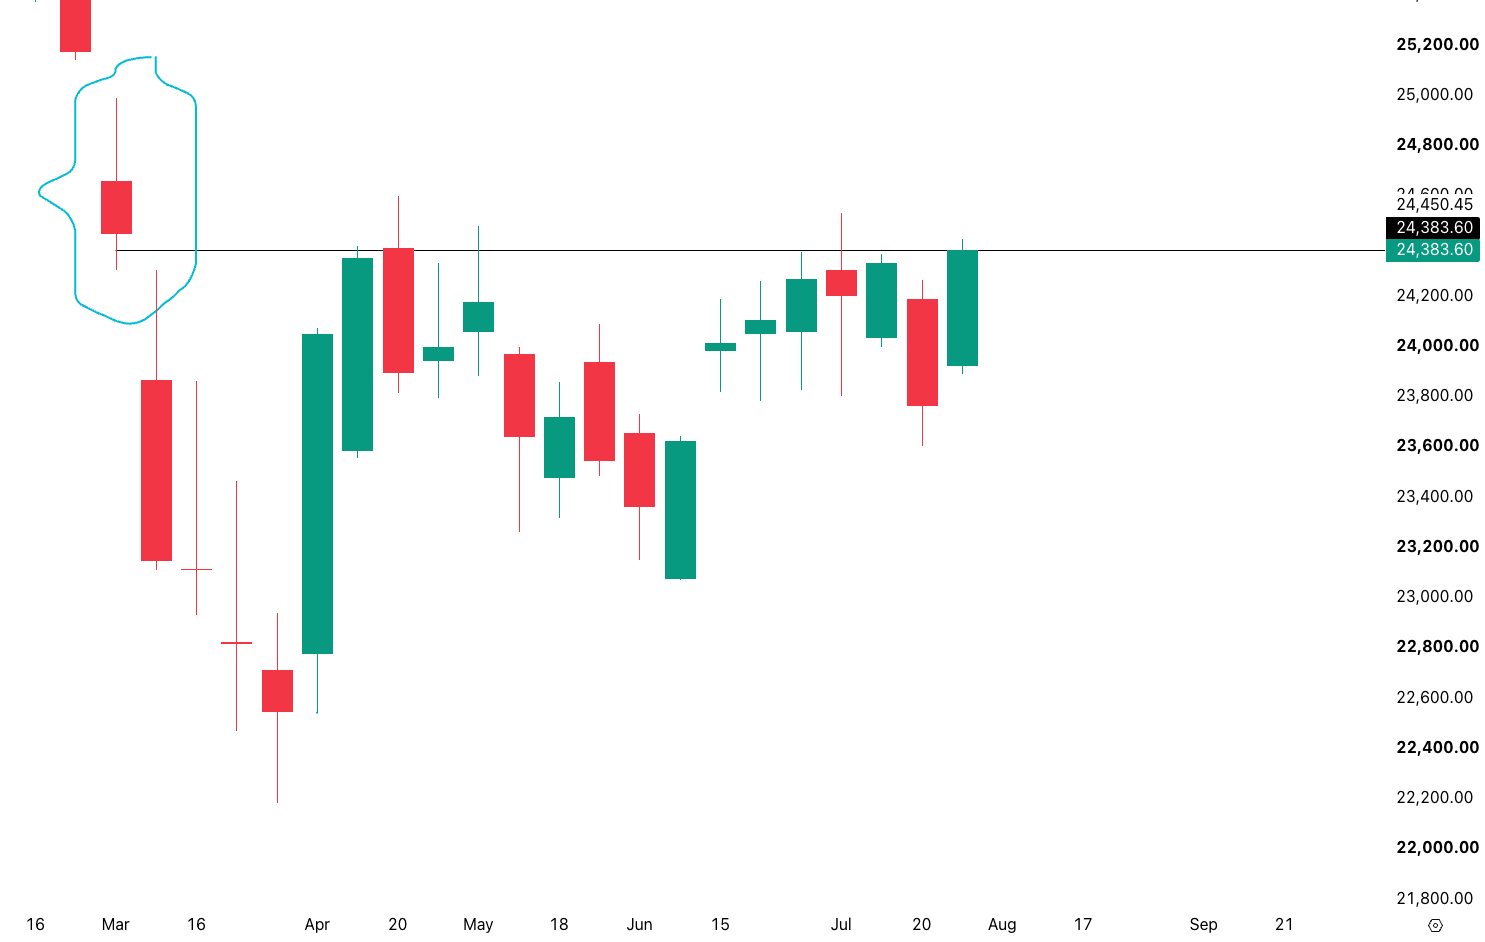
More importantly, Nifty has moved back above the 23,800 support zone it had lost last week. That breakdown now looks like a false move, with buyers stepping in quickly.
Going into next week, 24,600 remains the first major resistance to watch. On the downside, 23,800 once again becomes an important support, followed by the 23,200–23,000 zone if selling pressure returns.
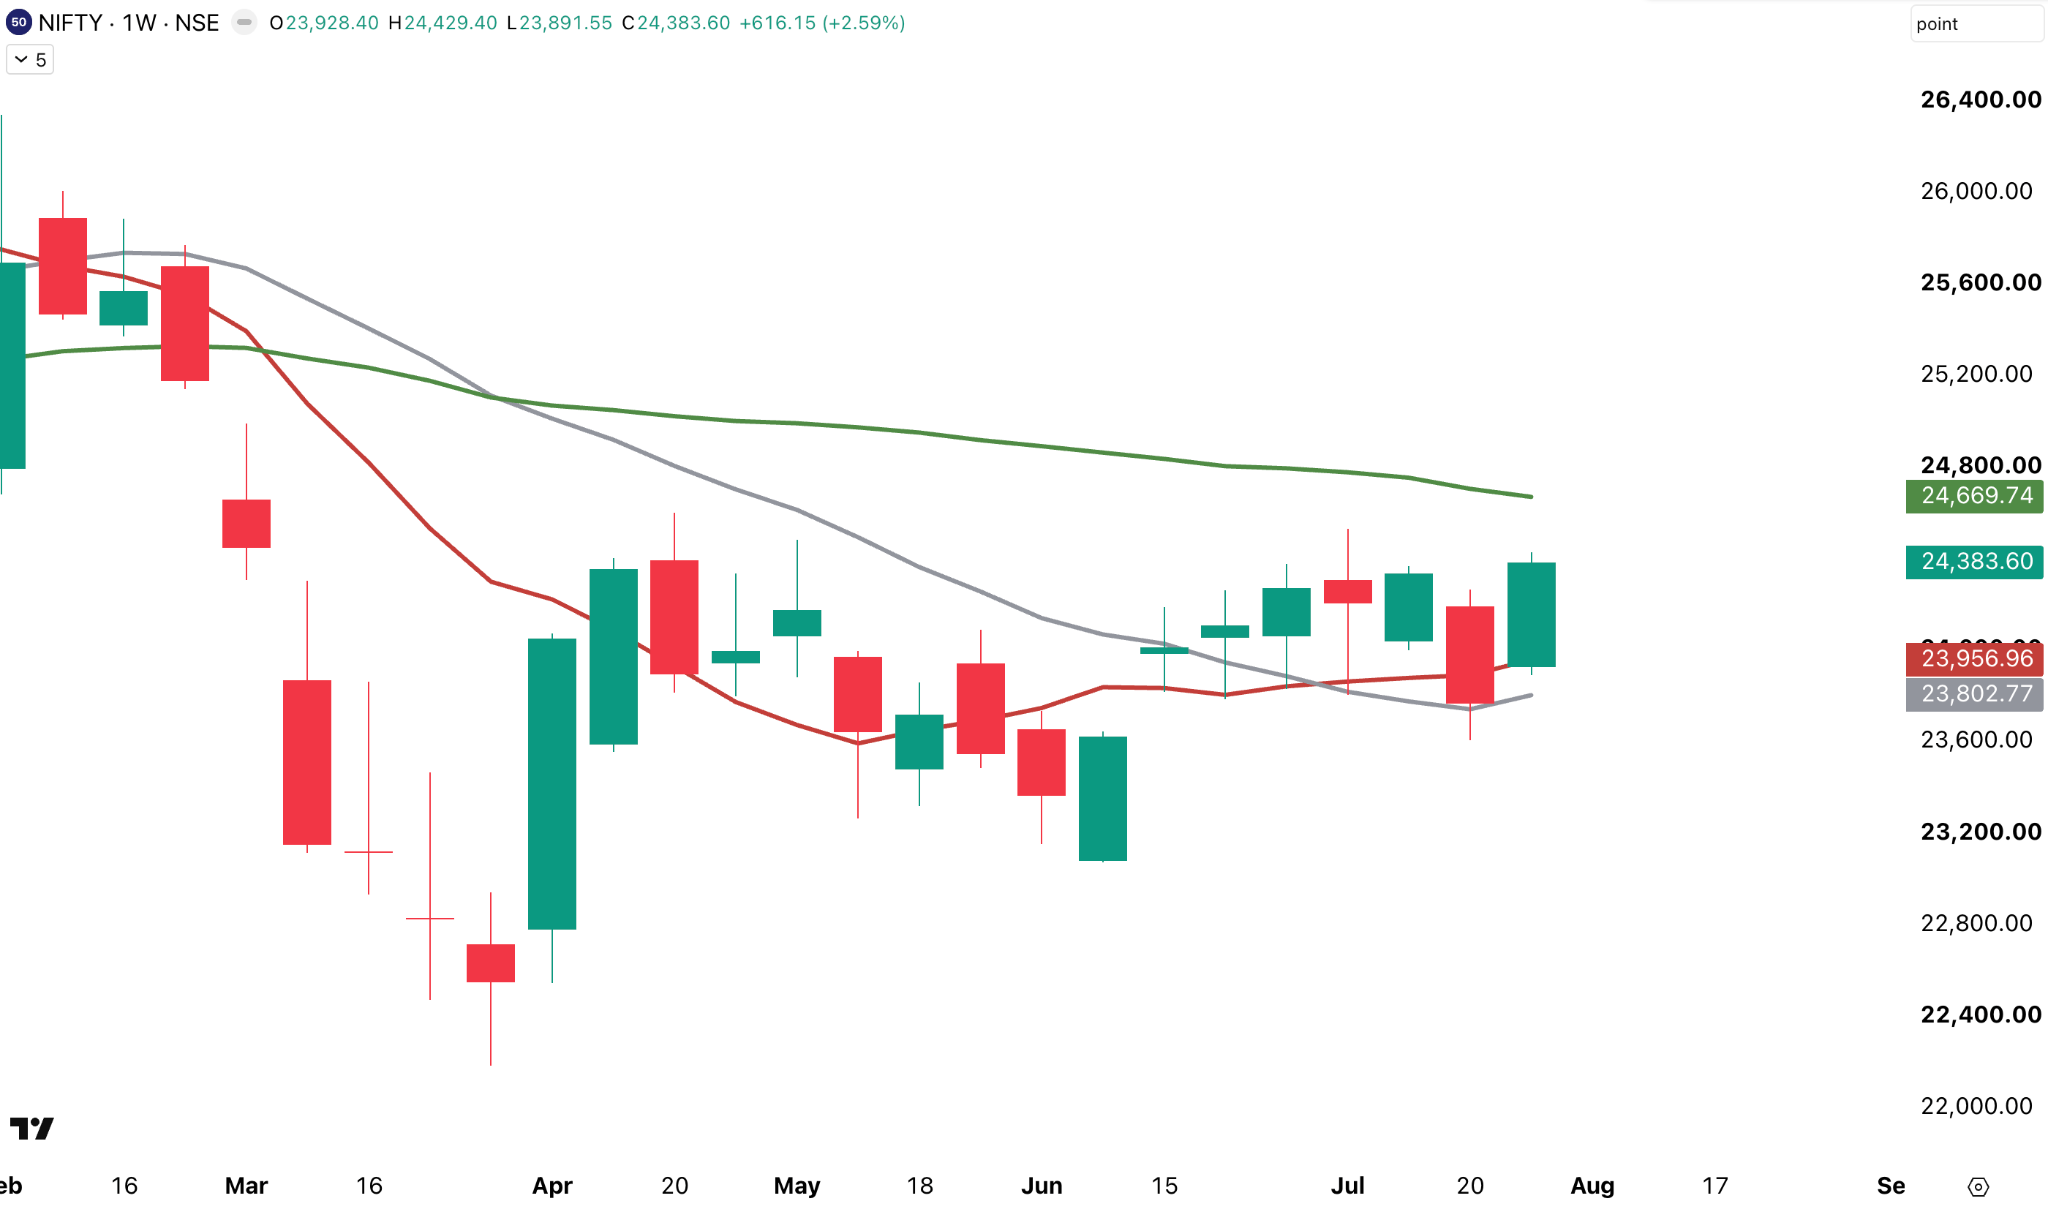
From a moving average perspective, the picture has improved. Nifty has reclaimed both the 10-week and 20-week moving averages after briefly slipping below them last week. The 10-week SMA has once again moved above the 20-week SMA — a positive sign for the short-term trend. The 40-week SMA near 24,700 continues to act as the key long-term resistance.
W31

W30

Volatility cooled off this week, with the weekly trading range narrowing from nearly 660 points last week to around 540 points. Monday was the quietest session at 120 points, followed by Tuesday at just 87 points. Thursday recorded the widest range at around 156 points. The 5-day average daily range declined further to 128 points from 173 points last week, sitting below the 10-day average of 150 points.
Daily
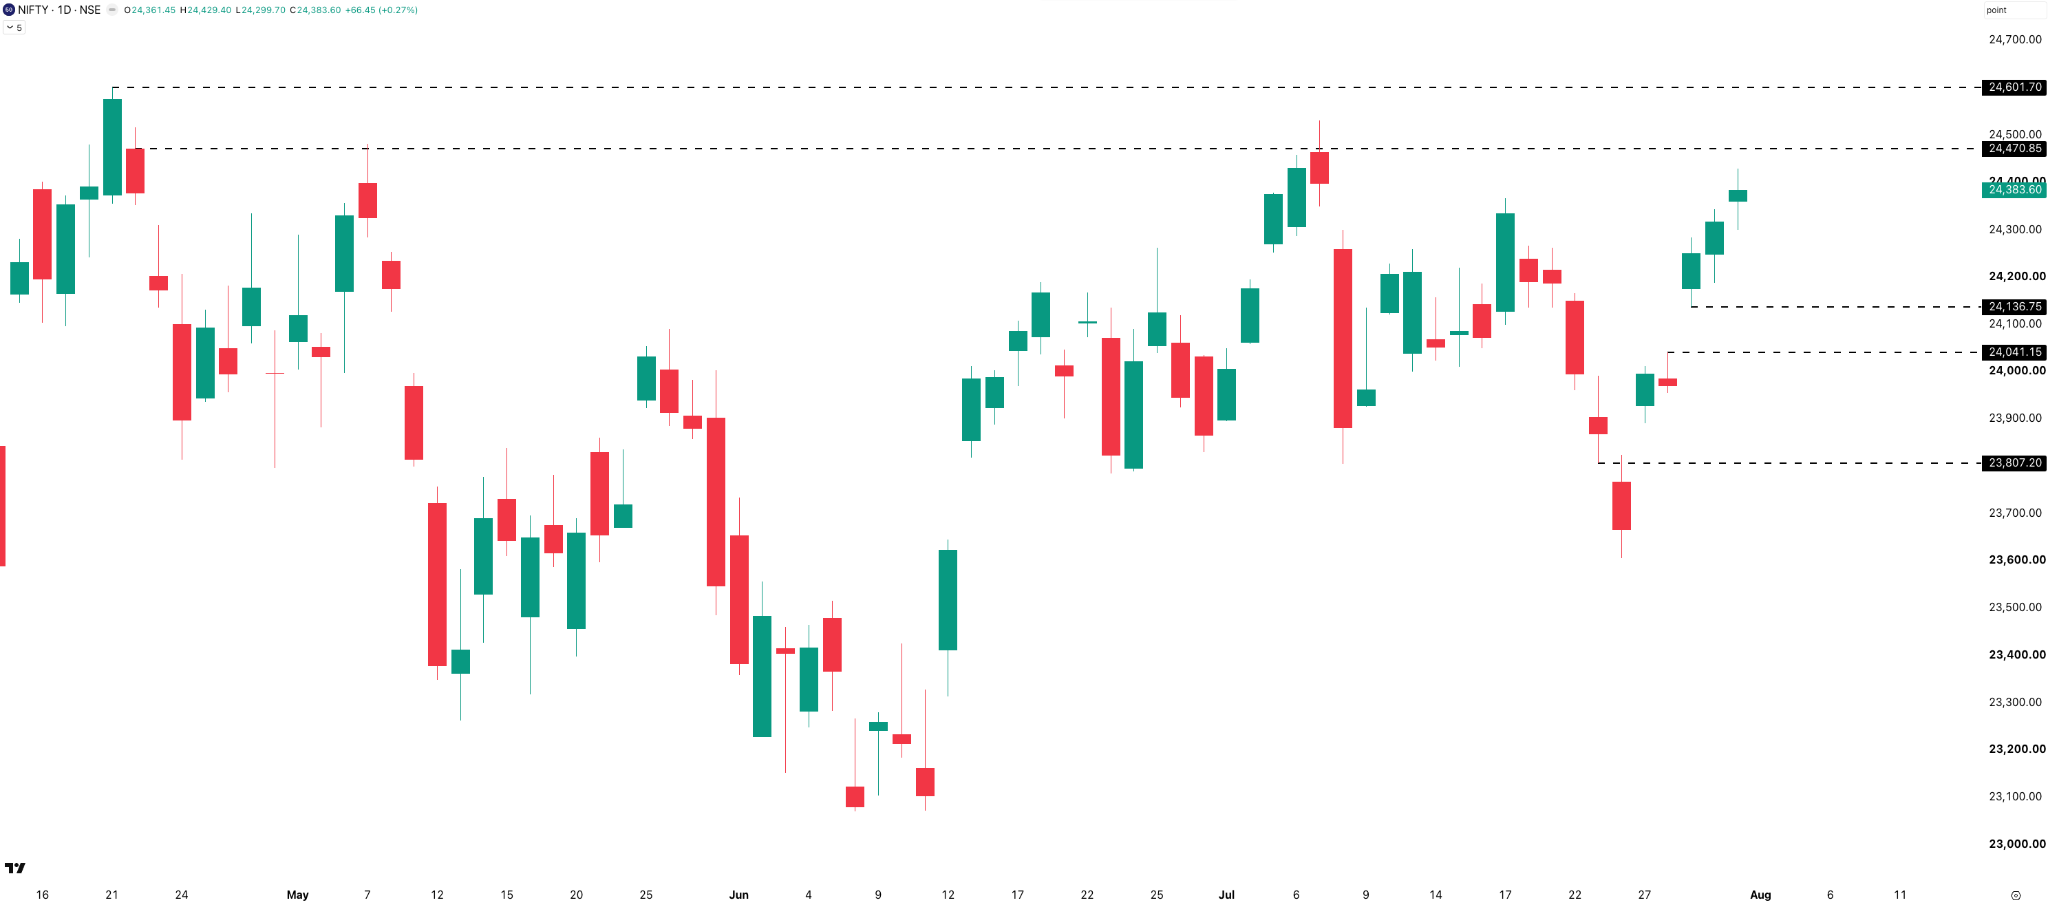
After five consecutive red candles last week, Nifty bounced back with four green closes out of five this week. The index opened with gap-ups on Monday, Wednesday, and Friday. Nifty reclaimed the 24,000 level on Monday itself and continued to build on those gains, closing the week at 24,384.
The next resistance comes in around 24,470, followed by the important 24,600 zone. On the downside, 24,150–24,200 becomes the first support to watch, followed by 24,000. A break below that could bring the 23,800 zone back into focus.
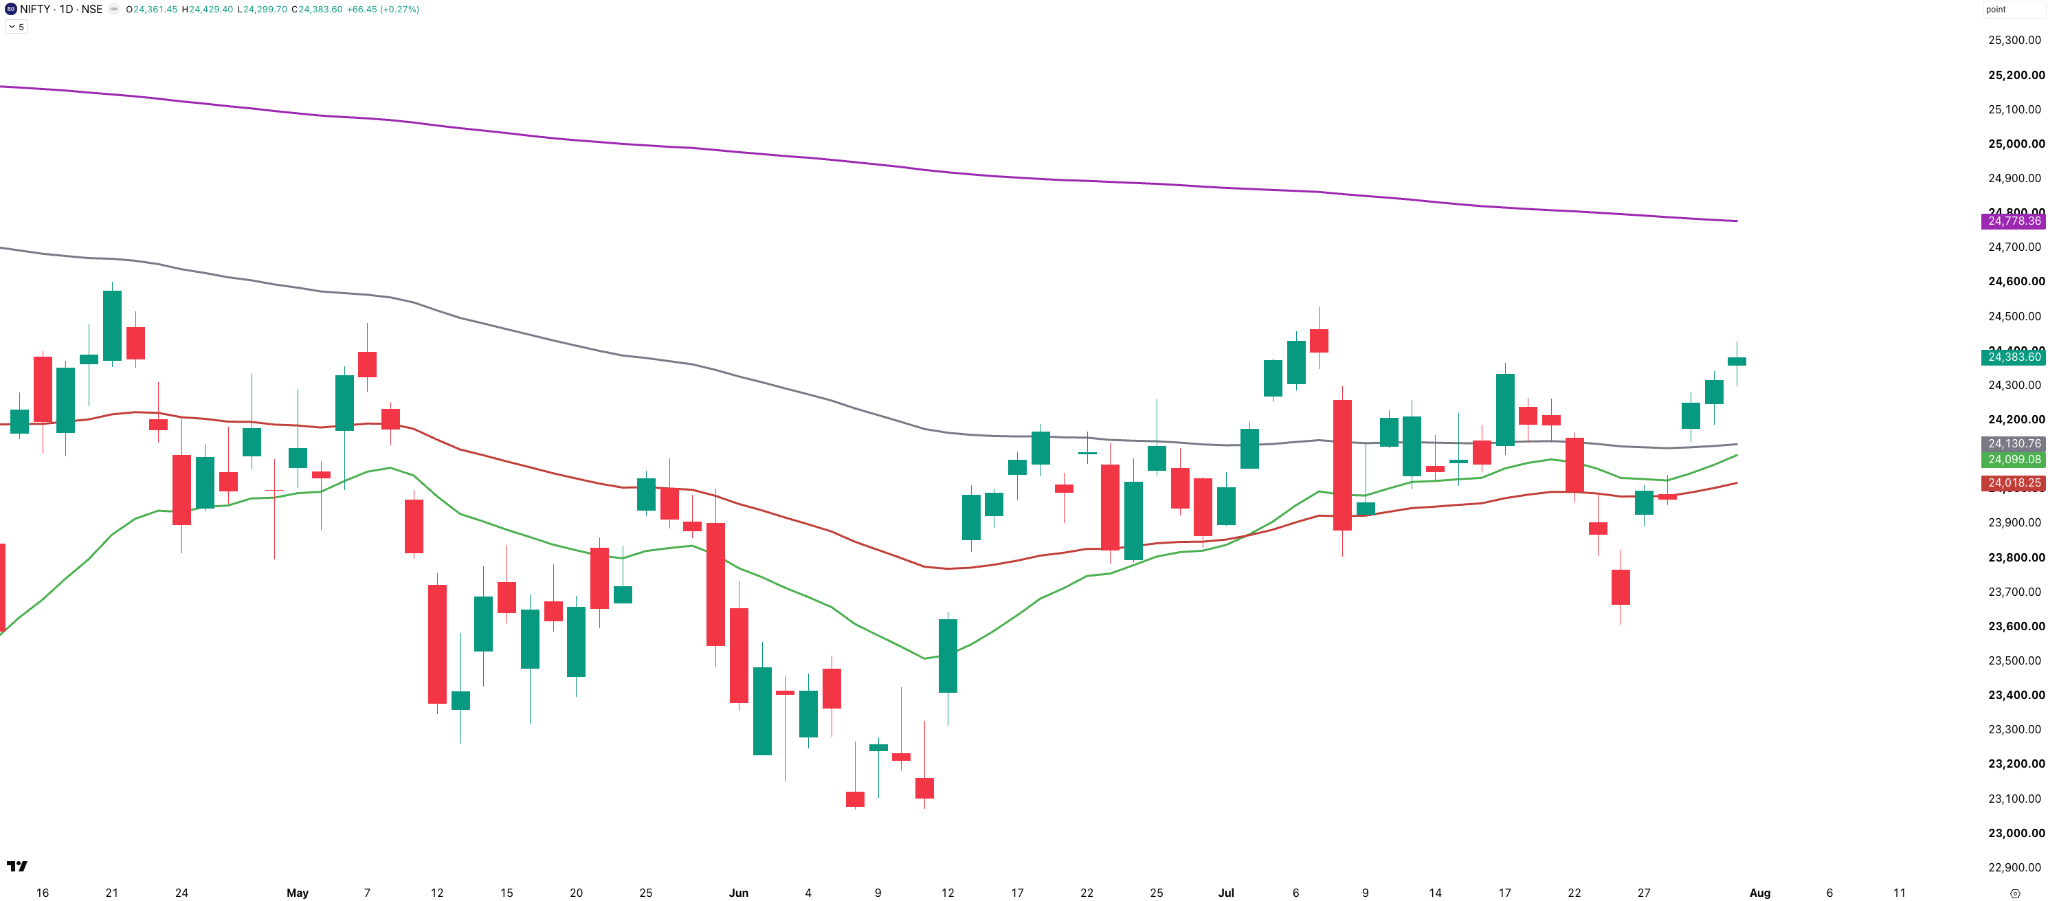
Nifty has now reclaimed the 21-day, 50-day, and 100-day moving averages, all clustered between 24,000 and 24,150. The next hurdle for the bulls is the 200-day moving average, currently placed around 24,780.
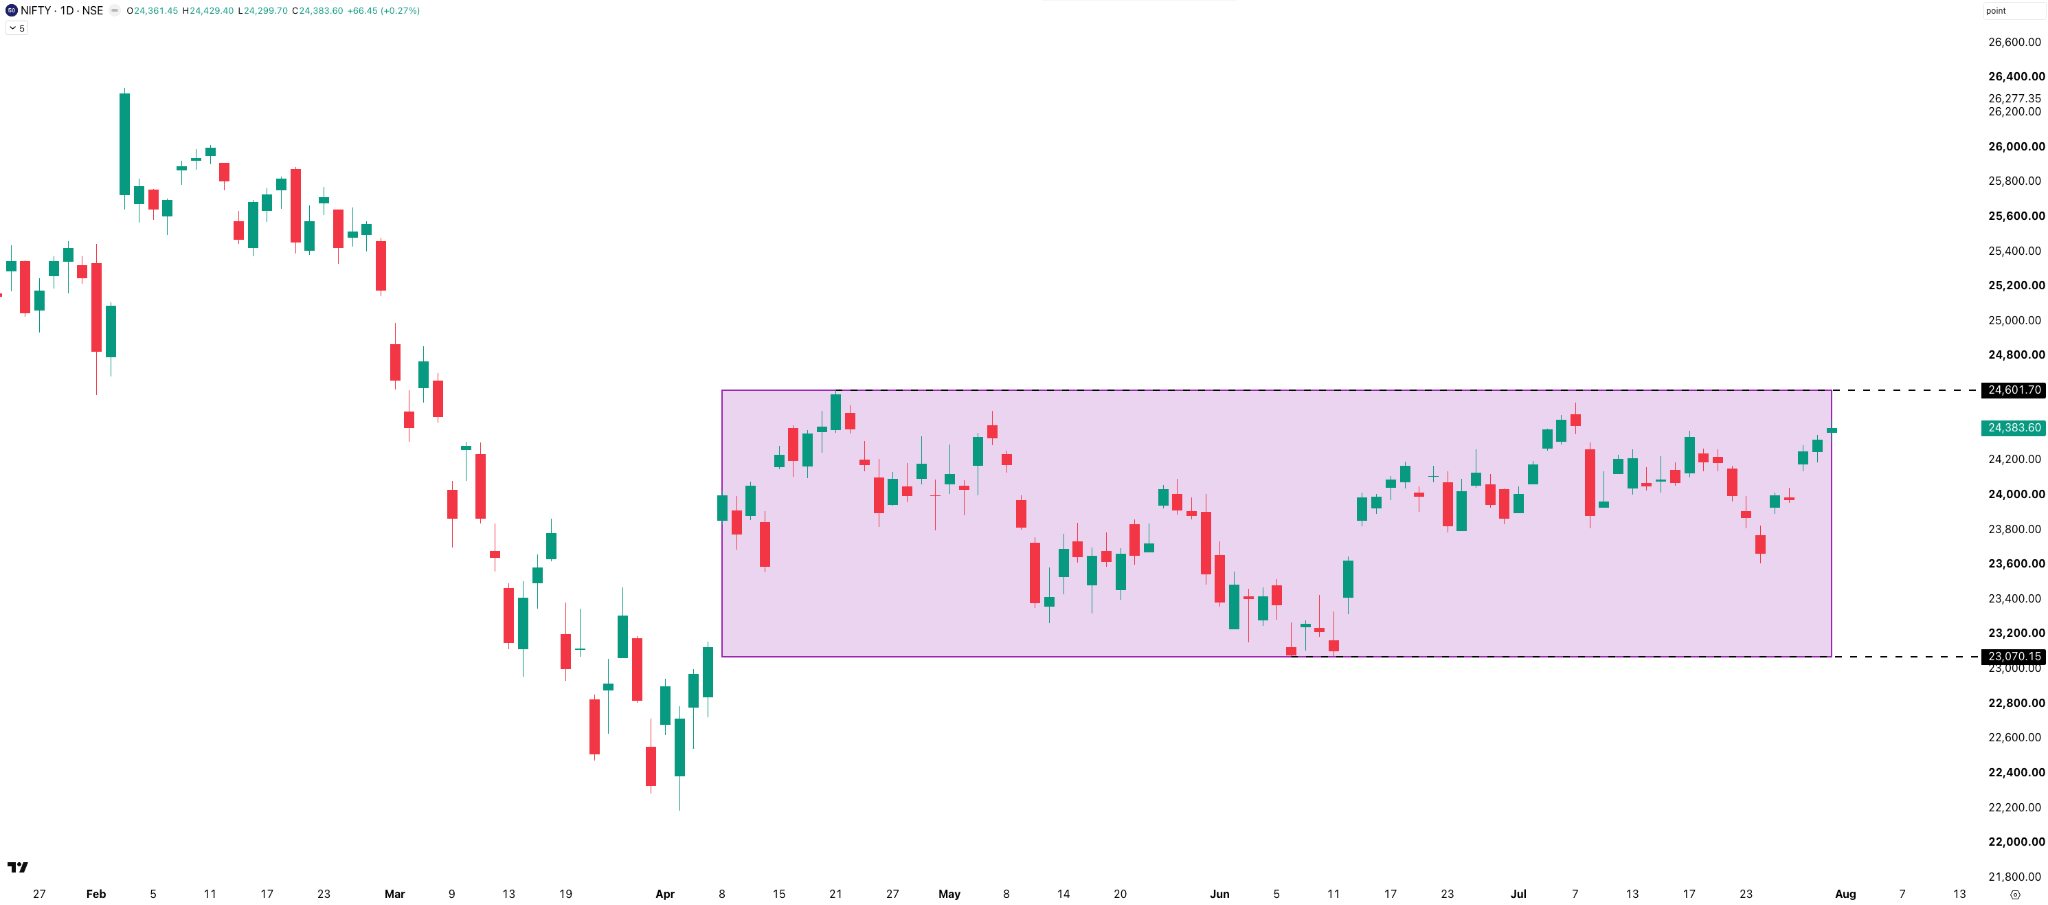
Following up on last week’s observation — yes, we’re still stuck in the same 1,500-point range. The good news is we’re now much closer to the upper end of the range than the lower end.
Hourly
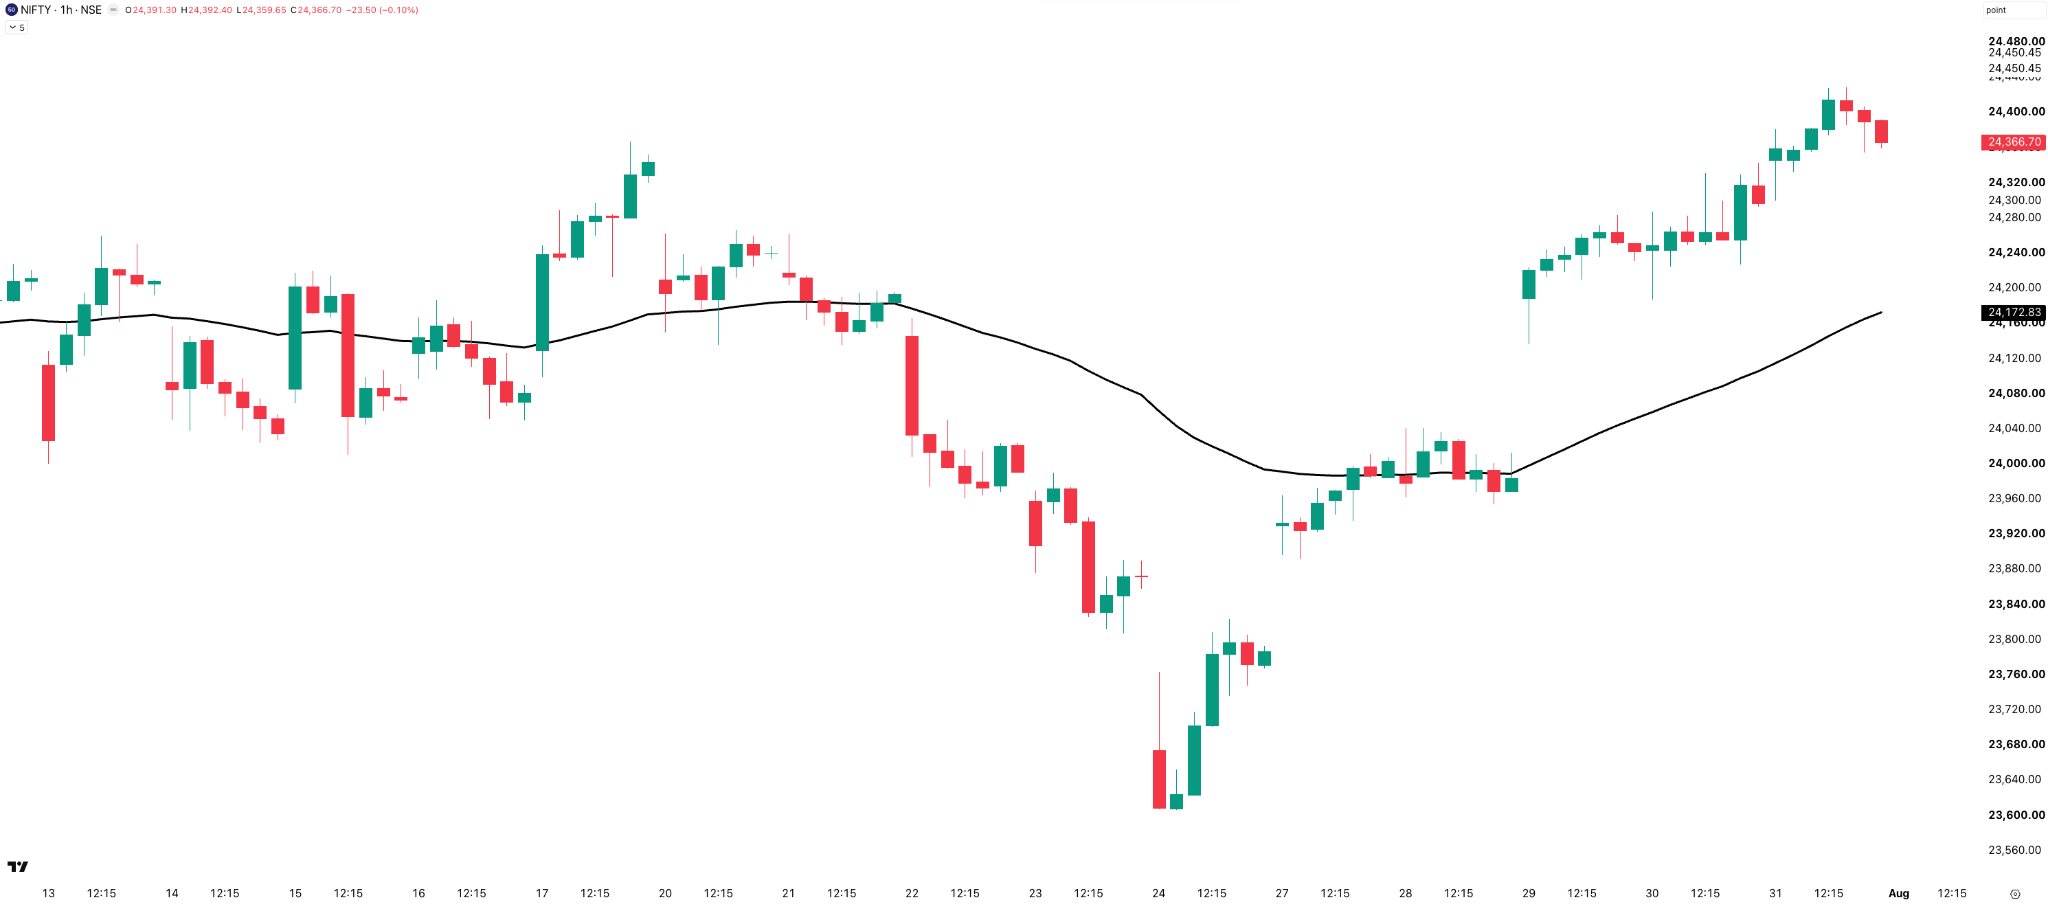
Nifty spent Monday and Tuesday chopping around the 50 EMA without any clear direction. The trend turned decisively bullish after Wednesday’s gap-up opening, with the index staying above the 50 EMA for the rest of the week. As long as Nifty continues to hold above the 50 EMA, the short-term momentum remains with the bulls.
Nifty Monthly Expiry — Tuesday, 28 July
Surprisingly calm. The ATM straddle opened below 100 points, and the index ended up trading in a range of just 87 points for the entire day. Selling a delta-neutral straddle with a premium of less than 100 points and expecting the market to move even less isn’t something you see very often — yet that’s exactly what happened.
Sensex Monthly Expiry — Thursday, 30 July
Whatever calmness we saw on the Nifty expiry was completely absent here. The ATM straddle opened at around 320 points, while the index ended up trading in a range of 566 points. And the real action came in the final few minutes — the 77,900 CE, which was trading around ₹1, spiked to nearly ₹50 before settling around ₹28 at the close.
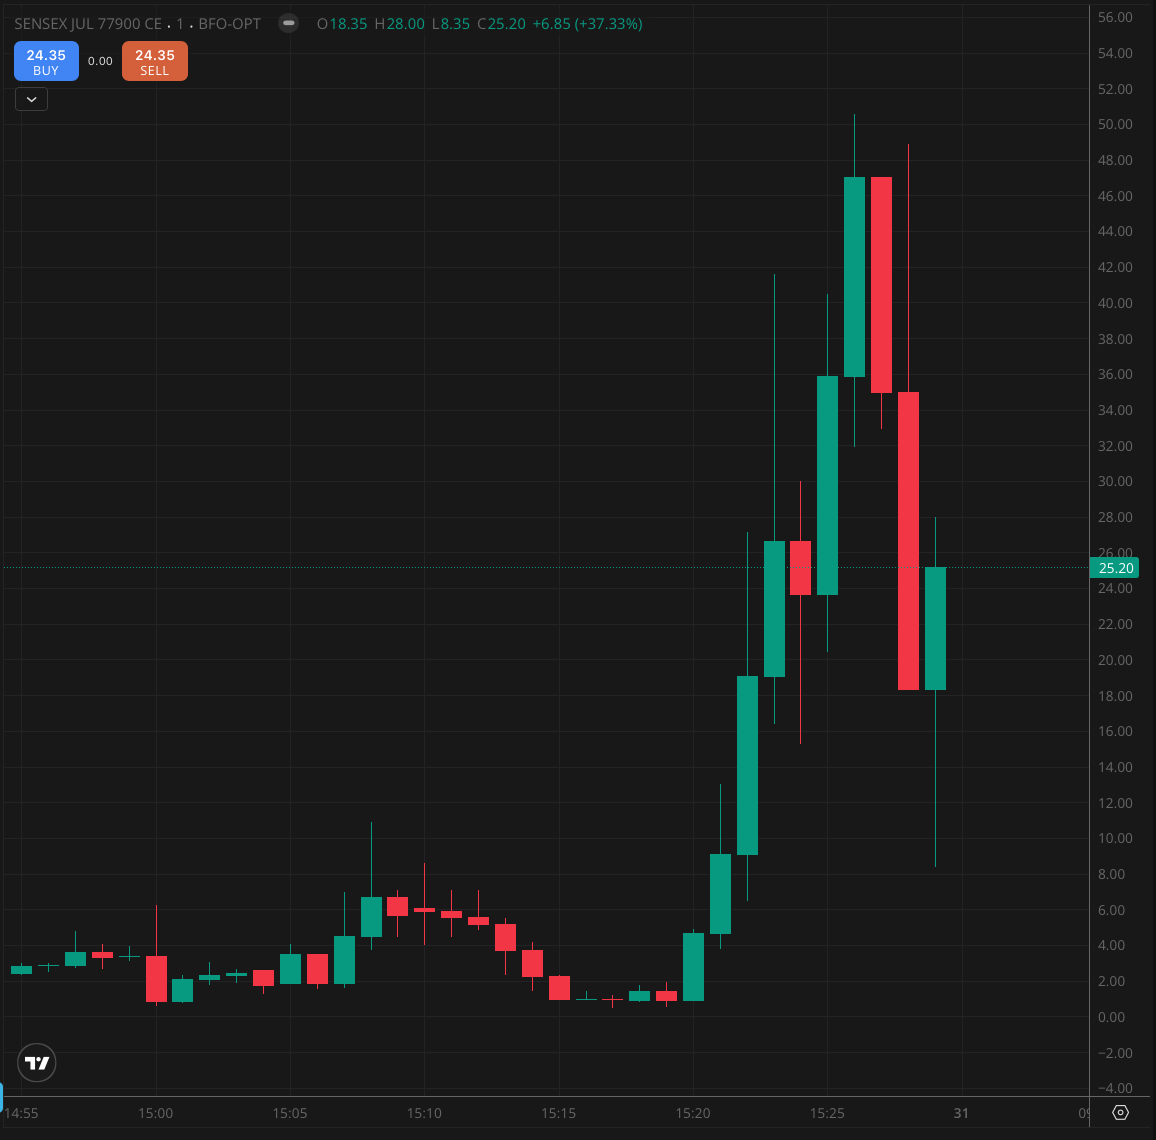
Wild moves in the last hour of expiry aren’t unusual. What made this different was that most of the action happened in the last 10 minutes. This is a classic example of gaming the VWAP-based closing price mechanism before it is replaced by the Closing Auction Session (CAS) from next week.
Personally, I plan to observe CAS for at least a week before sharing thoughts — we need some data. A dedicated video explaining how it has changed closing and its impact on expiry trading is on the way.
Nearly Two Years of Zero Returns
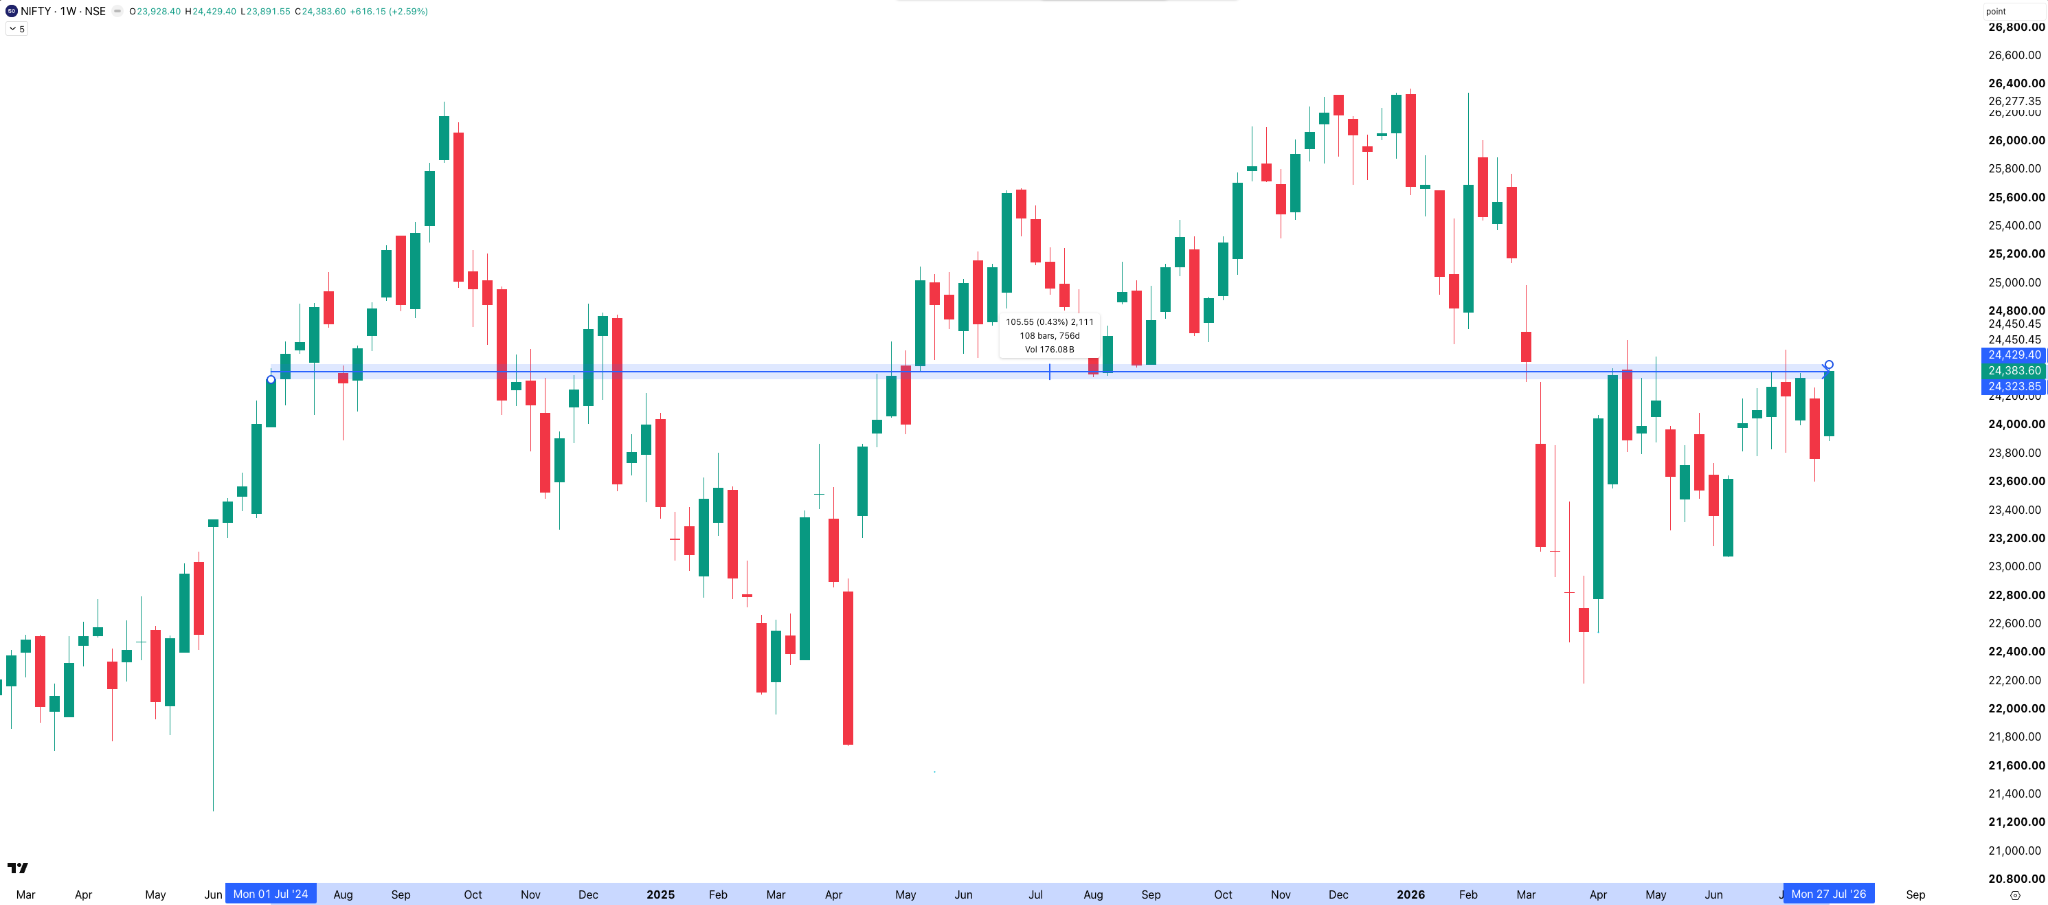
Before we wrap up the charts, here’s something interesting I saw on Nifty. As they say, if you keep staring at the charts, you will find something. Okay, that was a joke.
Here’s something interesting that emerged from staring at the charts. For almost two years now, Nifty has gone virtually nowhere. Despite all the rallies, corrections, and headlines, the index is trading at almost the same level it was around two years ago.
So the obvious question: what happens after two years of no returns?
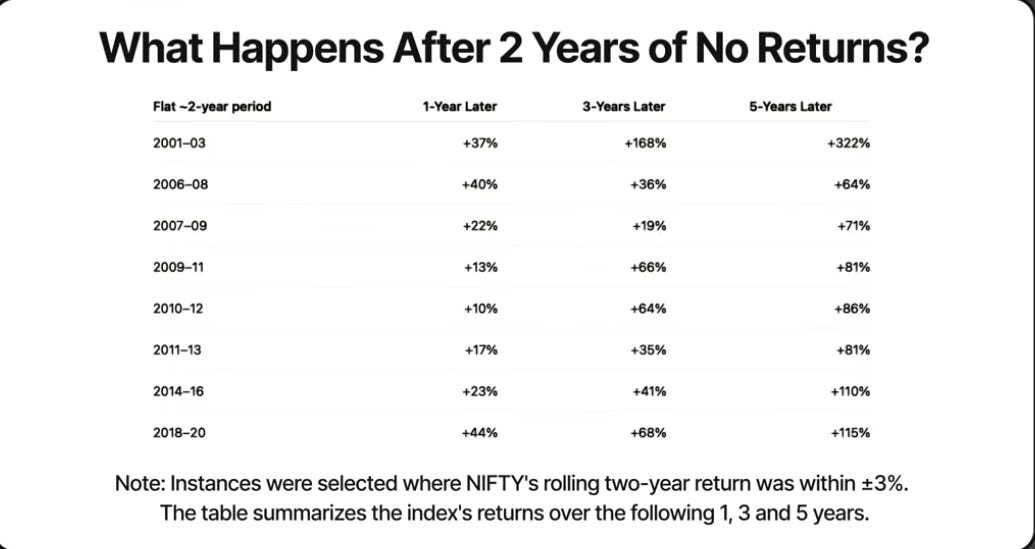
Looking back at history, these long periods of flat returns have been surprisingly rare. But what’s even more interesting is what happened after them. In every similar instance over the last 25 years — where Nifty’s rolling two-year return was within ±3% — the index delivered positive returns over the following one, three, and five years. Often very strong returns.
Past performance never guarantees the future. But it does suggest that long periods of consolidation have often been followed by meaningful trends. The only question now is whether this time will be any different. Hoping for history to repeat itself.
Section 2 — What to Expect in the Coming Week
All eyes will be on the 24,600 level. A decisive close above it could finally signal a breakout from the four-month range. On the downside, 24,000–24,150 is the first support zone, followed by 23,800. The short-term trend is bullish, but the real test for the bulls begins here.
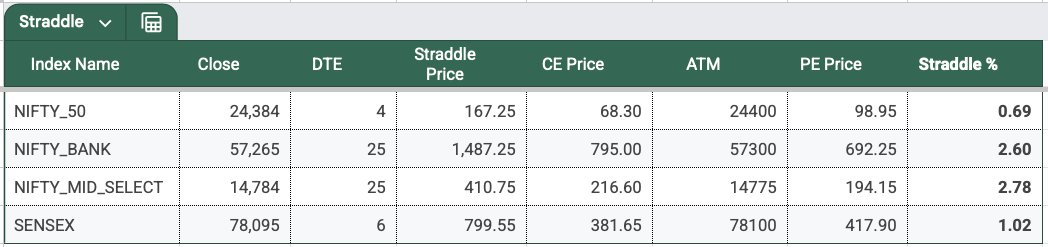
The Nifty ATM straddle is trading at around 167 points, implying an expected move of about 0.69% from the current level. That gives an expected range of approximately 24,217 on the downside and 24,551 on the upside for the upcoming weekly expiry on Tuesday, 4 August .
India VIX
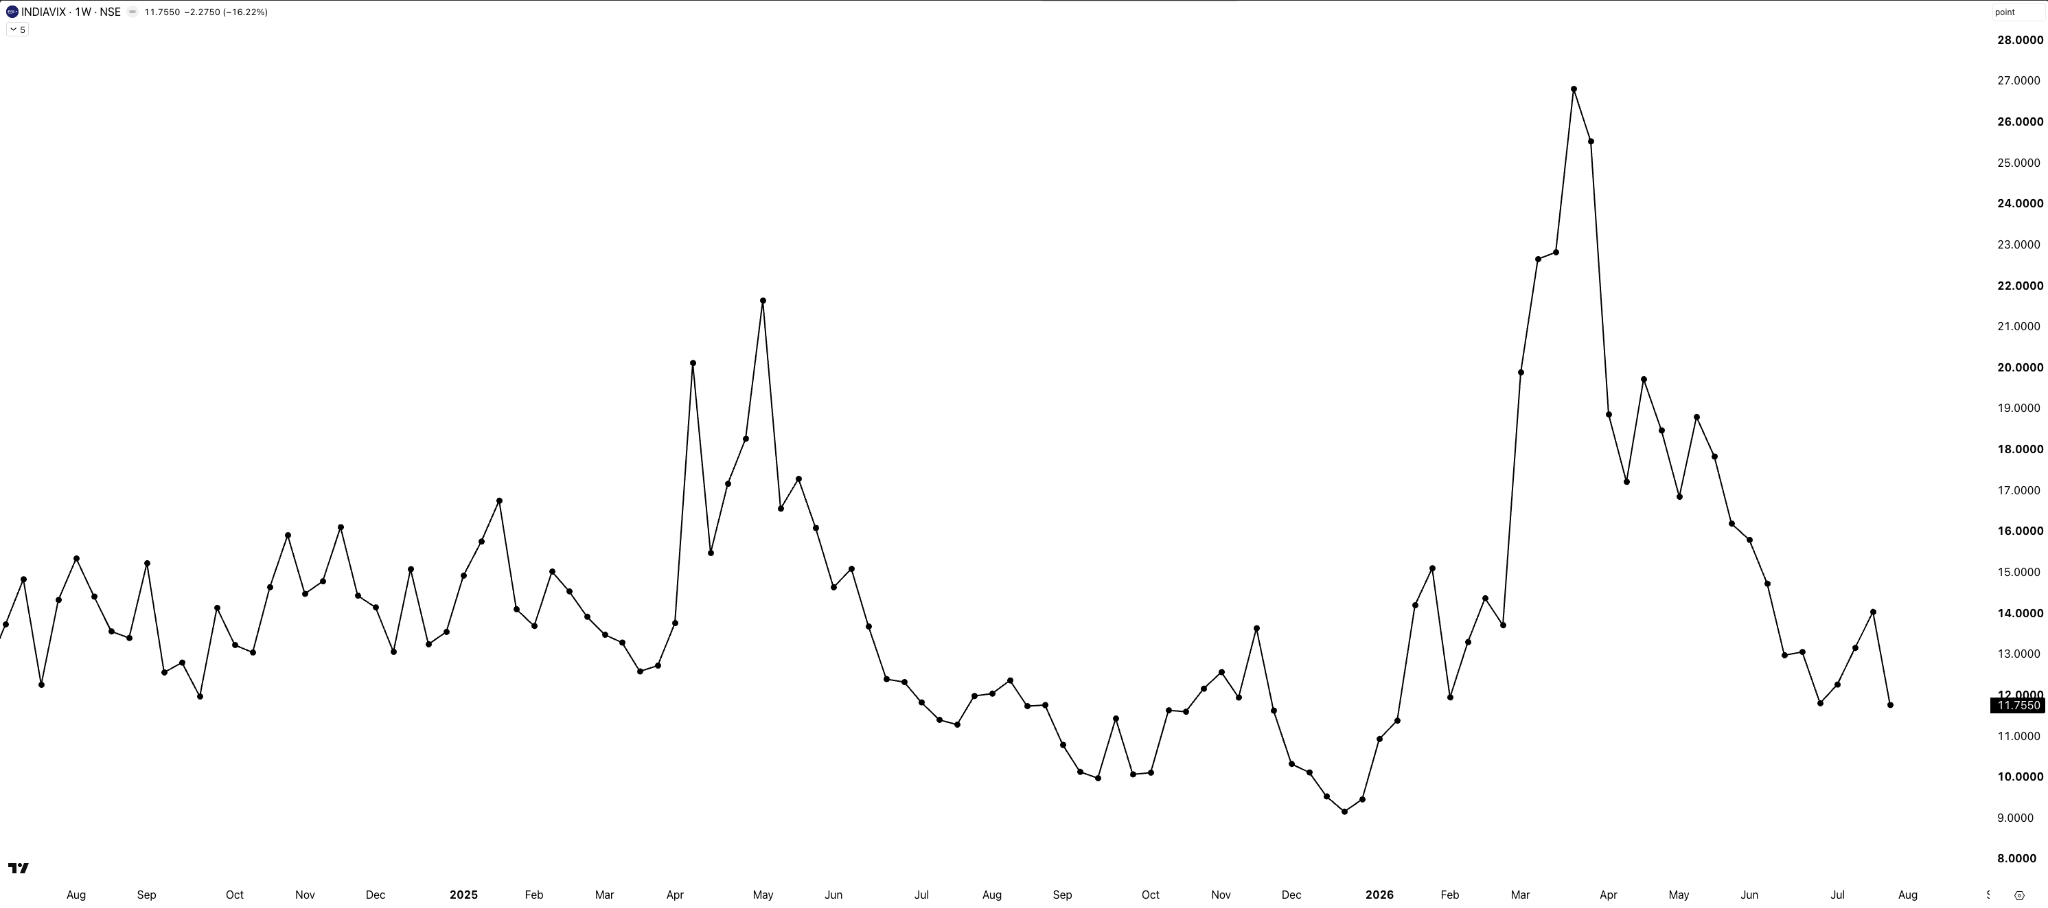
Remember how VIX had been moving higher for three straight weeks? This week it did a complete U-turn — dropping 16% to close at 11.76, indicating that traders and speculators are once again expecting a relatively quiet market.
Sectoral Performance
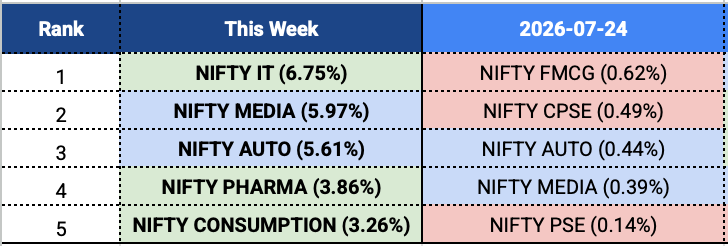
Nifty sector view: Leadership changed completely this week. After defensive sectors like FMCG and CPSE topped the charts in last week’s muted session, this week the rally was much broader, with cyclicals taking charge. Nifty IT emerged as the best-performing sector, gaining 6.75%, followed by Media at 5.97% and Auto at 5.61%. Pharma and Consumption also delivered strong gains of 3.86% and 3.26% respectively. Auto is the only sector that featured in the top five for two consecutive weeks, while IT made a strong comeback. Overall, sectoral participation was much broader than a week ago — an encouraging sign.
M 07
W30

W29

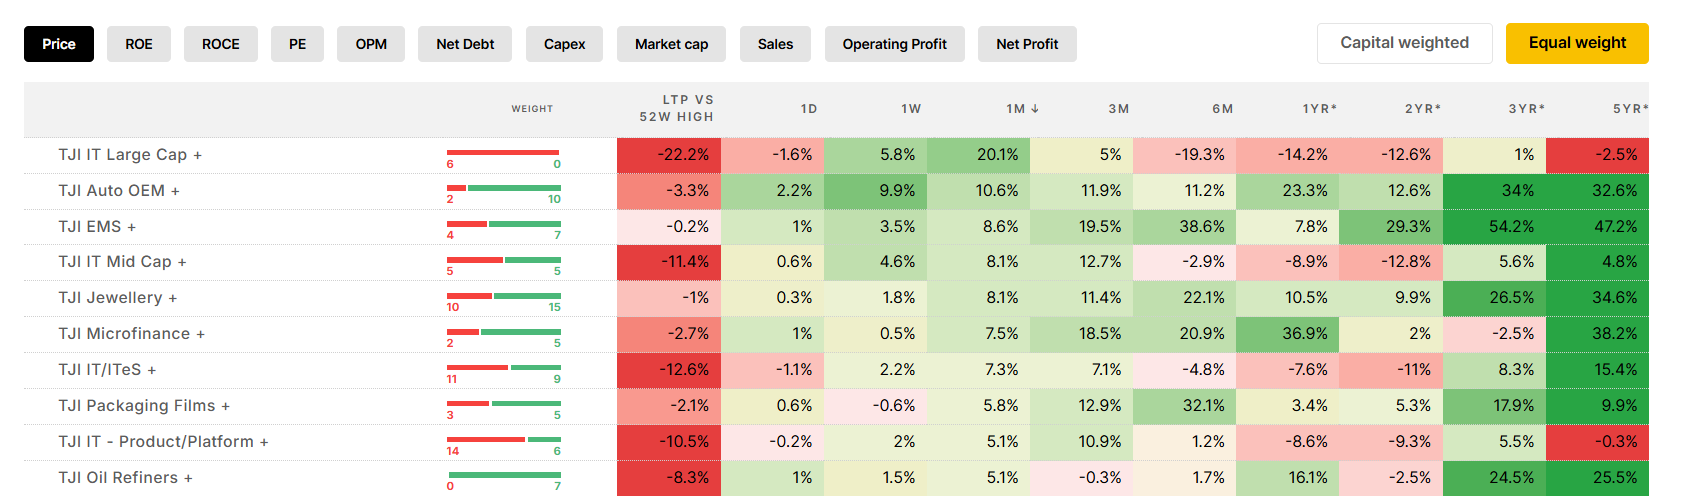
Tijori monthly view (July):
- IT Large Cap — up a striking 20.1% for the month, with mid-cap IT close behind at 8.1%. But look across to six months: Large Cap IT is still down about 19% and sits 22% below its year’s high. The Nifty IT index actually touched a 52-week low on 1 July before rebounding, helped by a reasonable June-quarter earnings season and rotation away from the global AI and chip selloff.
- Auto OEM — up 10.6% for the month, green all the way out to five years. Riding record June sales — the best June the industry has ever had — and a strong set of first-quarter results.
- EMS (Electronics Manufacturing Services) — up 8.6%, something highlighted in earlier editions, riding the manufacturing push from the Centre.
- Jewellery — up 8.1%, running on resilient wedding-season demand, firm gold prices, and the slow migration of buyers from corner goldsmiths to branded chains.
As always — if any of these baskets interest you, double-click, and you will find some real gems and consistent performers.
Commodities
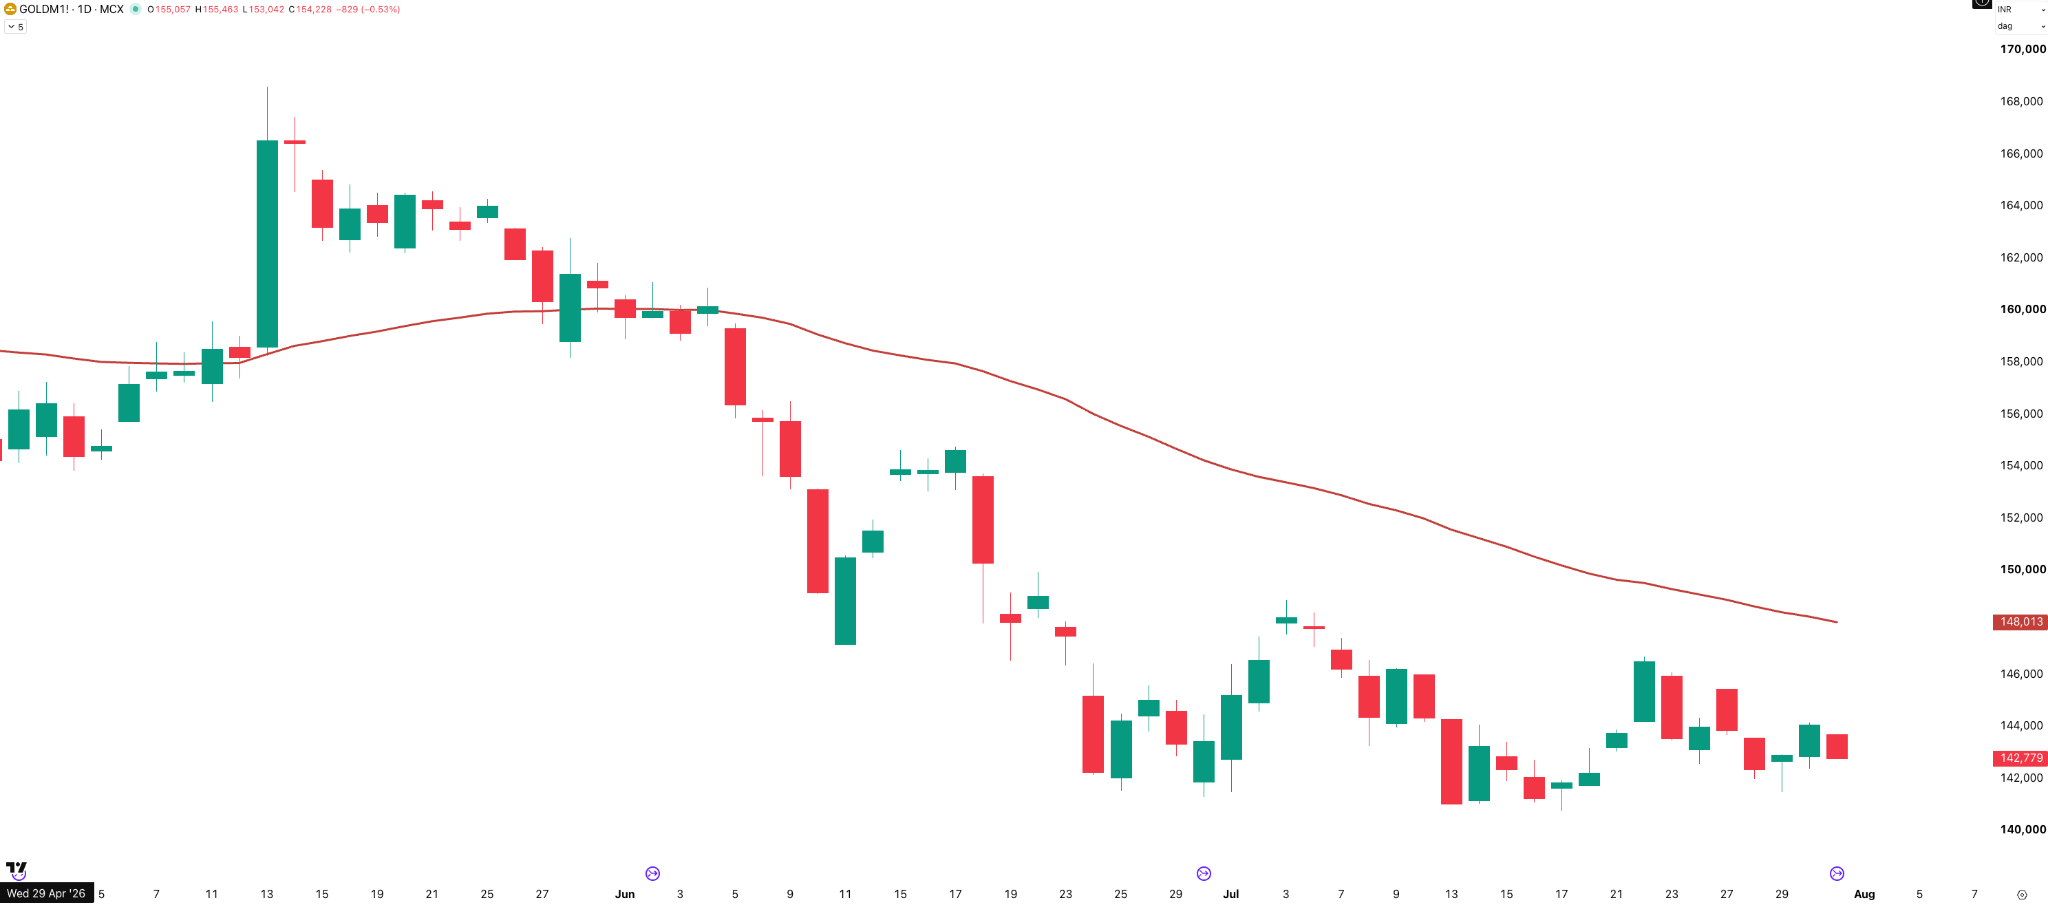
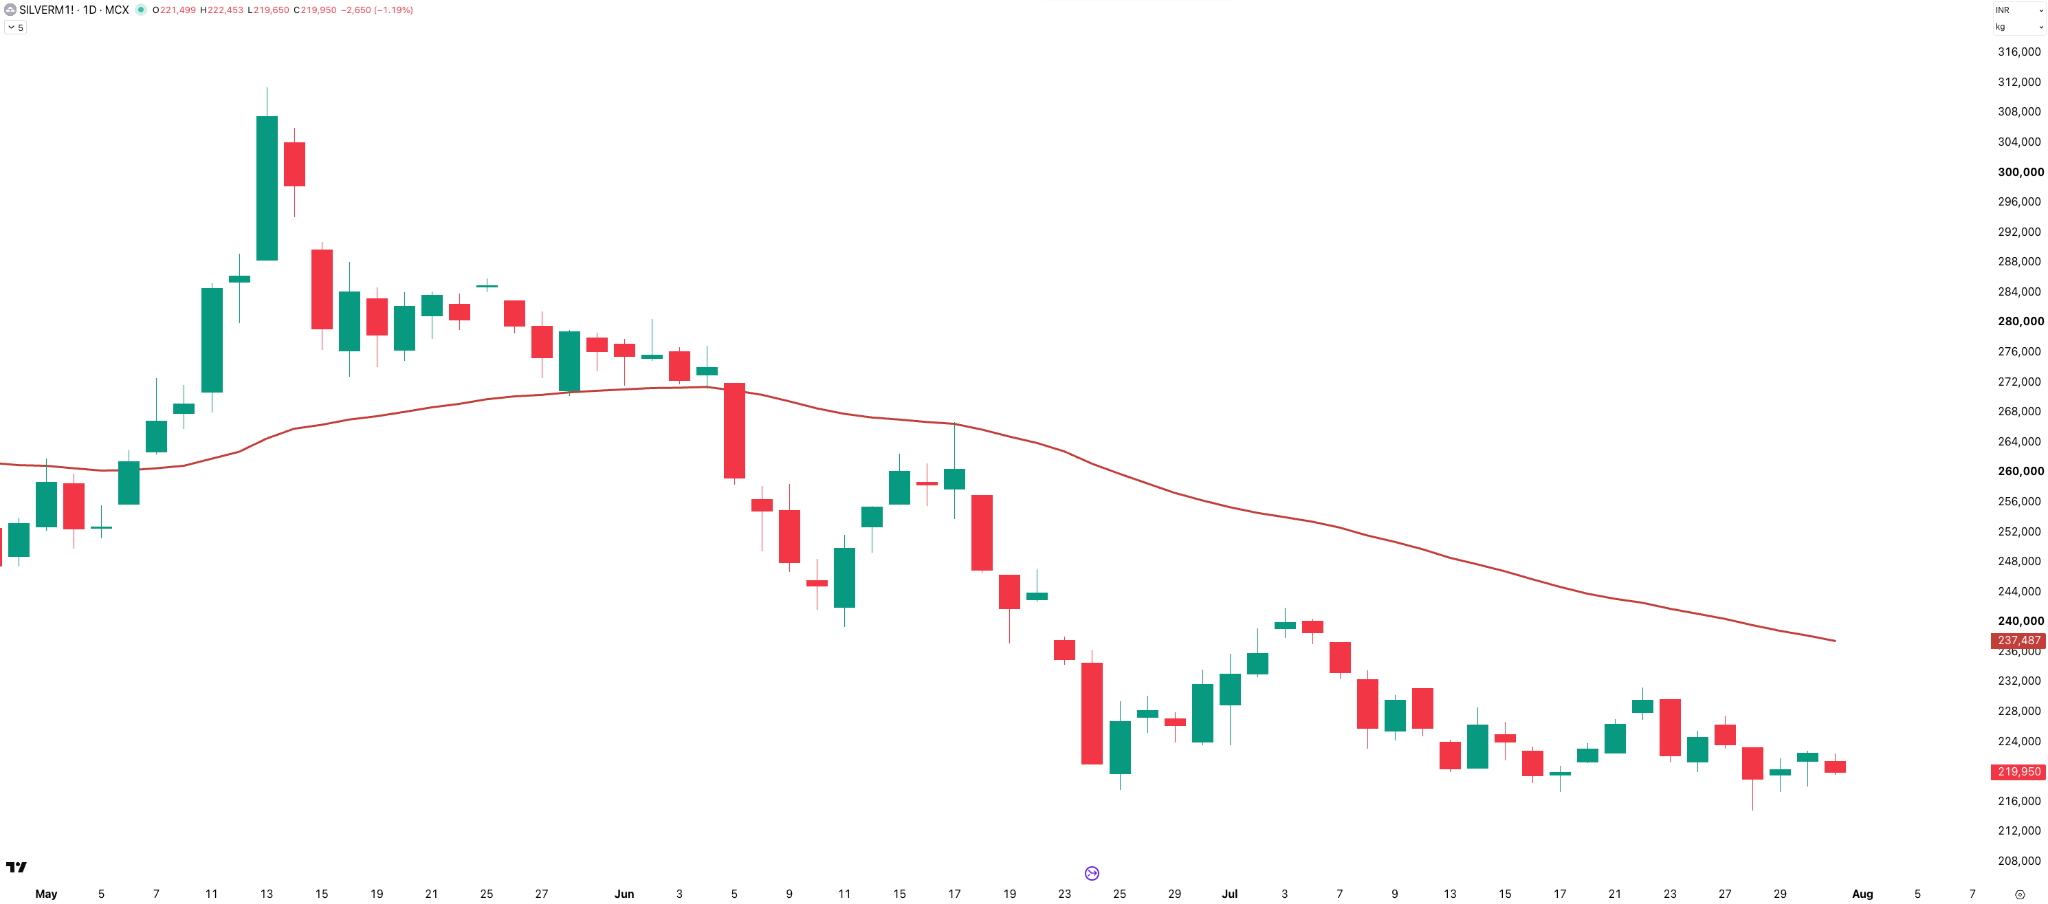
Both Gold and Silver had another subdued week. Gold continued to trade below its 50-day moving average, stuck in a narrow range after the sharp correction seen over the past few months. Silver also struggled to gain momentum, with every bounce facing selling pressure near the 50-day moving average.
Both have now been trading below their respective 50-day EMAs for over 8 weeks — the trend remains weak.
Summary
The market has bounced back strongly after last week’s weakness, but the bigger picture hasn’t changed much. Nifty continues to trade within the same 1,500-point range that has contained the market for almost four months. And if you zoom out even further, the index has delivered almost no returns over the last two years, despite all the rallies, corrections, and headlines in between.
The short-term trend and sentiment have certainly improved, but the bigger question remains the same: will this finally be the breakout, or just another move within the range? That’s what we’ll be watching in the coming week.
What Caught My Attention This Week
Read: Since the South Korean market is all over the news, it’s worth understanding why. A Straits Times piece on why the Korean stock market has become more volatile than Bitcoin. The gist: two companies — Samsung and SK Hynix — now make up more than half the index, so a fund tracking the market has become one big bet on AI. Volatility has topped 60%. When a whole market rests on just two names, what do you expect? But do read — there’s more to it. Read it here
Watch: With Christopher Nolan’s Odyssey now in theatres, here’s a five-minute TED-Ed animation that explains what the story is actually about. Homer’s epic runs into 24 books — being reduced to a 5-minute video. Cannot get more ironic. But who knows — it might be the very thing that makes you watch the film. Everything you need to know to read Homer’s “Odyssey” — TED-Ed
Events to Factor In
It’s the first week of a new month — and the first week that the Closing Auction Session (CAS) will be used to determine the closing price instead of the VWAP-based mechanism. It’ll be interesting to see how the new system behaves in live markets.
The biggest event on the calendar is the RBI monetary policy decision , scheduled for Wednesday, 5 August, at 10:00 AM . All eyes will be on the decision and commentary for cues on the market’s next move.
Apart from that, it’s a relatively quiet week on the domestic macro front with no other major scheduled events.
If you find this series useful, don’t forget to subscribe to the channel — and do share it with your friends.
Until then — stay curious, stay steady, and enjoy your weekend.