Hello and welcome to the Weekly Market Metrics. I’m Sandeep Rao, and we’re in Week 32 of 2026.
There’s that old phrase, “no rest for the wicked.” And lately I feel like we traders and active investors are the devils it’s talking about, because the market simply won’t let us be at peace.
On one hand, the Hormuz situation is still in limbo.
But closer to home, the bigger story is the new CAS, the Closing Auction Session, that we spoke about last week. It seems to have created some real headaches, especially for F&O traders.
As a mechanism, CAS is conceptually the better way to close the day.
But in this interim phase, it appears to be distorting F&O pricing, and that’s added a fresh layer of uncertainty for anyone trading options. I will talk about it more later in the newsletter.
Meanwhile, over to the markets, they actually had a decent week, with the Nifty closing just below 24,600.
How the Markets Performed (Section One)

Starting with the headline indices, it was another positive week for the markets, although the gains were more measured compared to last week.
NIFTY 50 gained 0.8%, while the broader market once again outperformed. MICROCAP 250 led the pack with a gain of 3.5%, followed by SMALLCAP 250 at 2.4%, NEXT 50 at 1.4%, and MIDCAP 150 at 1.0%.
Looking beyond the week, the trend remains constructive.
Over the last one month, three months, and six months, all the broader market indices continue to outperform the NIFTY 50, with MICROCAP 250 remaining the strongest performer across all three time frames. NIFTY 50, meanwhile, continues to lag the broader market.
Looking at the broader indices we track in Weekly Market Metrics, the picture remains largely unchanged.

Over the past week, NIFTY, BANKNIFTY, MID SELECT, and SENSEX all ended higher, with gains ranging between 0.5% and 0.8%.
Looking beyond the week, the 3-month trend remains positive across all four indices, with BANKNIFTY leading the way at 6.5%, followed by SENSEX and NIFTY.
The 6-month and year-to-date picture, however, is still mixed. MID SELECT continues to be the only index in positive territory over both time frames, while NIFTY, BANKNIFTY, and SENSEX are still in the red, although their losses have narrowed over the past couple of weeks.
Year-to-Date Performance
Looking at the year-to-date performance, the broader market continues to stay well ahead of the NIFTY 50.
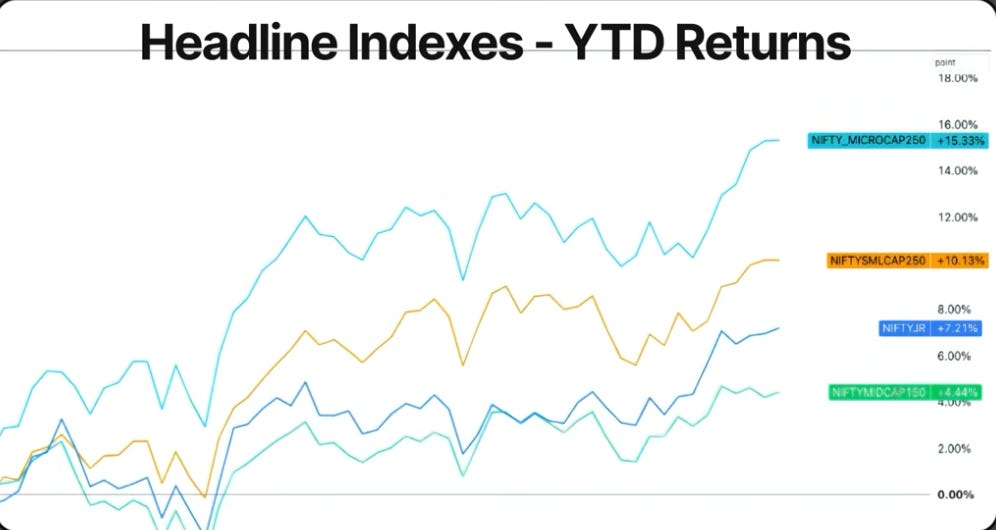
MICROCAP 250 has extended its lead and is now up over 15% for the year, followed by SMALLCAP 250 at 10%. NEXT 50 has also strengthened further and is now up more than 7%, while MIDCAP 150 has gained around 4.5%.
NIFTY 50, on the other hand, is still down about 6% for the year. While the gap has narrowed over the past couple of weeks, the broader market continues to outperform by a comfortable margin.
NIFTY - Weekly
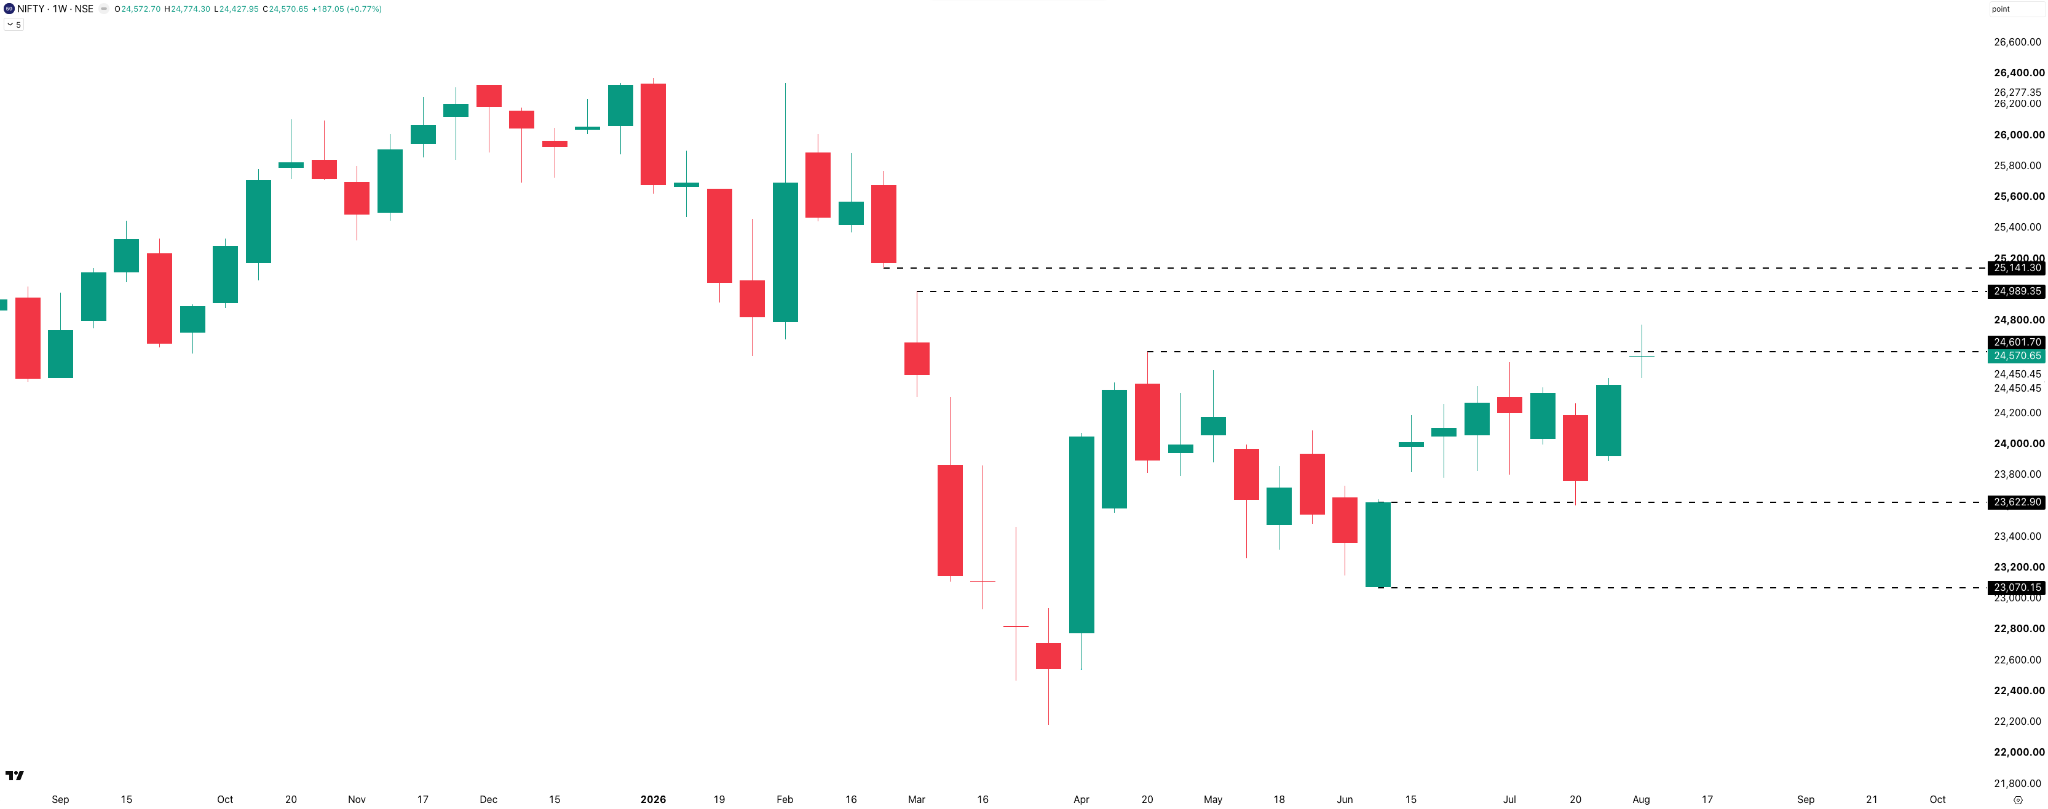
Moving on to the weekly chart, NIFTY continued its uptrend for the second consecutive week, gaining 0.8% and closing at 24,571.
During the week, the index briefly traded above the 24,600 resistance, but couldn’t hold those gains into the close. Even so, this was NIFTY’s highest weekly close in 21 weeks, continuing the recovery from the March-April correction.
The 24,600–24,900 zone now remains the key resistance area. A move above this zone could strengthen the uptrend, while a pullback may find support around recent breakout levels.
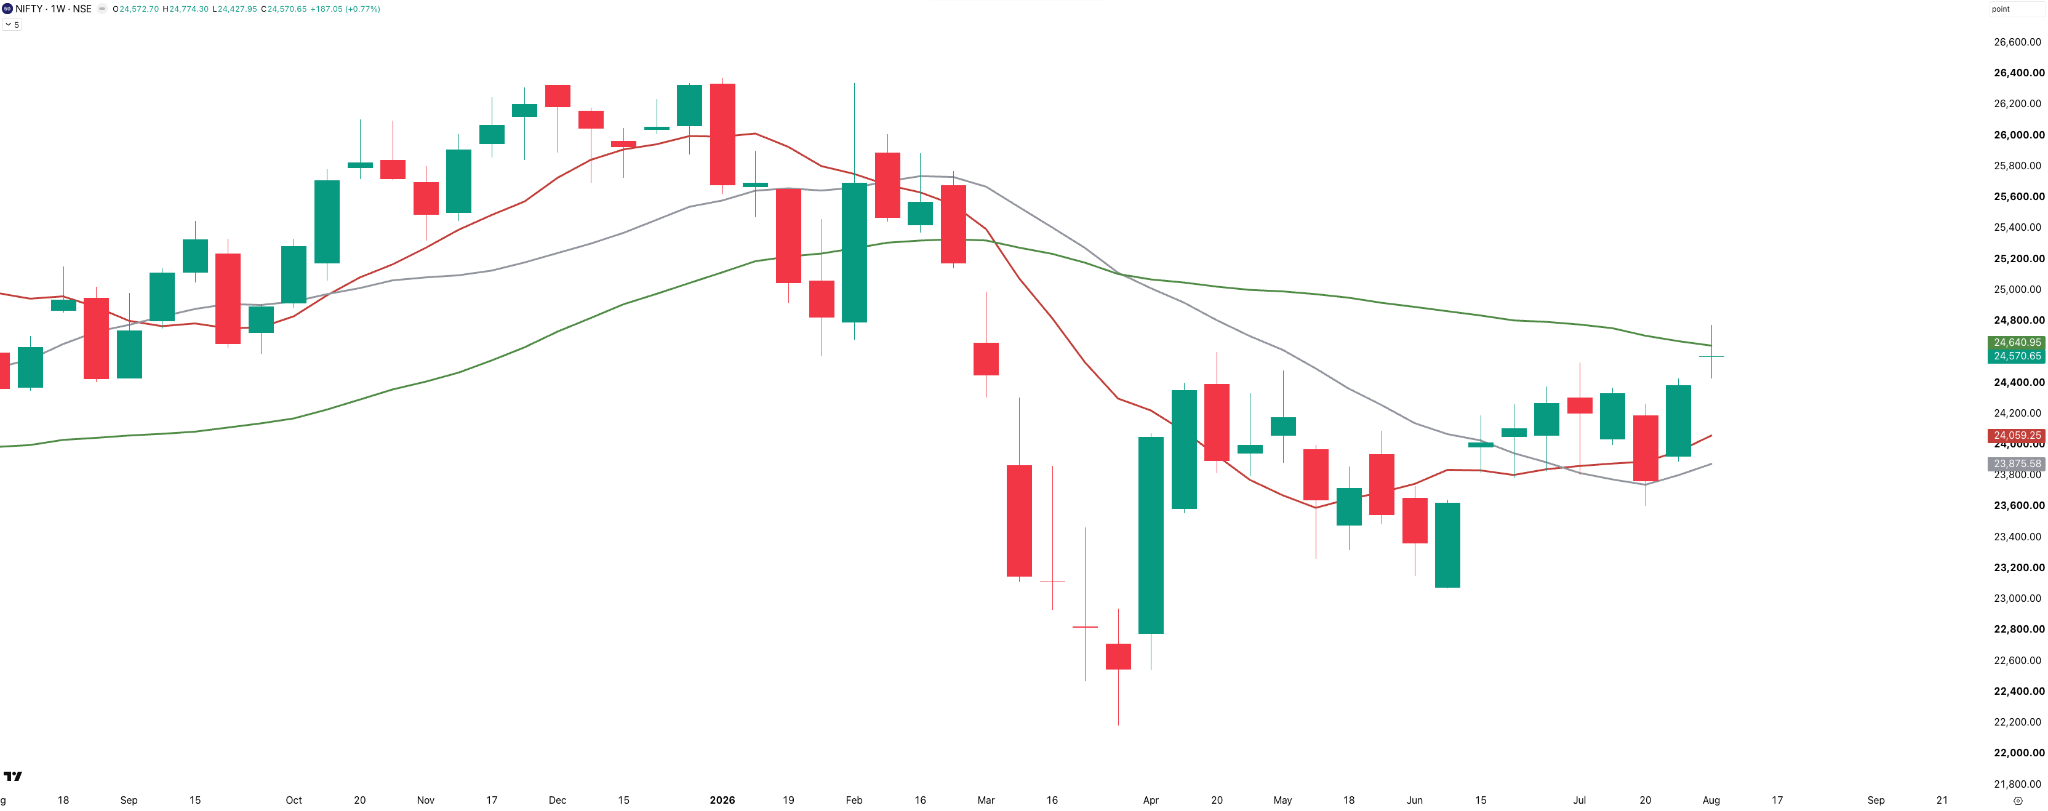
Looking at the weekly moving averages, the picture continues to improve.
NIFTY has now spent two consecutive weeks above both the 10-week and 20-week moving averages, showing that the medium-term trend continues to strengthen.
During the week, the index also briefly traded above the 40-week moving average for the first time since February, although it couldn’t close above it.
Weekly Range and Volatility
Looking at the weekly range, volatility cooled further this week.
NIFTY traded within a range of just 346 points during the week, well below its 10-week average of 519 points. Thursday was by far the quietest session of the week, with a range of just 73 points. Monday and Tuesday were relatively active, with ranges of 259 and 276 points, all thanks to how CAS moved the closing price.
W32

W31

Overall, despite another positive week for the index, price action remained fairly contained, suggesting that volatility continues to stay subdued.
NIFTY - Daily
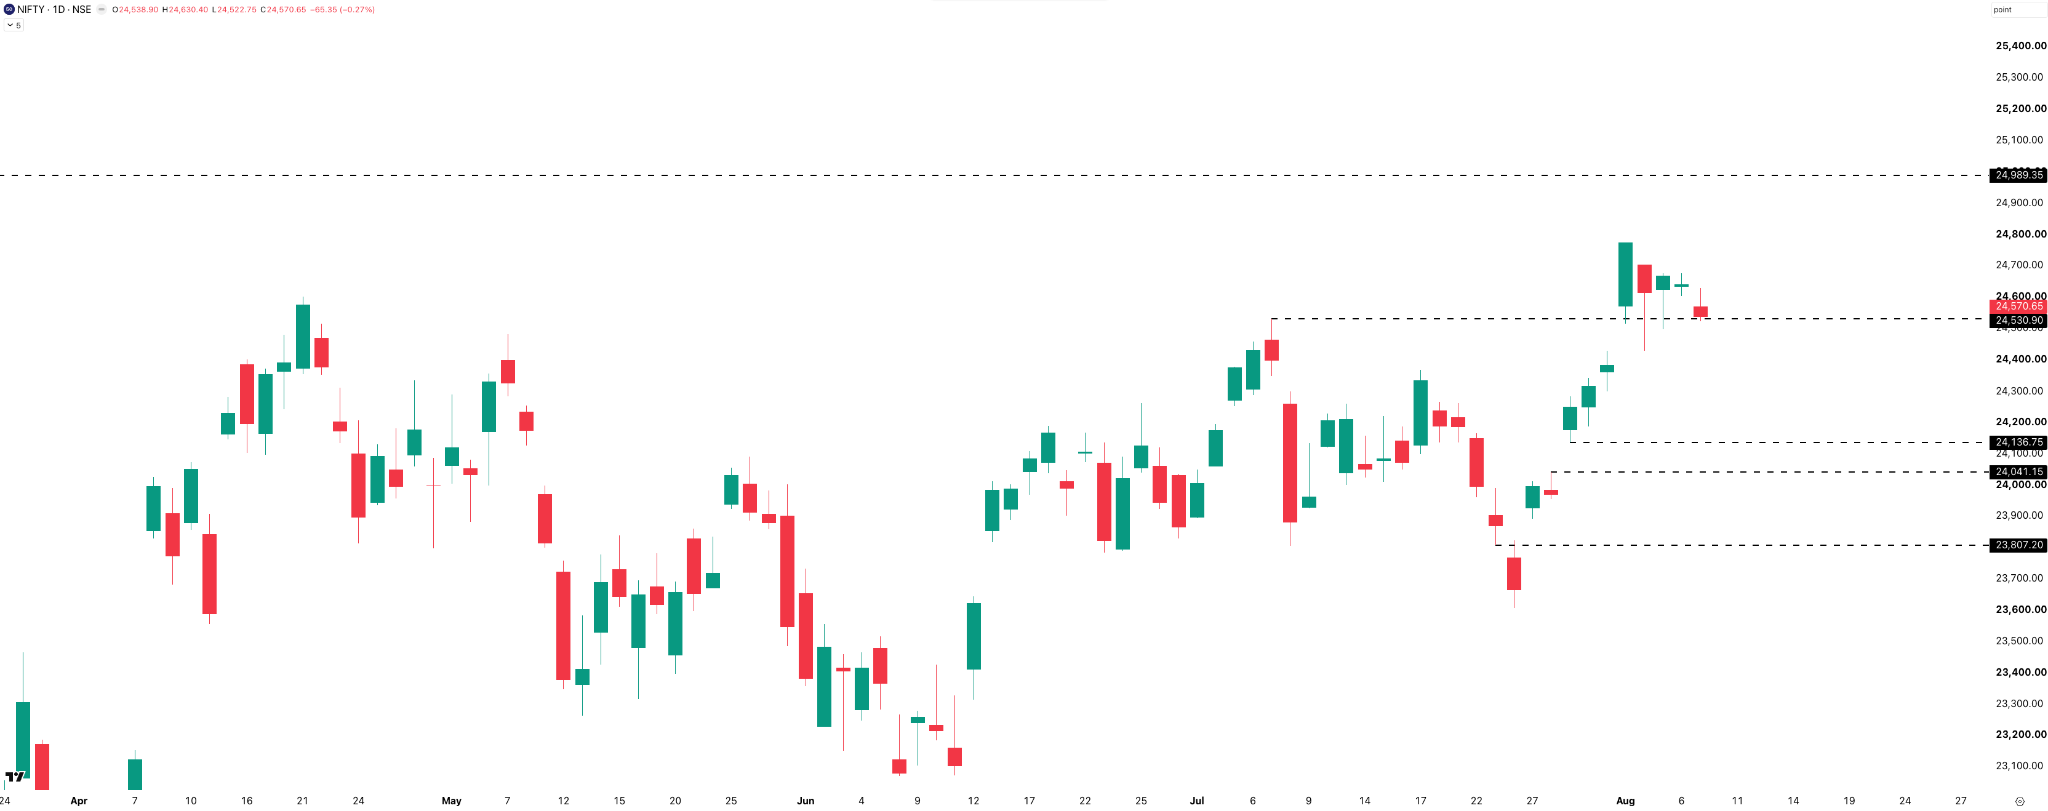
On the daily chart, NIFTY started the week with a gap-up opening on Monday. Tuesday saw the index slip back towards the 24,400 level. Another gap-up on Wednesday pushed NIFTY above 24,600 intraday, but the momentum couldn’t sustain. The last two sessions of the week were largely sideways, with the index consolidating just below 24,600.
Overall, both the daily and weekly charts suggest that the market is taking a breather after the recent rally. The next move will likely depend on whether NIFTY can reclaim 24,600 or continues to consolidate below it.
Daily Moving Averages
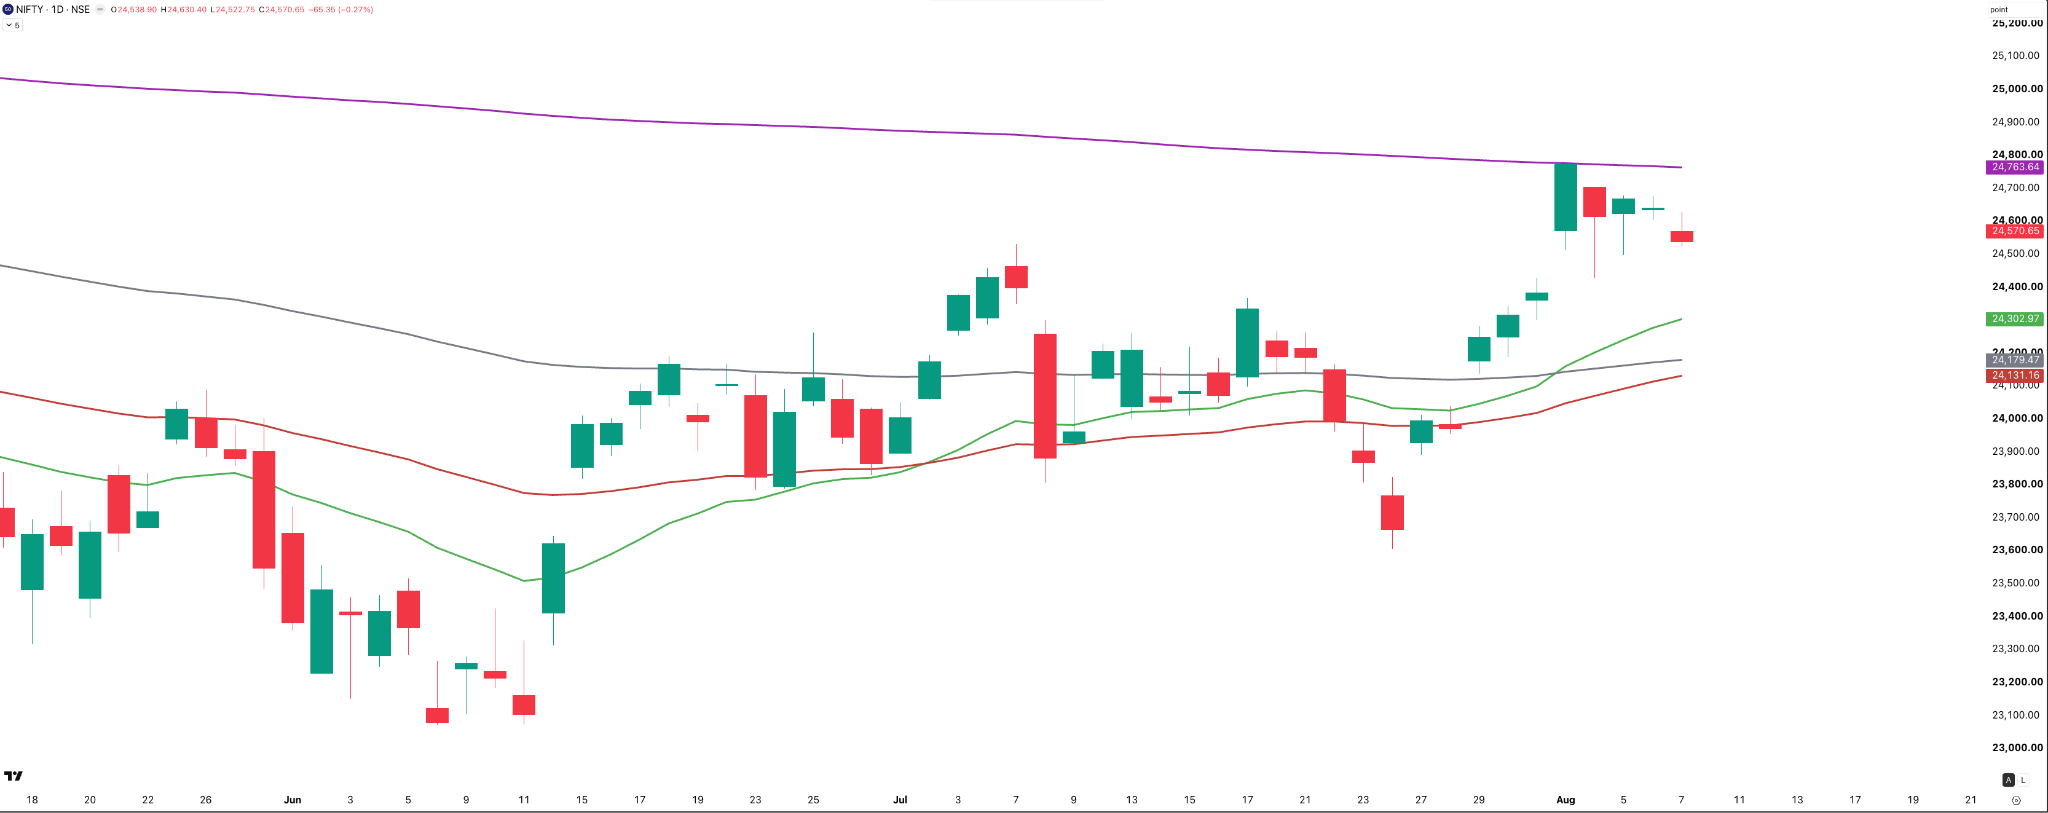
Looking at the daily moving averages, the trend continues to improve.
NIFTY remains comfortably above its 21-day, 50-day, and 100-day moving averages, all of which are now sloping higher. The recent consolidation has also happened above these moving averages, suggesting that buyers continue to defend the trend.
The 200-day moving average is now the key level to watch. NIFTY briefly traded above it on Monday, but that move came during the new Closing Auction Session (CAS), where very few trades took place at those levels. So, it’s still a bit early to judge how much importance should be given to that price.
Over the rest of the week, however, NIFTY was unable to close above the 200-day moving average, which means it continues to act as an important resistance around 24,763.
The 1,500-Point Range Continues
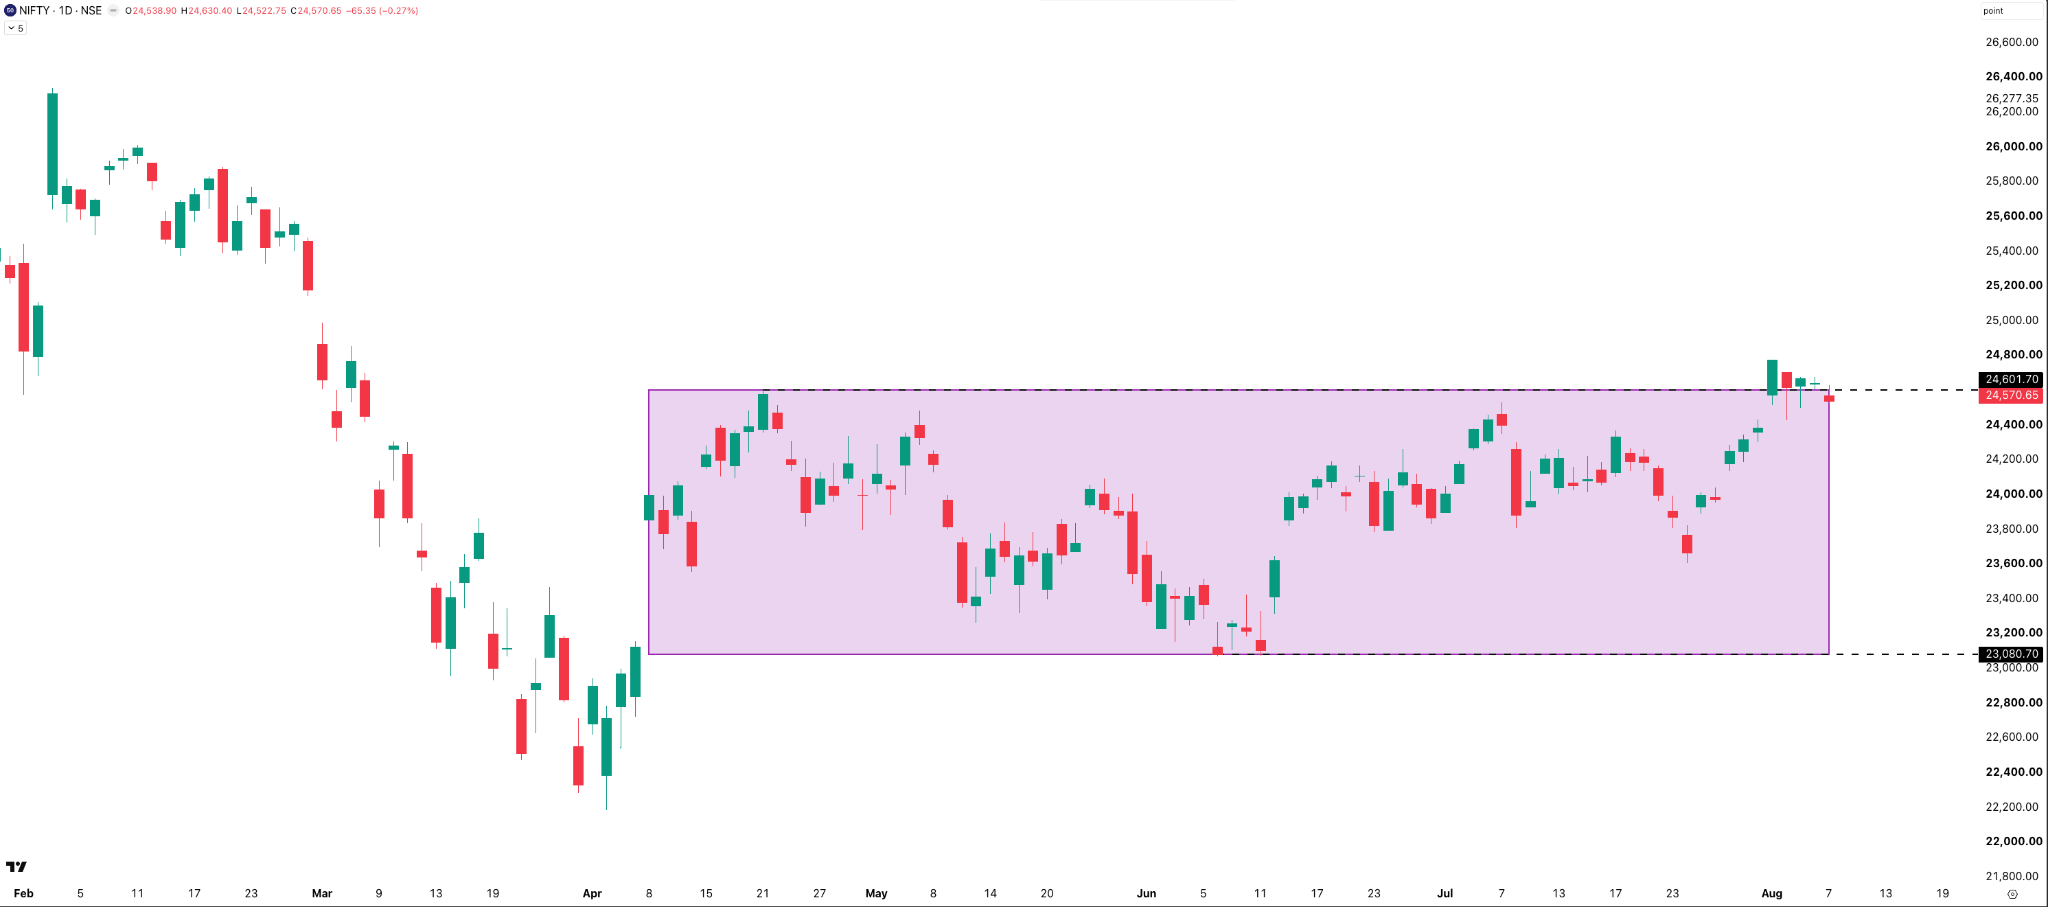
Another week, another update on our famous 1,500-point range. NIFTY did manage to poke its head above the range for a while, but by the end of the week, it quietly walked back in.
So the breakout will have to wait. For now, the market continues to trade within the same range we’ve been tracking for the past few weeks.
NIFTY - Hourly
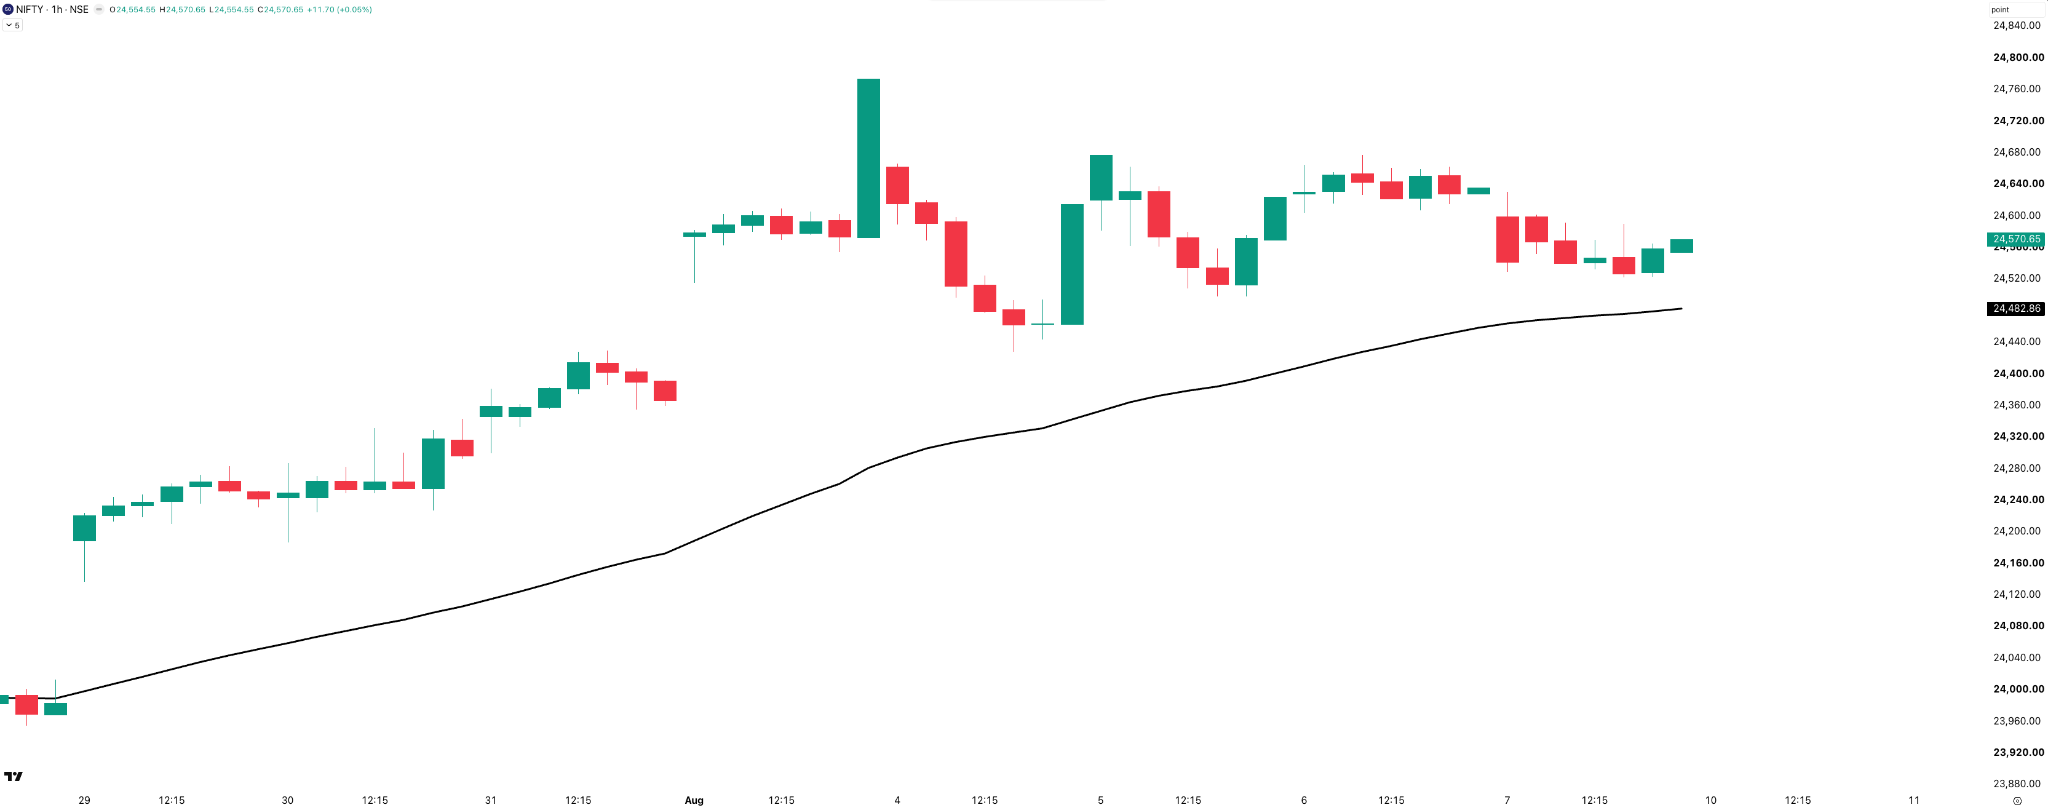
Looking at the hourly chart, the short-term trend remained positive throughout the week, with NIFTY trading above its hourly EMA for most of the sessions.
That said, the introduction of the Closing Auction Session (CAS) made things a little uncomfortable, even for trend followers. The sharp moves during the final 15 minutes on the first two days of the week raised concerns about whether these sudden spikes could trigger stop losses. It hasn’t happened yet, but it’s certainly something to keep an eye on.
Having said that, if we ignore the noise around the CAS, NIFTY continues to trade above its hourly EMA, suggesting that the short-term trend remains bullish.
The NIFTY Weekly Expiry and CAS
About the NIFTY weekly expiry on Tuesday, August 4.
They say no matter how many years you’ve spent in the markets, there’s always something you’ll witness for the first time. That certainly happened to me this Tuesday.
The ATM straddle opened at around 95 points on a weekly expiry, and at 3:15 PM, it was still trading at around 100 points. Those were some really crazy scenes.
For professional option traders, this wasn’t a moment to celebrate seeing such juicy premiums. It was actually quite the opposite.
It was unsettling to see the options market pricing in a 100-point move in just the final 15 minutes.
And that’s exactly what happened.
During the CAS, NIFTY moved +151 points above where it was trading at 3:15 PM, eventually settling at 24,615.
It was one of those rare days where even I wasn’t sure how I would have traded that situation.
A similar story played out during the SENSEX weekly expiry on Thursday. The ATM straddle opened around 500 points, expanded to nearly 700 points during the day, and was still trading close to 500 points at 3:15 PM.
While the final move in SENSEX wasn’t as dramatic as NIFTY, the index ultimately moved around 171 points. The real action happened during the closing auction. The indicative closing price swung between roughly 78,600 and 79,450, an 850-point range in just the last 15 minutes.
To put that into perspective, SENSEX traded within a range of less than 300 points for the entire session, yet the indicative price during the closing auction moved by almost 850 points.
Those indicative prices don’t appear on the chart, so unless you’re watching the auction live, you’d never know how volatile those final few minutes actually were.
Is CAS Really the Problem?
Over the last week, there’s been a lot of discussion around the new Closing Auction Session.
Some people think CAS is the problem. But after watching the last few expiries, I think CAS is not the problem. Our market structure is.
Let me explain what I mean.
Most developed markets use some form of closing auction, and the objective is to discover a fair closing price by bringing all buy and sell orders together. So this isn’t an argument against CAS.
It’s more about a few questions that have come to my mind as a trader after watching the last few expiries.
The biggest surprise for me wasn’t NIFTY moving 150 points during the closing auction. Markets can move. What surprised me was how the options market started pricing that uncertainty.
We saw the NIFTY ATM straddle trading around 100 points at 3:15 PM on expiry day, and SENSEX around 500 points. Sellers simply weren’t willing to sell those final 15 minutes cheaply.
In a way, even option sellers have become hero-zero traders, buyers hoping the closing auction behaves abnormally and sellers hoping it behaves normally.
One argument is that these moves will reduce as more participants start taking part in the auction. I genuinely hope that’s true because deeper liquidity benefits everyone.
But markets aren’t equally liquid every day. The real question is, what happens on days when participation is lower? Can we confidently say we’ll never again see 150 or 200-point closing moves? I don’t know.
There were also rumours on the first day that maybe NSE’s calculations were wrong. Later, it was clarified that the prices were calculated correctly.
But that actually raises a bigger question. If nothing went wrong, should we expect similar behaviour going forward?
Because if these are valid prices, then these sharp moves may simply be a feature of how the auction behaves when liquidity is limited.
I also feel CAS has highlighted a much bigger structural issue.
For a closing auction to work efficiently, you need deep liquidity and participants who can easily arbitrage price differences. India still lacks a robust securities lending and borrowing ecosystem, making short selling in the cash market difficult.
Until participation becomes broader and arbitrage becomes easier, efficient price discovery will remain a challenge.
So I don’t think CAS is the problem. In fact, I think it’s a step in the right direction.
But if we continue to see such wild closing moves, whether on expiry days or even on normal trading days, it will eventually affect every market participant in some way. Hopefully, things settle down as participation increases.
But until then, these are questions worth thinking about.
What to Expect in the Coming Week (Section Two)
Looking ahead, the trend continues to remain positive, but NIFTY is now approaching an important resistance zone around 24,600–24,800. A decisive move above it could pave the way towards 25,000.
On the downside, 24,400 remains the first support to watch. As long as NIFTY holds above this level, the short-term trend continues to favour the bulls.
What the Straddle Is Pricing In
Looking at the straddle premium to gauge the expected range for the upcoming weekly expiry on Tuesday, Aug 11:
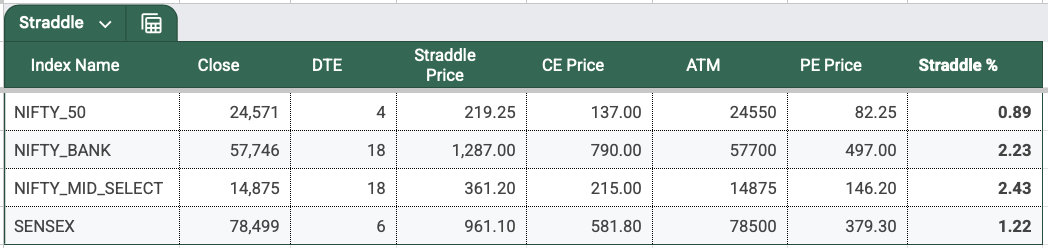
The NIFTY ATM straddle is trading at around 219 points, implying an expected move of about 0.89% from the current level. The higher premium is mainly because of the uncertainty around the CAS. I’m now more interested in seeing how option premiums behave on 1DTE and especially 0DTE over the next few expiries.
Based on that, the expected range for expiry is roughly 24,350 on the downside and 24,790 on the upside.
India VIX
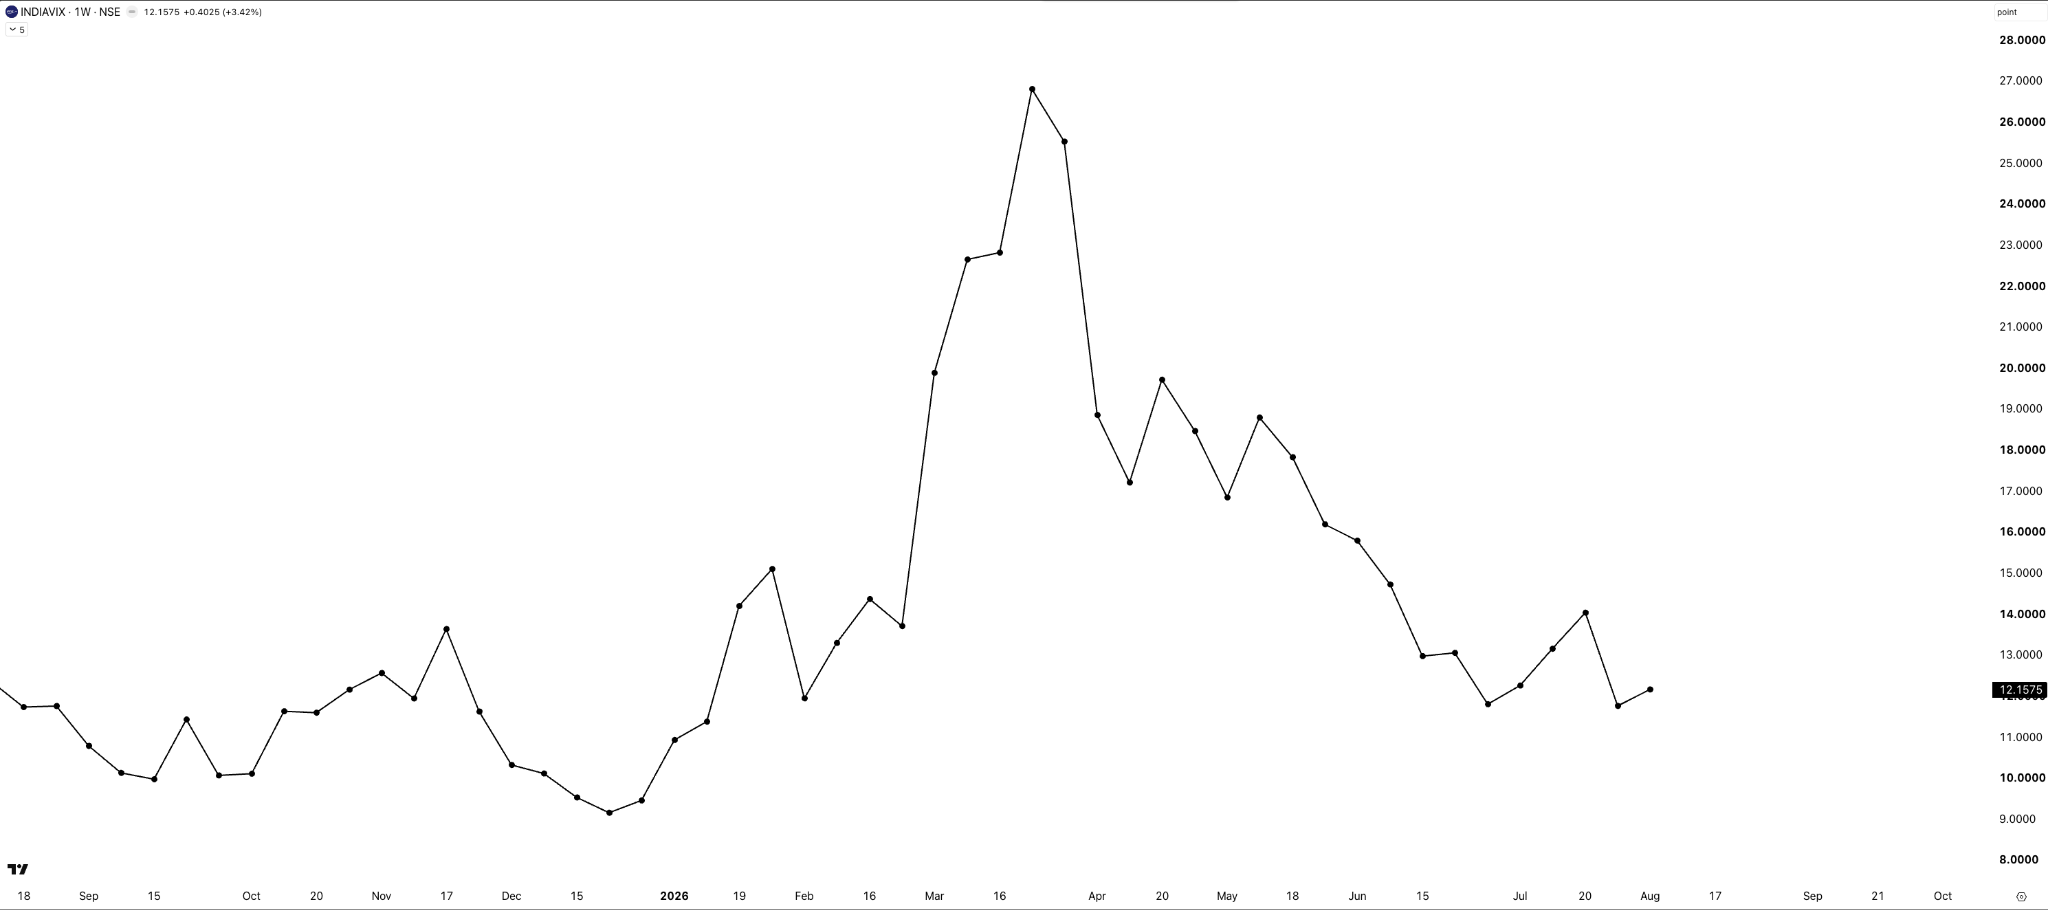
Last week, we saw India VIX collapse back towards its recent lows. This week, it edged higher again, gaining around 3.4% to close at 12.16.
With the uncertainty around the Closing Auction Session (CAS) still fresh, it’ll be interesting to see whether VIX remains near these levels or starts moving higher over the coming weeks.
Sectoral Performance
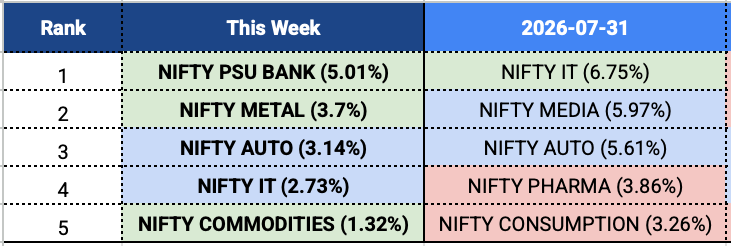
Moving on to the sectoral indices, sectoral performance was a lot more balanced this week compared to last week.
NIFTY PSU BANK emerged as the top-performing sector with a gain of 5.0%, followed by METAL at 3.7% and AUTO at 3.1%. IT, which led the market last week, remained in the top five but cooled off with a gain of 2.7%.
The change in leadership suggests that the rally broadened out this week, with PSU Banks and Metals taking over from IT, rather than being driven by just one or two sectors.
TJI Sector Baskets
Moving on to the TJI sector baskets, this week the QSR basket seems to be right at the top with a whopping 17.5% change. This is a segment that was beaten down and is now mean-reverting. It has featured earlier as well in the top-performing basket.
Then we have Wires & Cables at 7.6%, Refractories at 6.5%, Pharma API and CRAMS, and Bearings both at 6.3%.
Each of these sectors has been making it to the top five baskets over the past several weeks, which tells us such thematic trends do hold up for long.
Let’s now look at the sectors at their 52W high.
Sectors at 52-Week Highs
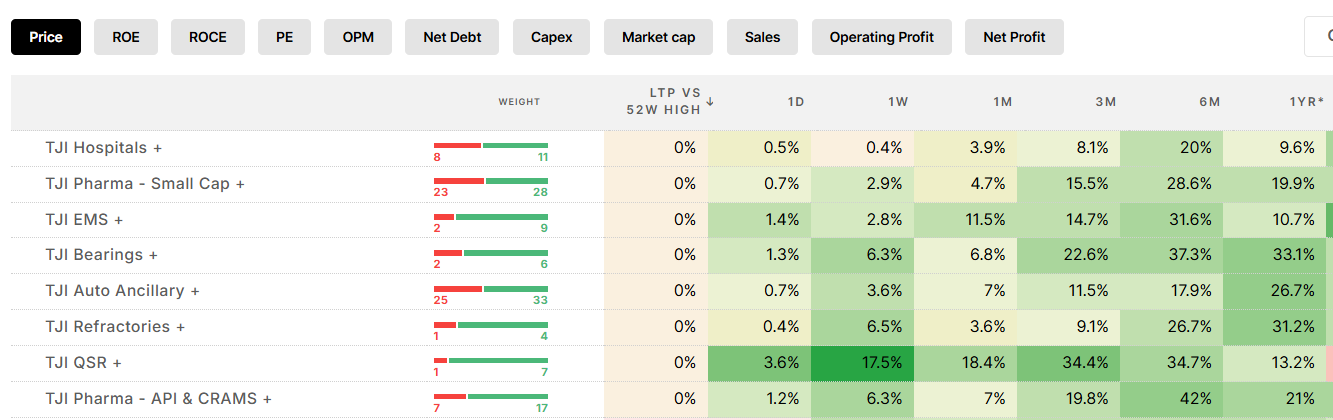
A fair bit of overlap with the top five. Again, we have Hospitals, EMS, and Auto Ancillaries coming up. These baskets have also been among the top-performing for the year.

Precious Metals
Moving on to Commodities.
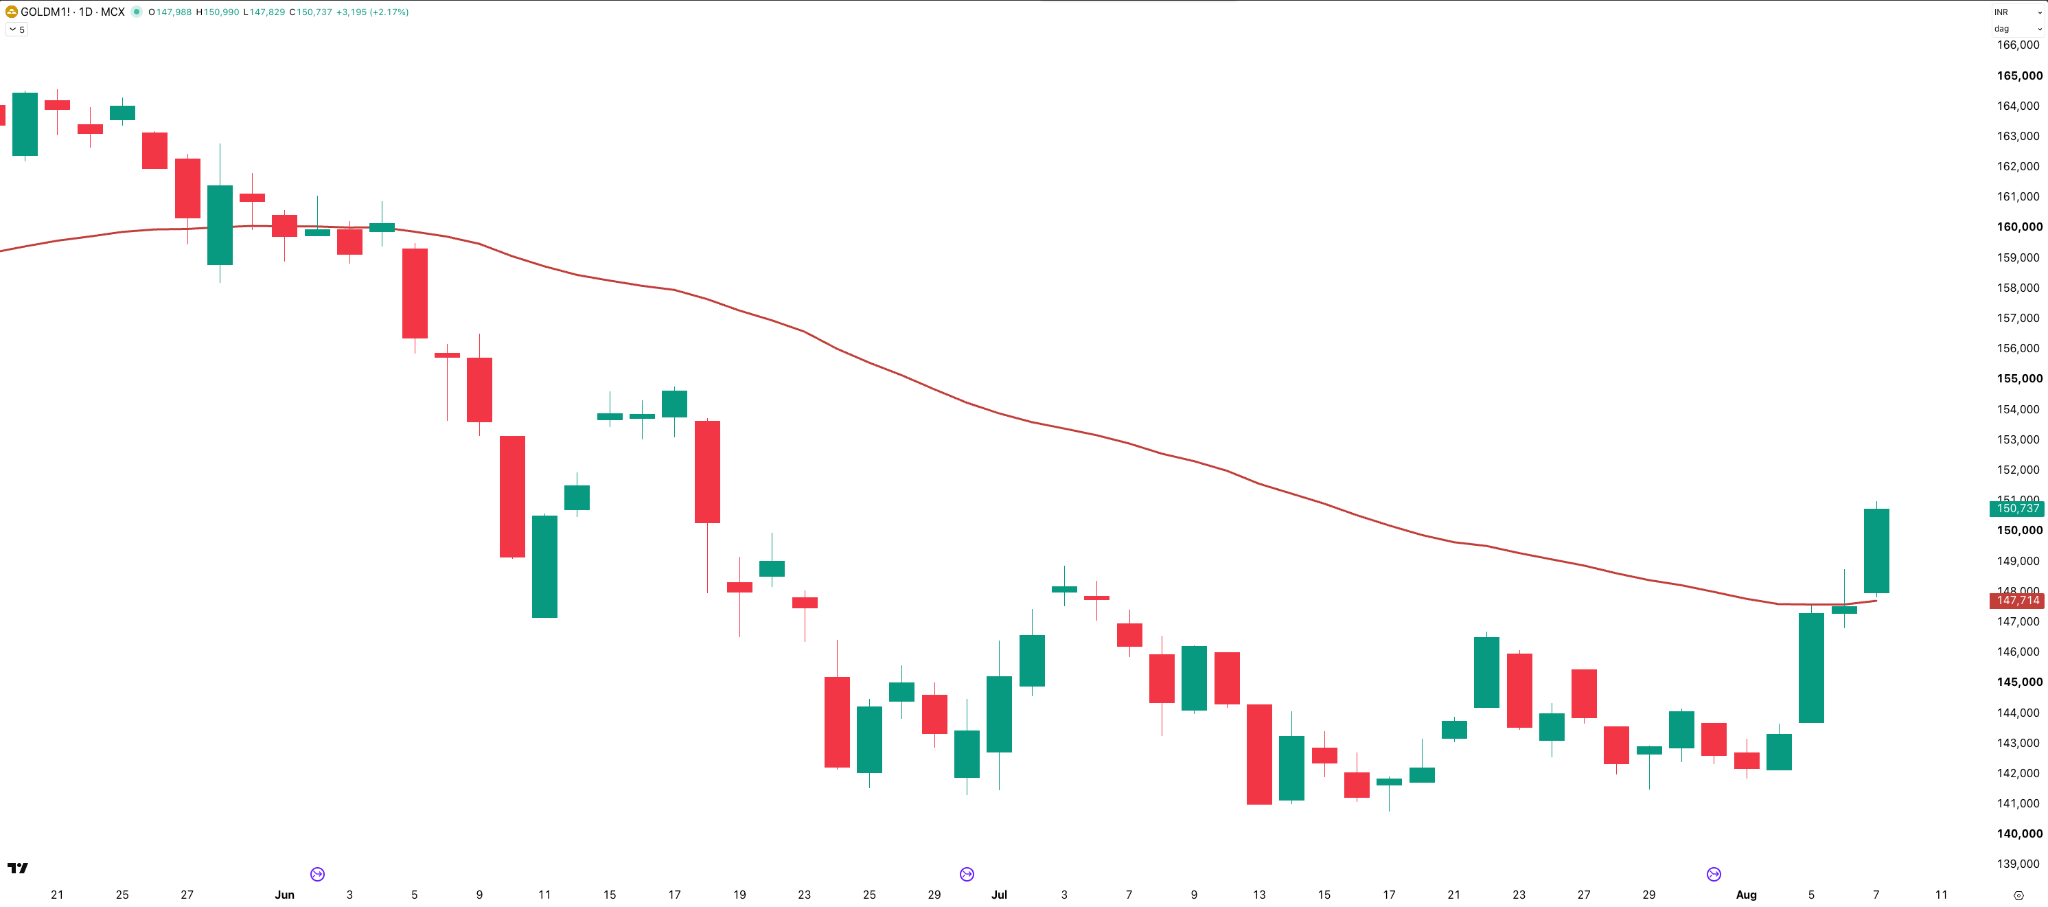
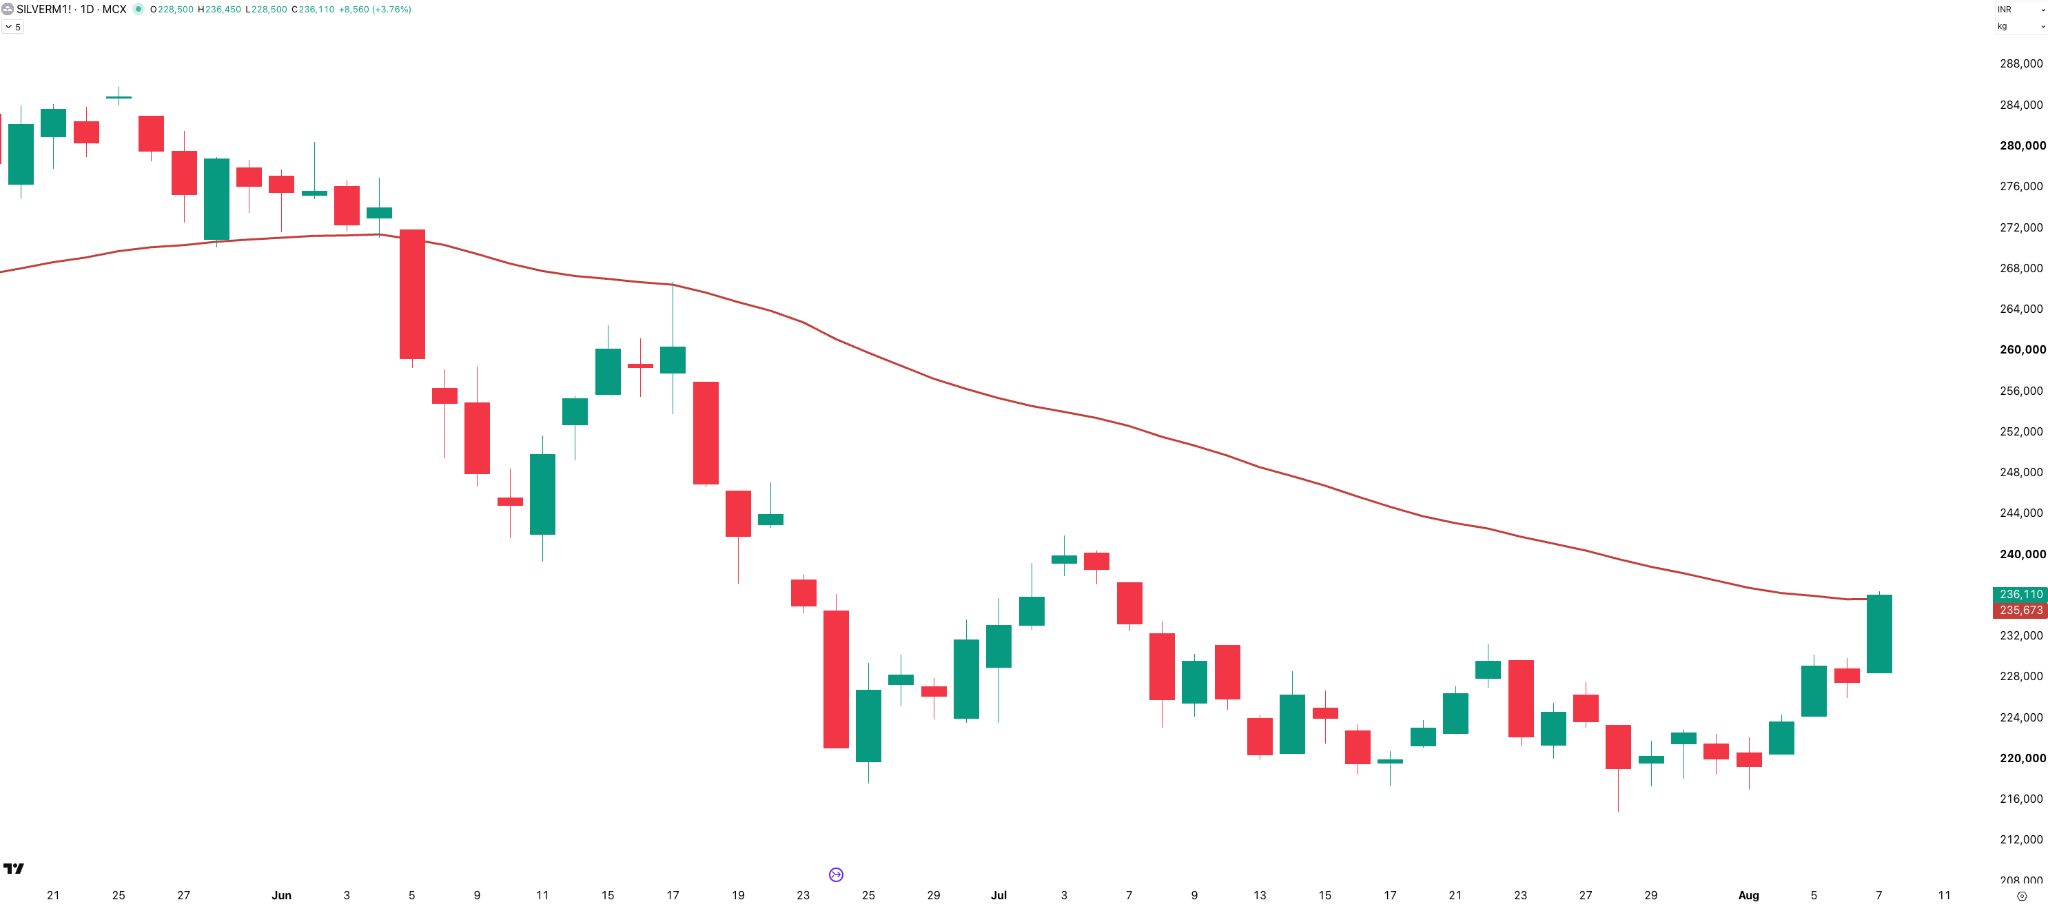
Precious metals had a strong week, with both Gold and Silver witnessing a sharp rally.
Gold gained around 6%, while Silver rose about 8% during the week. More importantly, both have reclaimed their 50-day EMA after trading below it for nearly 10 weeks.
If they manage to hold above this level in the coming sessions, it could be an early sign that the short-term trend is turning positive again.
Commodities
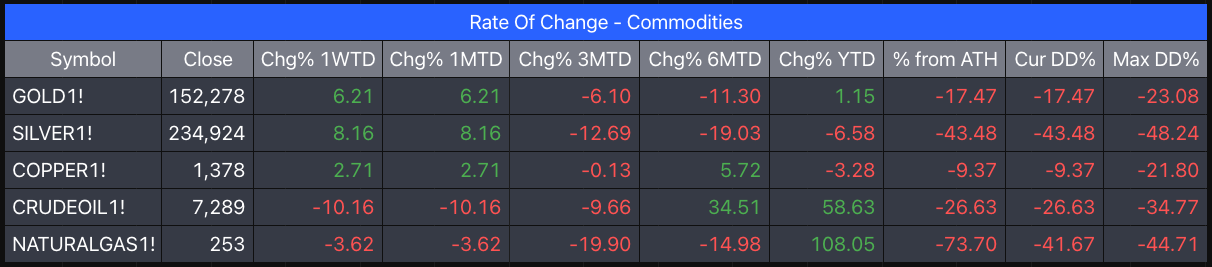
Commodities had a mixed week. Gold and Silver were the standout performers, leading the gains, while Copper also ended the week higher with a modest gain.
On the other hand, Crude Oil was the biggest loser, falling over 10% during the week, followed by Natural Gas, which declined around 3.6%.
Putting It All Together
So, to sum it all up, the market had another positive week, but the bigger picture hasn’t changed much. NIFTY is still trading within the same 1,500-point range that has contained prices for the past four months, and the key resistance around 24,600–24,800 still remains.
At the same time, the biggest talking point wasn’t the market itself; it was the Closing Auction Session (CAS). The last few expiries have raised some important questions about option pricing, liquidity, and the structure of our markets. Whether these are just teething issues or something more structural is something we’ll find out over the coming weeks.
For now, the short-term trend remains positive, but with resistance overhead and a lot of attention on how CAS evolves, the coming week should be another interesting one.
What Caught My Attention This Week
Moving on to what caught my attention this week, I have two long reads.
- The first is a sad one. Victor Niederhoffer, one of the original quants and, of all things, a five-time US squash champion, passed away this week at 82.
So here’s a 2007 New Yorker profile of him titled “The Blow-Up Artist.” The gist? He made and lost several fortunes betting against the crowd. The piece asks whether he can survive another crisis? Which it didn’t. But do read; there’s far more to the man. His book, The Education of a Speculator , is a must-read in its own right.
- The second stays on the theme of crowds, just from the other side.
It’s a Morgan Stanley note by Michael Mauboussin called “The Wisdom of Crowds.”
It says: A big enough group, guessing independently, is often eerily accurate. The errors cancel out.
The catch, however, is what happens when they stop guessing independently and start copying each other. That’s when wisdom no longer remains wisdom and turns into bubbles.
A nice close to Niederhoffer, a man who spent his life fading the crowd. Again, a good read as with anything that comes from Mauboussin.
Events to Watch in the Coming Week
Now, over to the events to factor in for the coming week.
There aren’t any major domestic macro events scheduled this week, so it should be a relatively quiet one on that front.
One small thing, though. Independence Day falls on a Saturday this year, so unfortunately that’s one less market holiday for all of us.
A Quick Announcement
And finally, a quick announcement. There won’t be a Weekly Market Metrics edition next week, as I’ll be speaking at the Global Commodity Conclave on Day 3, August 14. The conference runs from August 12 to 14.
If you’re in Mumbai and happen to be attending, do come and say hi. It would be great to meet some of you in person.
So yeah, that’s pretty much it for the week.
If you find this series useful, don’t forget to subscribe to the newsletter, and yes, do share it with your friends.
Until then, stay curious, stay steady, and enjoy your weekend.