Welcome to the Weekly Market Metrics. I’m Sandeep Rao, and we’re in Week 35 of 2026.
Starting on a heavy note. Flash floods tore through the Nepal–Tibet border, and the toll is already past four hundred, and over a thousand are still missing. Experts say it was caused by glaciers giving in rather than an earthquake.
A couple of decades ago, we thought climate change was something that won’t bother us in our lifetimes. Turns out climate change goes exponential too — a reminder not to take any of it for granted.
Closer to home — remember last week’s sugar rush? The same story’s now cracking eggs. Prices are up about forty percent over the past year, again due to the ethanol push. The blending mandate pulls sugarcane one way, maize the other, and maize is more than half of what our hens eat. So one policy seems to have caused two different effects.
Then CAS, the Closing Auction Session we flagged last edition. The shocks haven’t stopped. On Thursday, the Sensex cracked almost three percent inside that twenty-minute window — a proper flash crash — before clawing back to close under a percent down. The system that was meant to even the close is, for now at least, throwing the wildest swings of the day. More on it in a while.
And the market? It was a soft week — the index closed below last week, around 24,175 .
That sounds like all gloom? Not really. FPIs, i.e., foreign portfolio investors, turned net buyers in August for the first time in five months. A small green shoot after a long dry stretch.
With that, let’s get into what happened last week, and what could happen in the one ahead.
The CAS Flash Crash — What Happened, and Why It Matters
I want to start today with what happened on Sensex expiry on Thursday. During the closing auction session, the Sensex suddenly fell almost 3%, before recovering most of that move by the final close.
And I think this is probably the clearest example yet of why it should be a concern to all market participants as far as CAS is concerned.
So, what exactly happened? The simplest explanation seems to be liquidity. BSE volumes are much thinner than NSE, and when you try to discover prices in a thin order book, even relatively small orders can have a disproportionate impact on prices.
We saw this very clearly in banking stocks. Several banking stocks were down around 3% on BSE on Thursday, while they barely moved on NSE — and then they recovered on Friday morning.
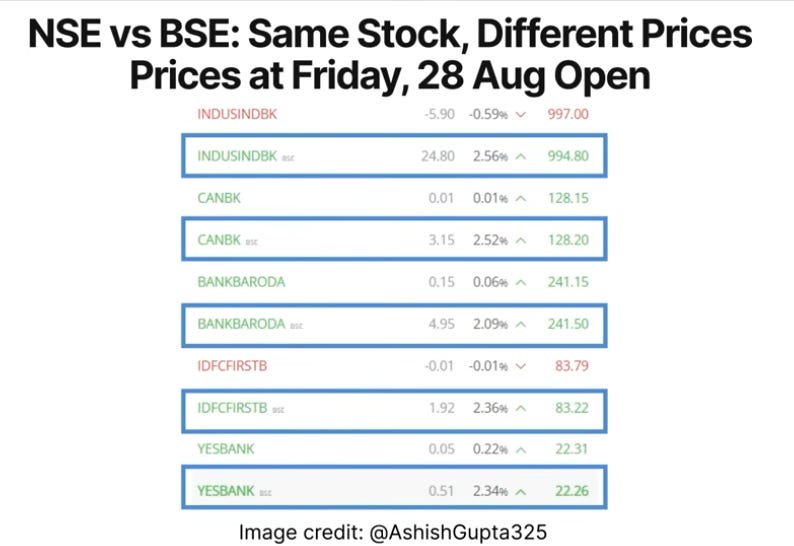
So, was there some fundamental change in these companies between Thursday and Friday? Obviously not.
Take IndusInd Bank. It closed around ₹1,003 on NSE and ₹970 on BSE.
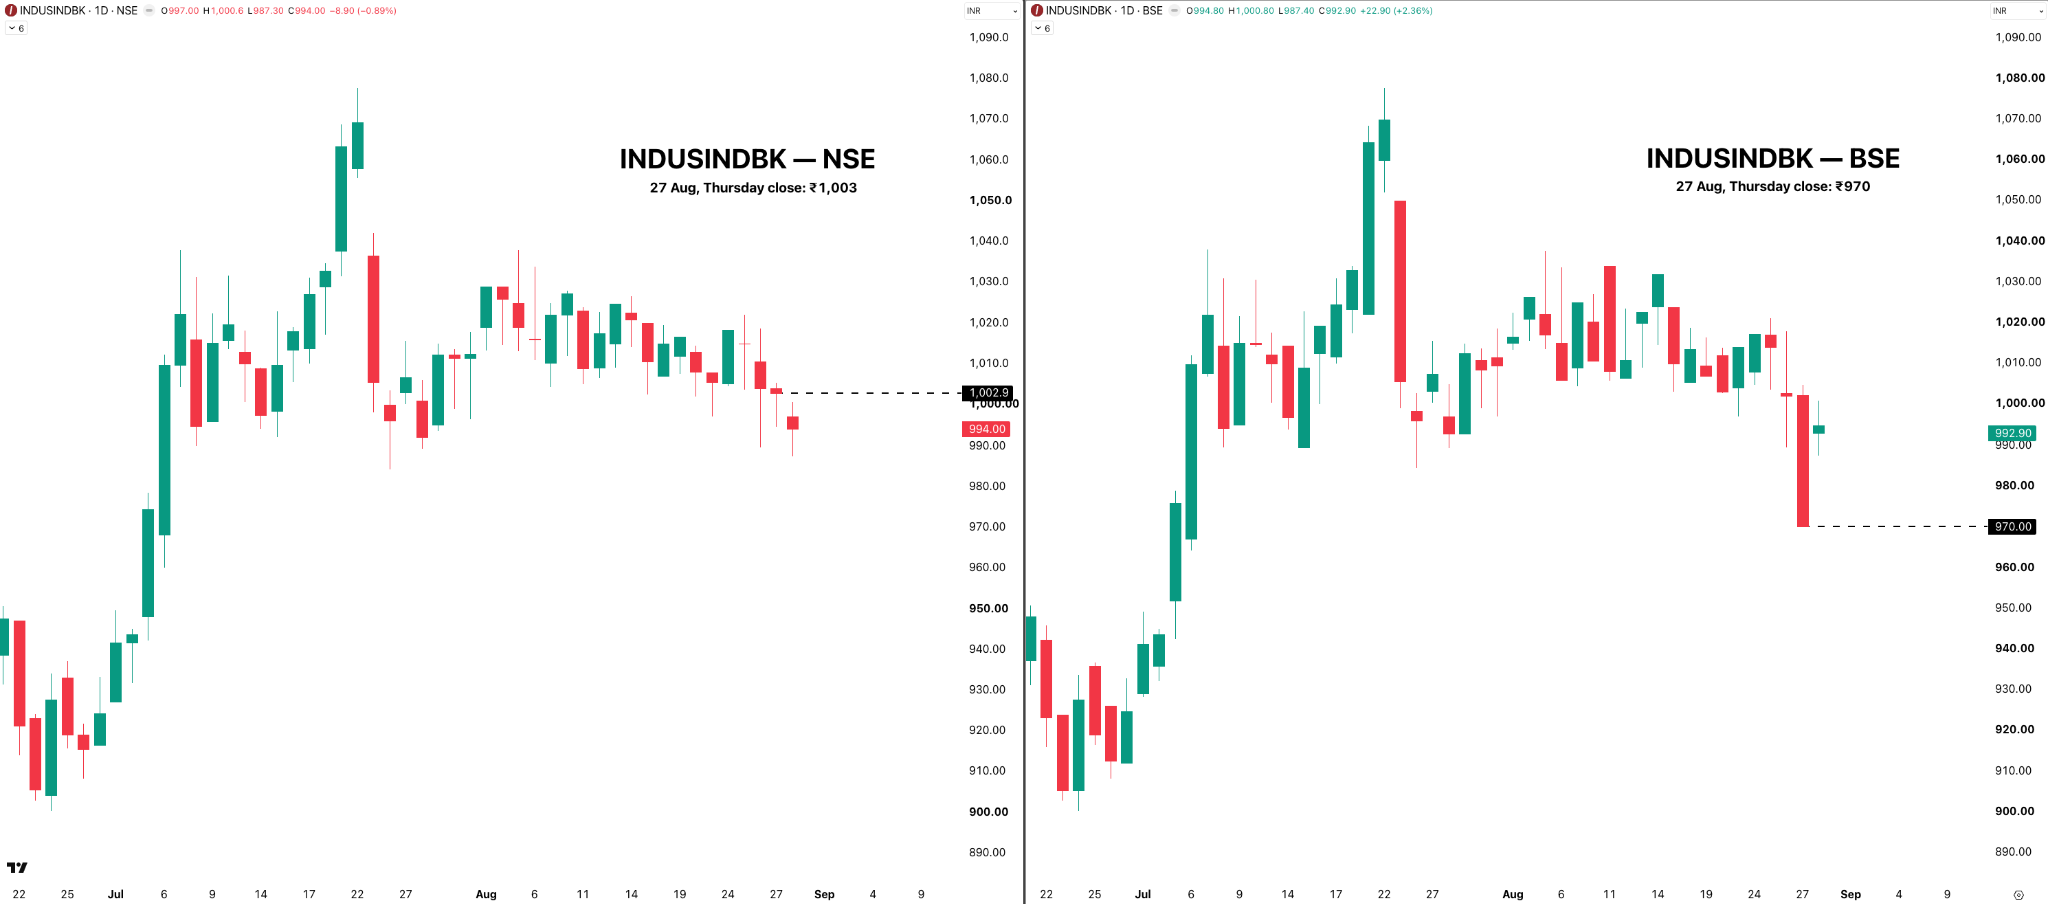
That’s a difference of more than 3%. In theory, such a large price difference shouldn’t exist, and it should have been arbitraged away. But why didn’t it happen? Perhaps the answer is simply that there wasn’t enough liquidity to arbitrage it away. And that’s the bigger question around CAS.
If liquidity is the root cause of the problem, will it definitely improve? SEBI’s current position is that the system is working and that brokers and other participants will help increase liquidity and participation. But there is obviously no guarantee of how quickly, or how much, liquidity will improve.
There is also the question of manipulation. SEBI has already taken action against two entities over alleged manipulation of the auction window. That doesn’t mean Thursday’s move was manipulation — we don’t know that. But it does tell us that this is a mechanism where manipulation is a legitimate risk, particularly when liquidity is thin.
I don’t want to get into accusing someone of manipulating the auction and making tons of money. That’s the job of the regulator, and I’m sure they will investigate it if there is evidence.
But there are still some very valid questions here.
- Why did these price gaps happen?
- And why wasn’t it arbitraged away?
- And if liquidity is a key issue, can we be sure that this will improve enough for the mechanism to work as intended?
- Are there steps being taken to improve liquidity?
Personally, I think this discussion is being reduced to 0DTE options trading and the impact on that. I think the implications are much broader. Closing prices are used everywhere — in charts, backtests, systematic strategies, NAV calculations, margins and portfolio decisions. If the closing price is distorted because of a thin auction, all of these systems go for a complete toss.
There are already several suggestions being discussed — delinking expiry from CAS, ending derivatives earlier at, say, 3:15, or replacing the fixed 3% band with something more dynamic based on the volatility of the individual stock. I don’t know which solution is right. But these are reasonable questions to ask. Because ultimately, what is CAS supposed to achieve? Price discovery. And after what we’ve seen through August, the question remains open - Is CAS actually improving price discovery, or are we simply getting a closing price because the new system needs to print one? That’s the question worth answering.
Section One — Weekly Recap
Rate of Change (ROC)
Let’s get started with the Rate of Change (ROC) across the headline indices; it was a relatively quiet fortnight for the markets.

NIFTY 50 slipped 0.3% , while NEXT 50 gained 0.2%. The broader market did better, with MIDCAP 150 and SMALLCAP 250 up 0.4%, and MICROCAP 250 leading at 0.5%.
Over the longer periods, MICROCAP 250 remains the strongest performer, gaining 5.6% over one month, 11.9% over three months, and 24.3% over six months. NIFTY 50 remains negative over both one and six months.

Looking at the broader indices we track, NIFTY MID SELECT was the clear outperformer this week, gaining 0.6%, while NIFTY 50, NIFTY BANK and SENSEX all closed lower.
On a YTD basis, MID SELECT continues to lead with an 8.6% gain, while NIFTY BANK is down 3.5%, NIFTY 50 is down 7.5%, and SENSEX remains the weakest, down 9.3%.
In terms of distance from their all-time highs, MID SELECT is almost back at its peak, just 0.7% below it. NIFTY BANK is about 6.6% below, NIFTY 50 about 8.2%, while SENSEX remains nearly 10% below its high.
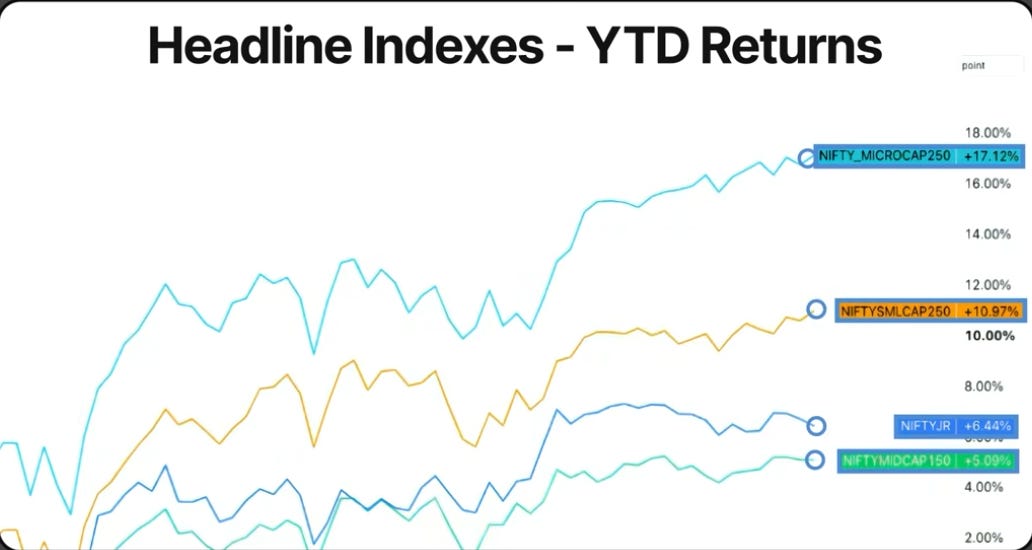
Looking at the year-to-date performance, the gap between large caps and the broader market remains clear. MICROCAP 250 leads with a 17.1% gain, followed by SMALLCAP 250 at 11%. NIFTY JR is up 6.4%, while MIDCAP 150 has gained 5.1%. NIFTY 50 remains the laggard, down 7.5% so far this year.
NIFTY — Weekly
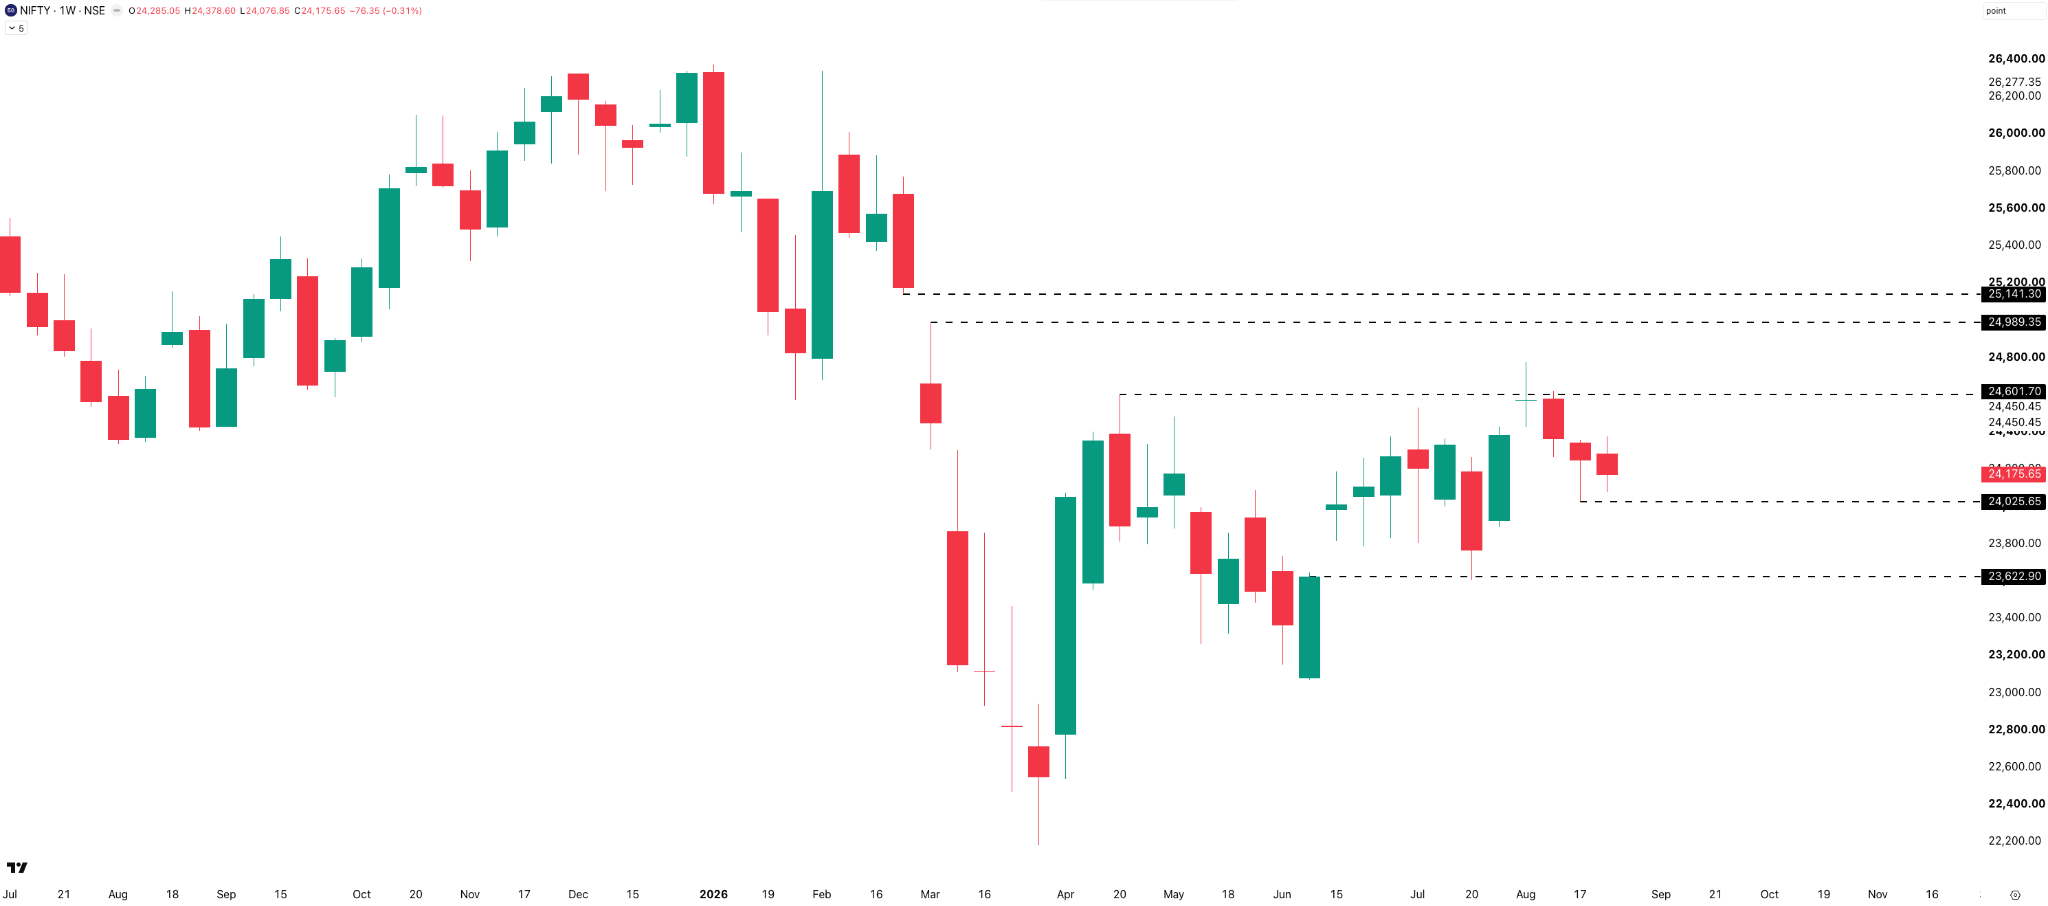
On the weekly chart, NIFTY slipped another 0.3% and closed below the previous week’s close. The index remains below the 24,600 resistance, while 24,000 , which is also the previous week’s low and a round number, could act as support. Below that, 23,600 is the next important level.
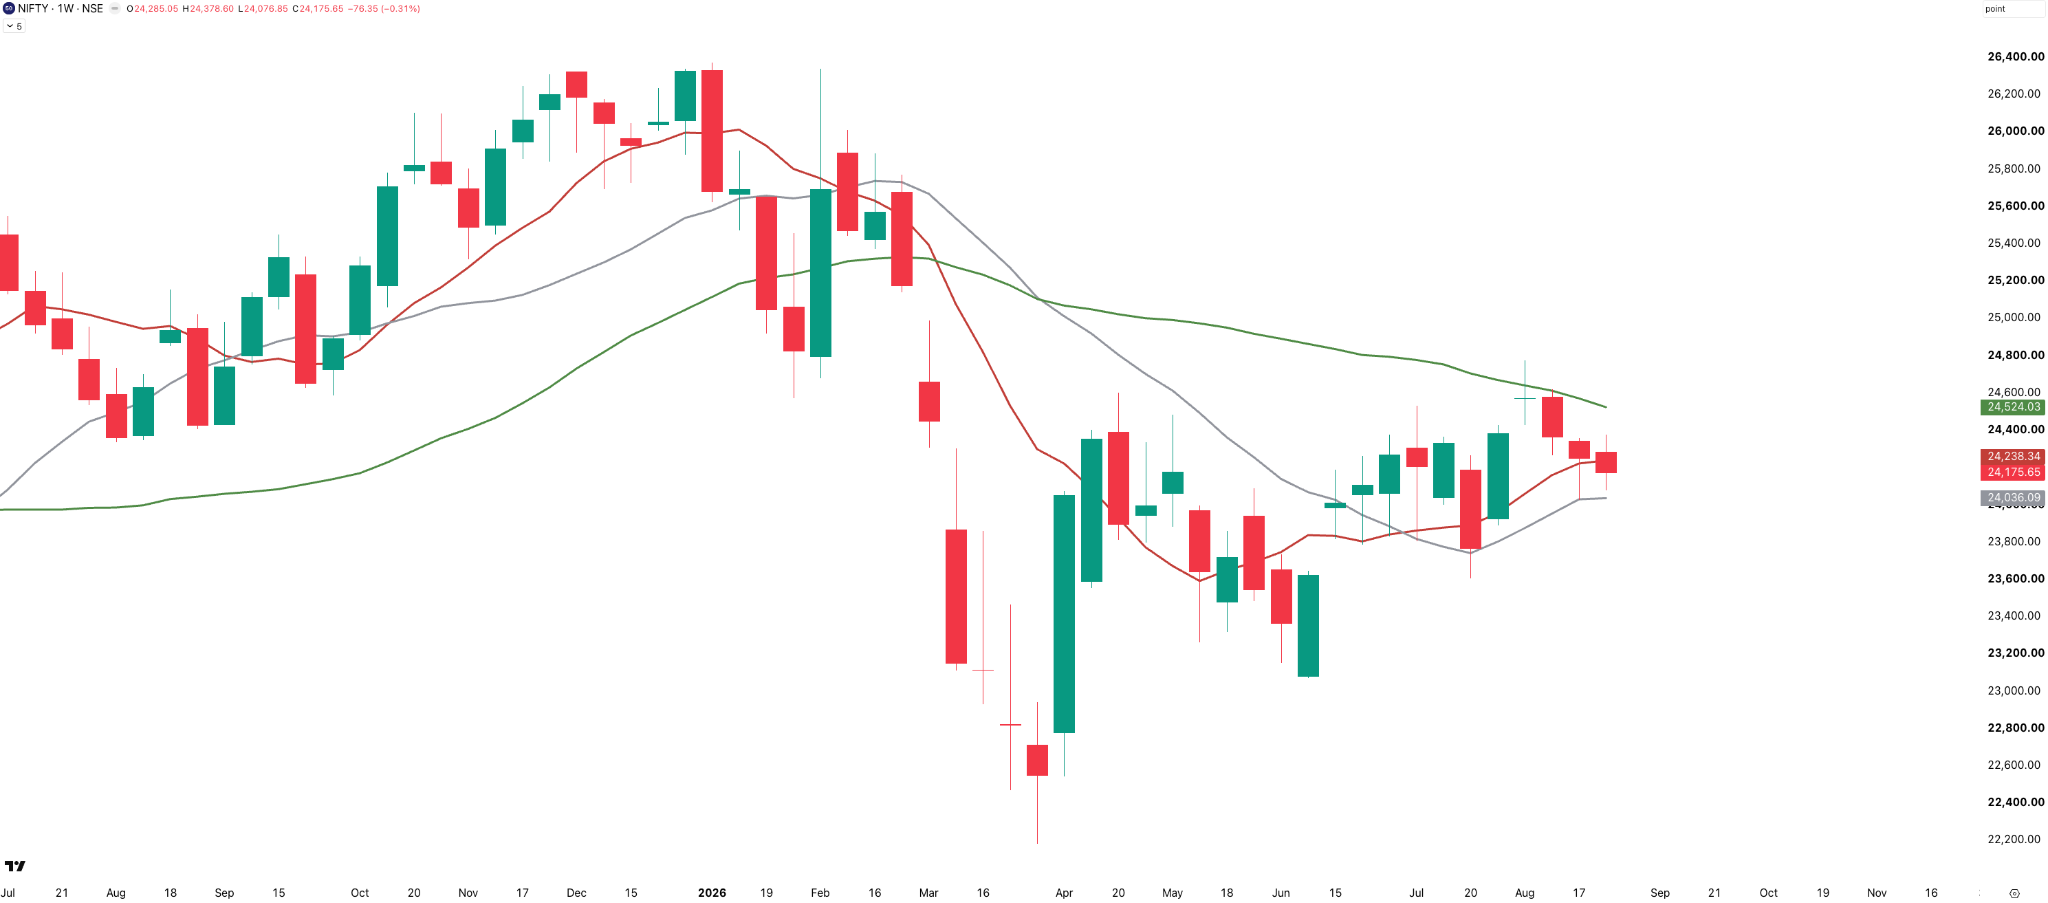
Looking at the weekly moving averages, NIFTY has slipped below the 10-week SMA, but remains above the 20-week SMA. The 40-week SMA is around 24,525, which is also close to the 24,600 resistance we discussed earlier. So this 24,500–24,600 zone remains an important hurdle for NIFTY.
NIFTY — Daily
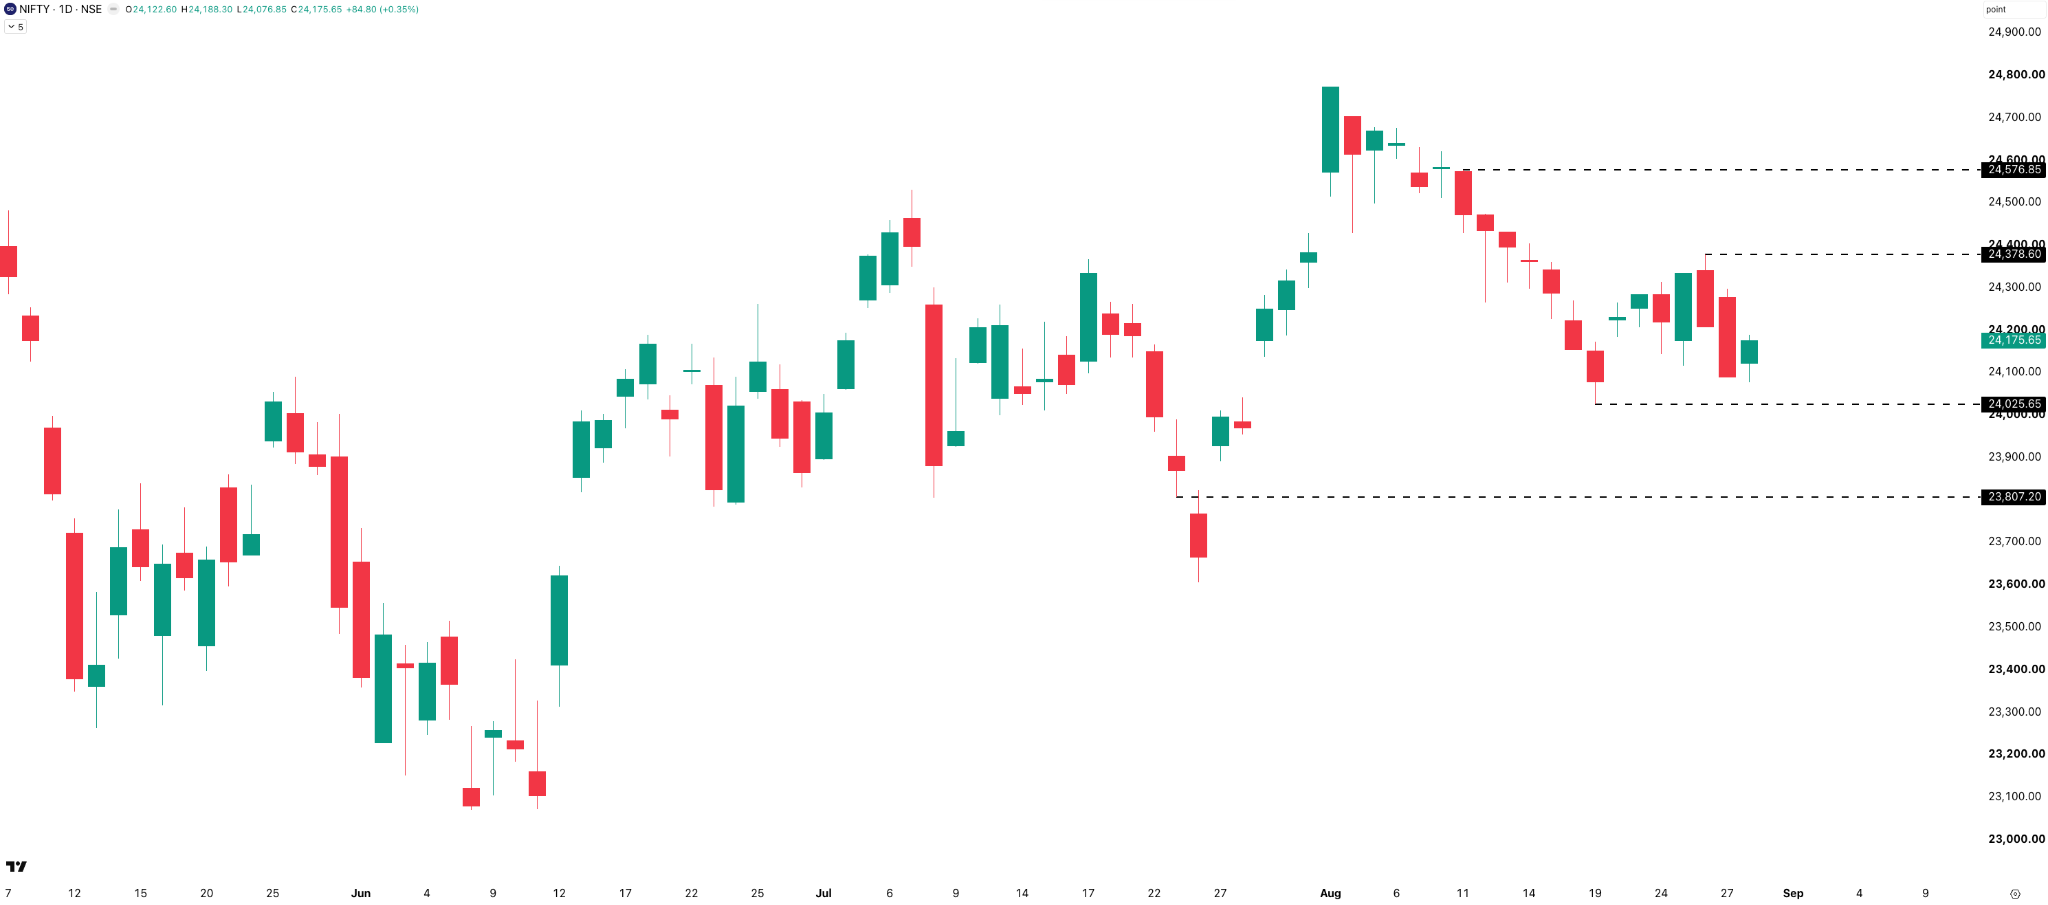
On the daily chart, NIFTY had three red candles and two green candles this week. The index traded in a 302-point range , or around 1.25%, during the week. It fell towards the 24,000 level before recovering to close around 24,175 .
Both the daily and weekly ranges continue to remain relatively low, with the index essentially going nowhere.
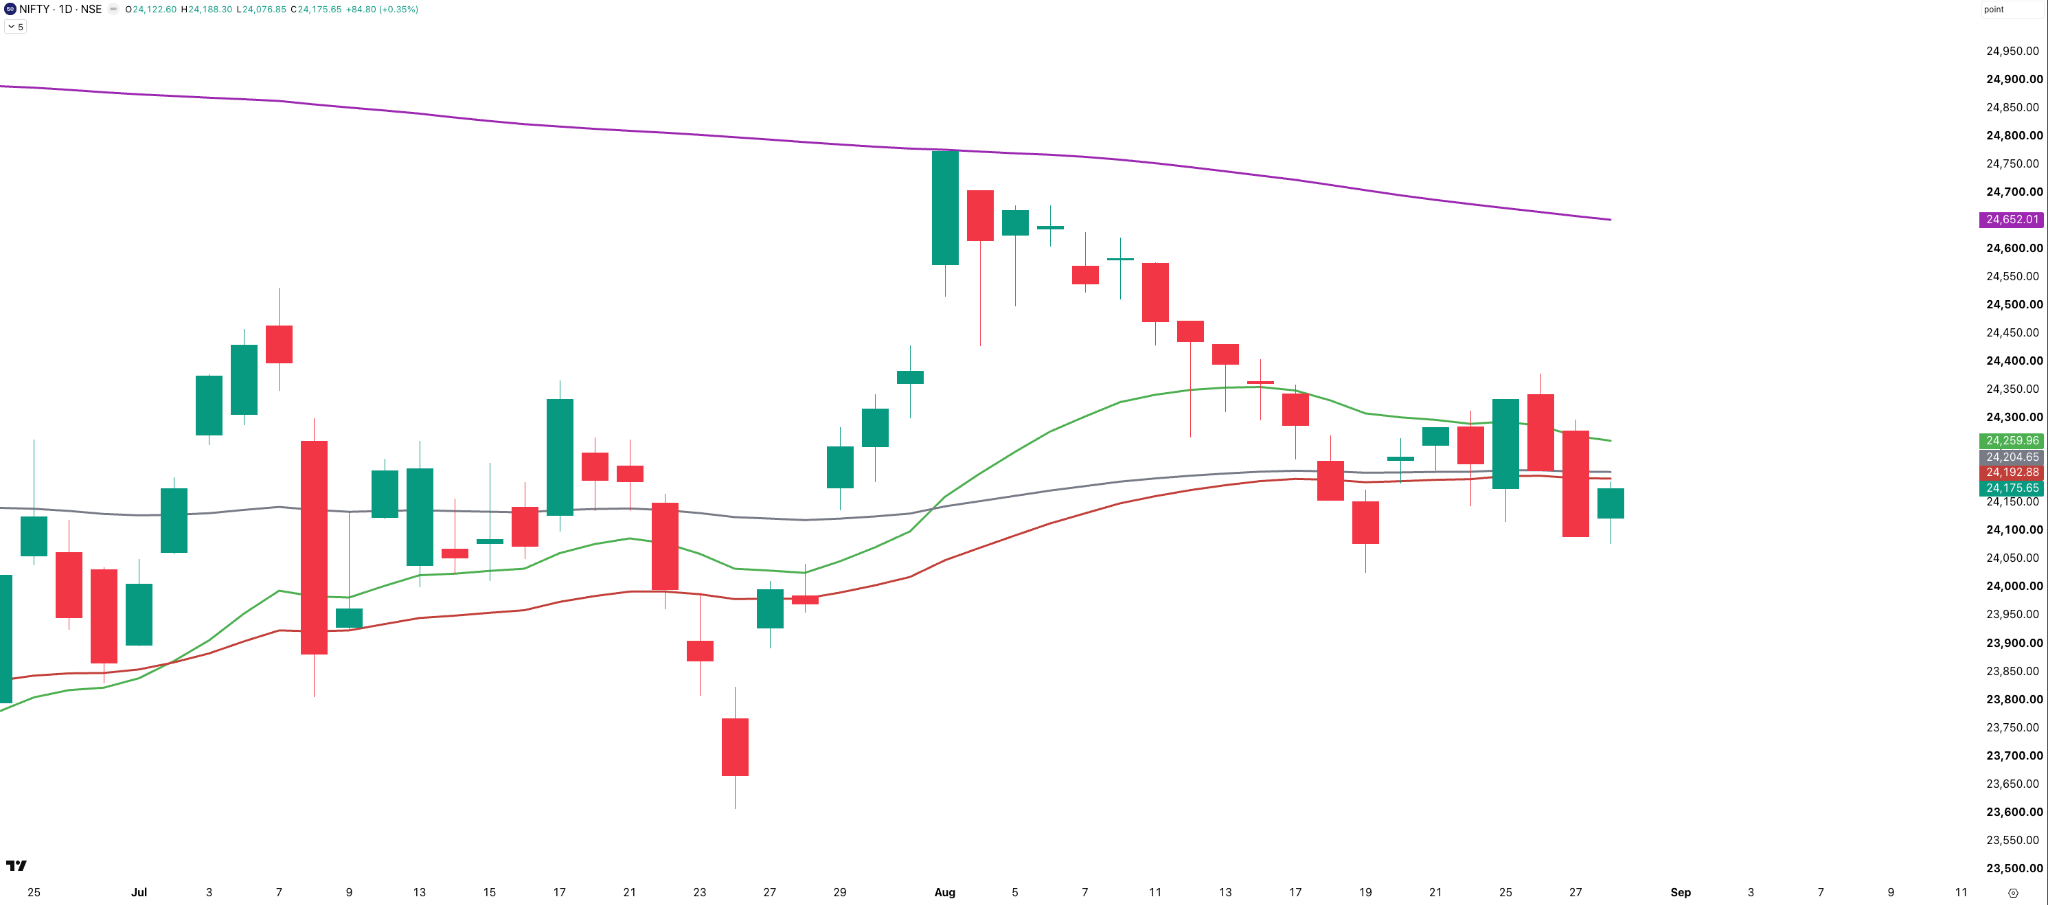
Looking at the daily moving averages, on Tuesday, NIFTY closed above all three key moving averages — the 21, 50, and 100-day EMA. However, by Thursday, it had breached all three. On Friday, the index was trading below all four key moving averages, including the 200-day SMA, which is currently around 24,650 .
Range — W35

Looking at the weekly ranges, NIFTY traded in a 302-point range , well below its 10-week average of 465 points. Friday was the quietest session with a range of just 111 points, while Tuesday and Thursday were relatively more active.
Overall, the daily and weekly ranges remain subdued, continuing the theme of low volatility and an index that isn’t really going anywhere.
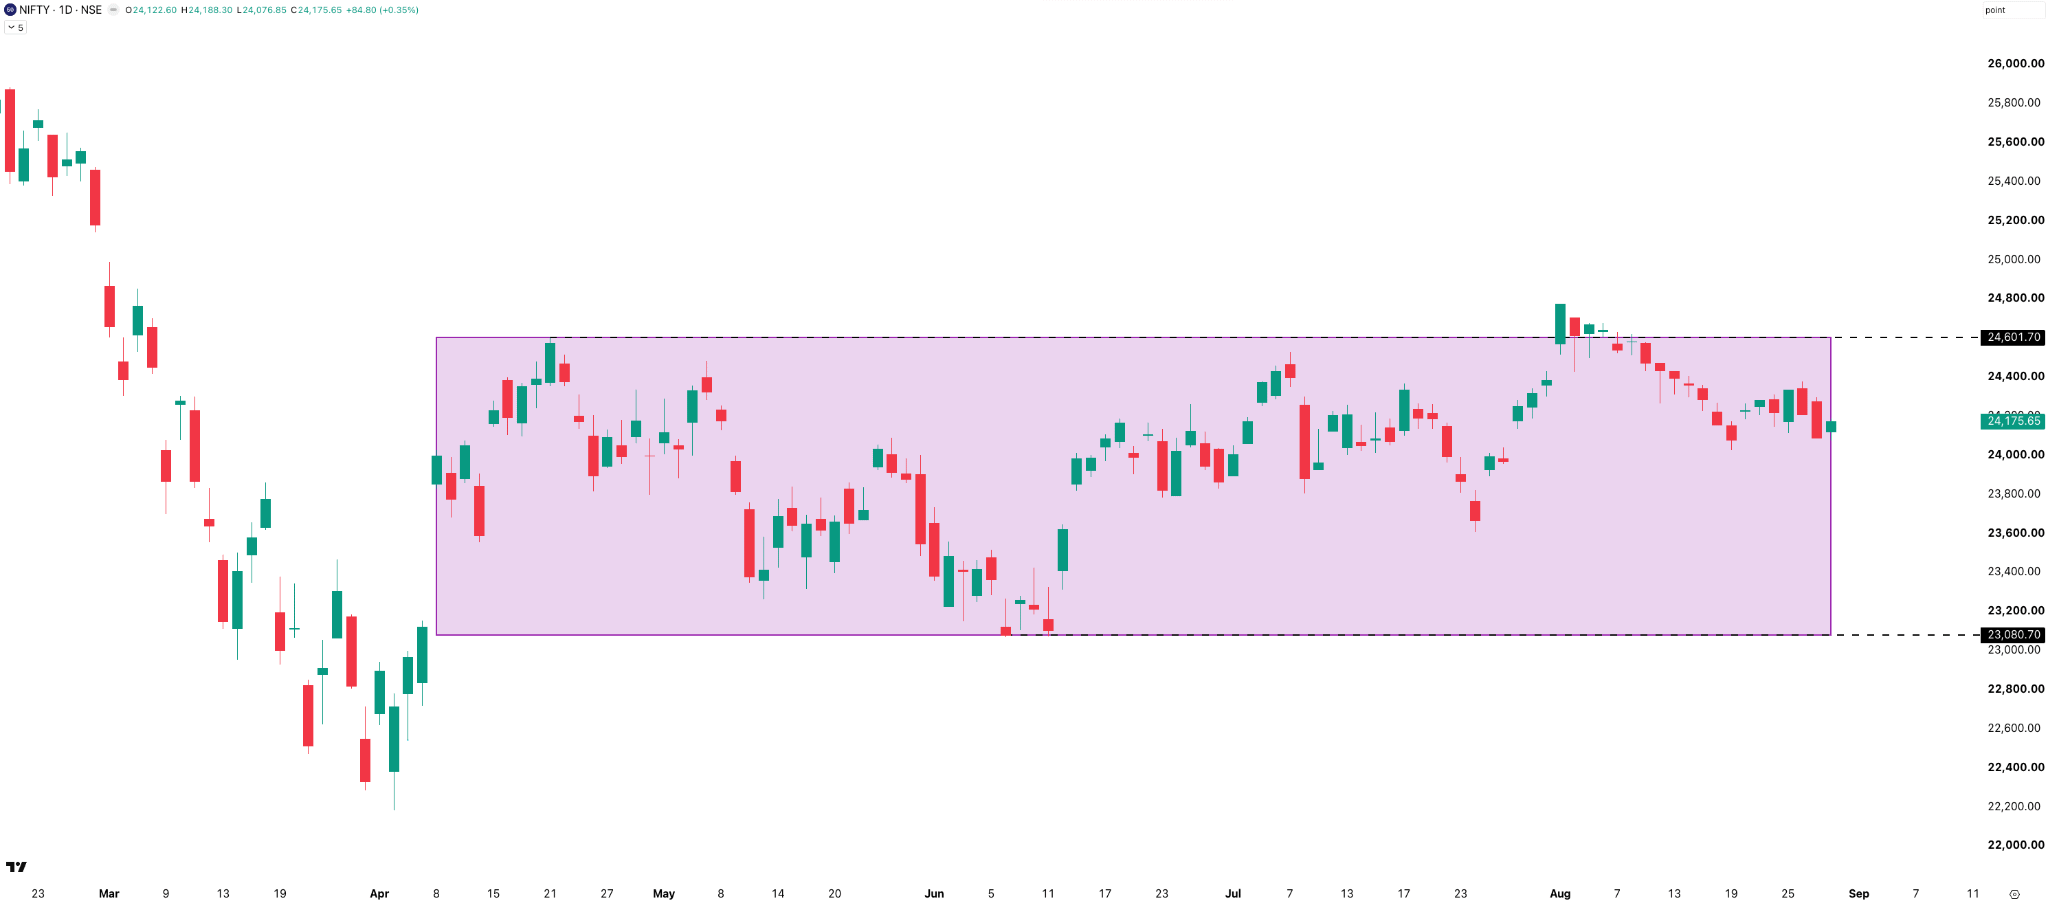
An update on the 1,500-point range we’ve been tracking over the past few weeks. NIFTY remained within the range this week.
And now, almost five months into this range, we’re still exactly where we started. Sometimes markets can get as frustrating as that.
NIFTY — Hourly
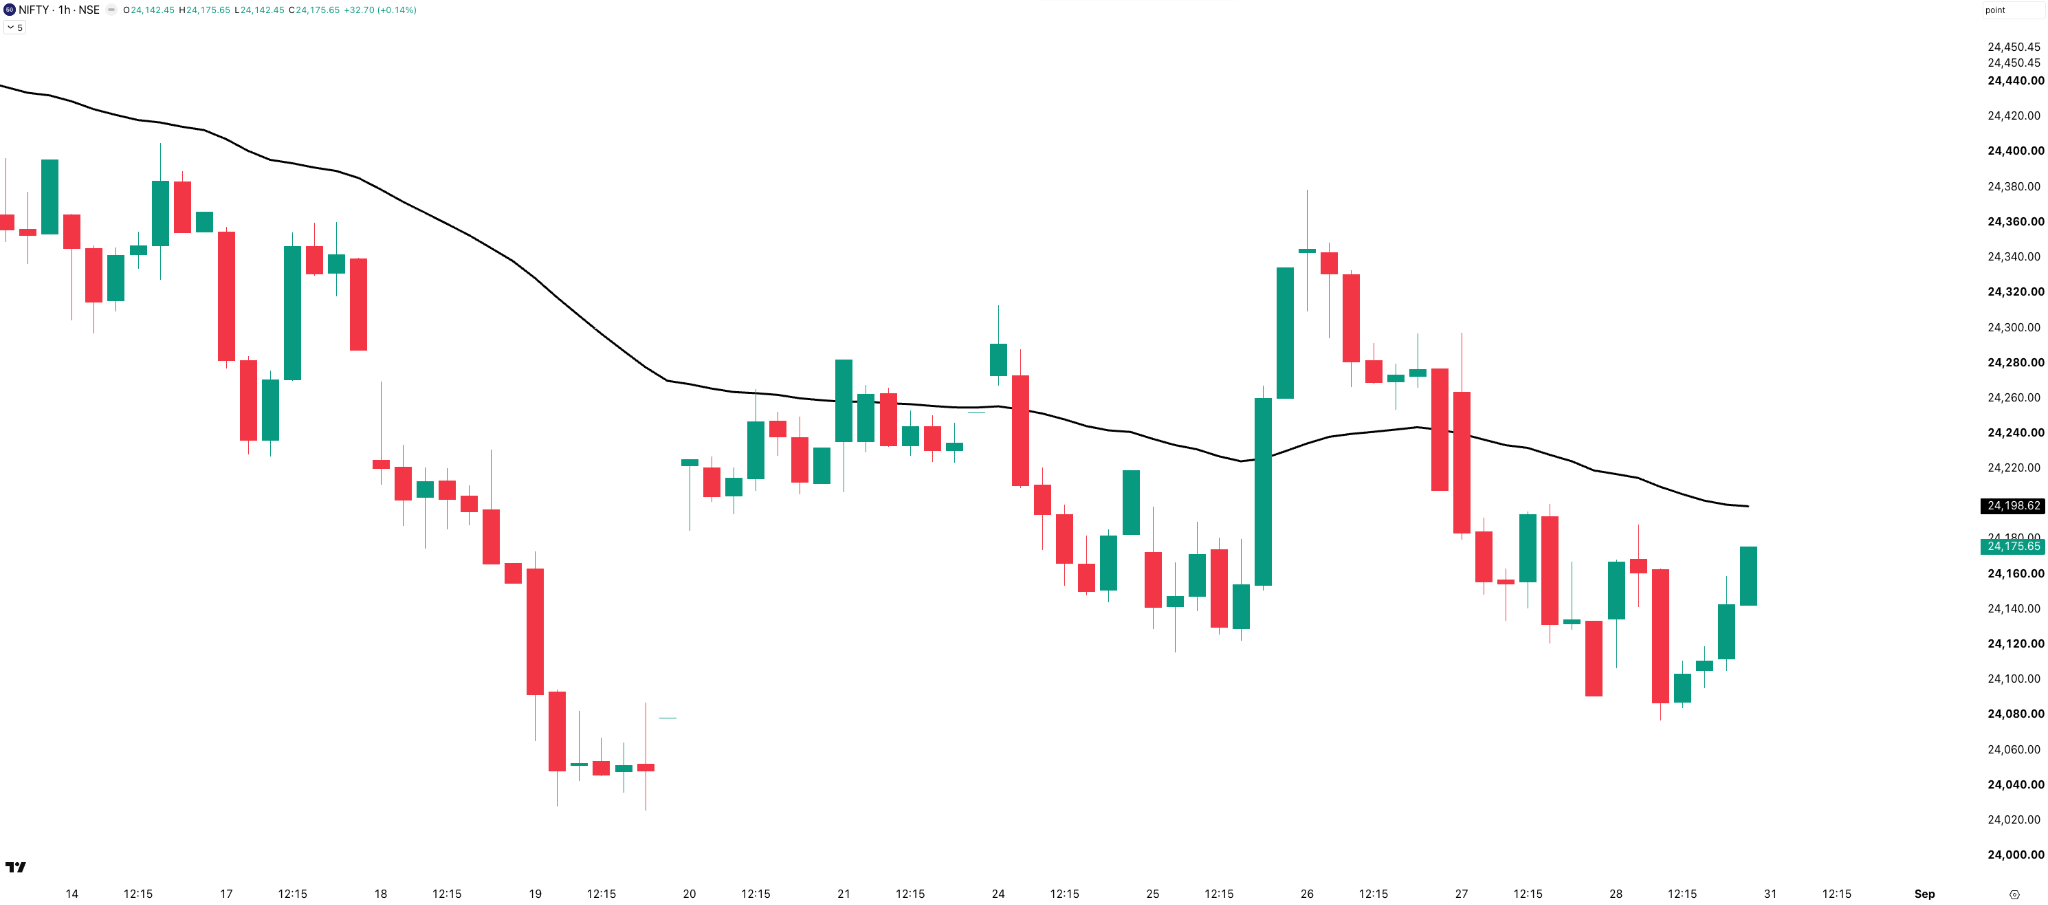
Looking at the hourly chart, NIFTY has remained below the 50-hour EMA for most of the week. There was a brief move above it on Tuesday, but the index quickly slipped back below and stayed there.
On Friday, NIFTY recovered from around 24,080 to close near 24,175, but it is still below the 50-hour EMA at around 24,200.
Monthly Expiry Recap
Talking about the NIFTY monthly expiry on Tuesday, August 25.
NIFTY traded in a relatively narrow 150-point range . The ATM straddle opened at 81 points and was still trading at 44 points at 3:15 PM, exactly the same as last week, before the market went into the CAS. The final closing price was 75 points above the 3:15 PM price.
I’m still not sure if this is the new normal for how premiums will behave under CAS. But if nearly half the premium is still left at 3:15 PM, taking trades after 3:15 is starting to look more like a gamble than a trade because you simply have no idea where the closing price will be.
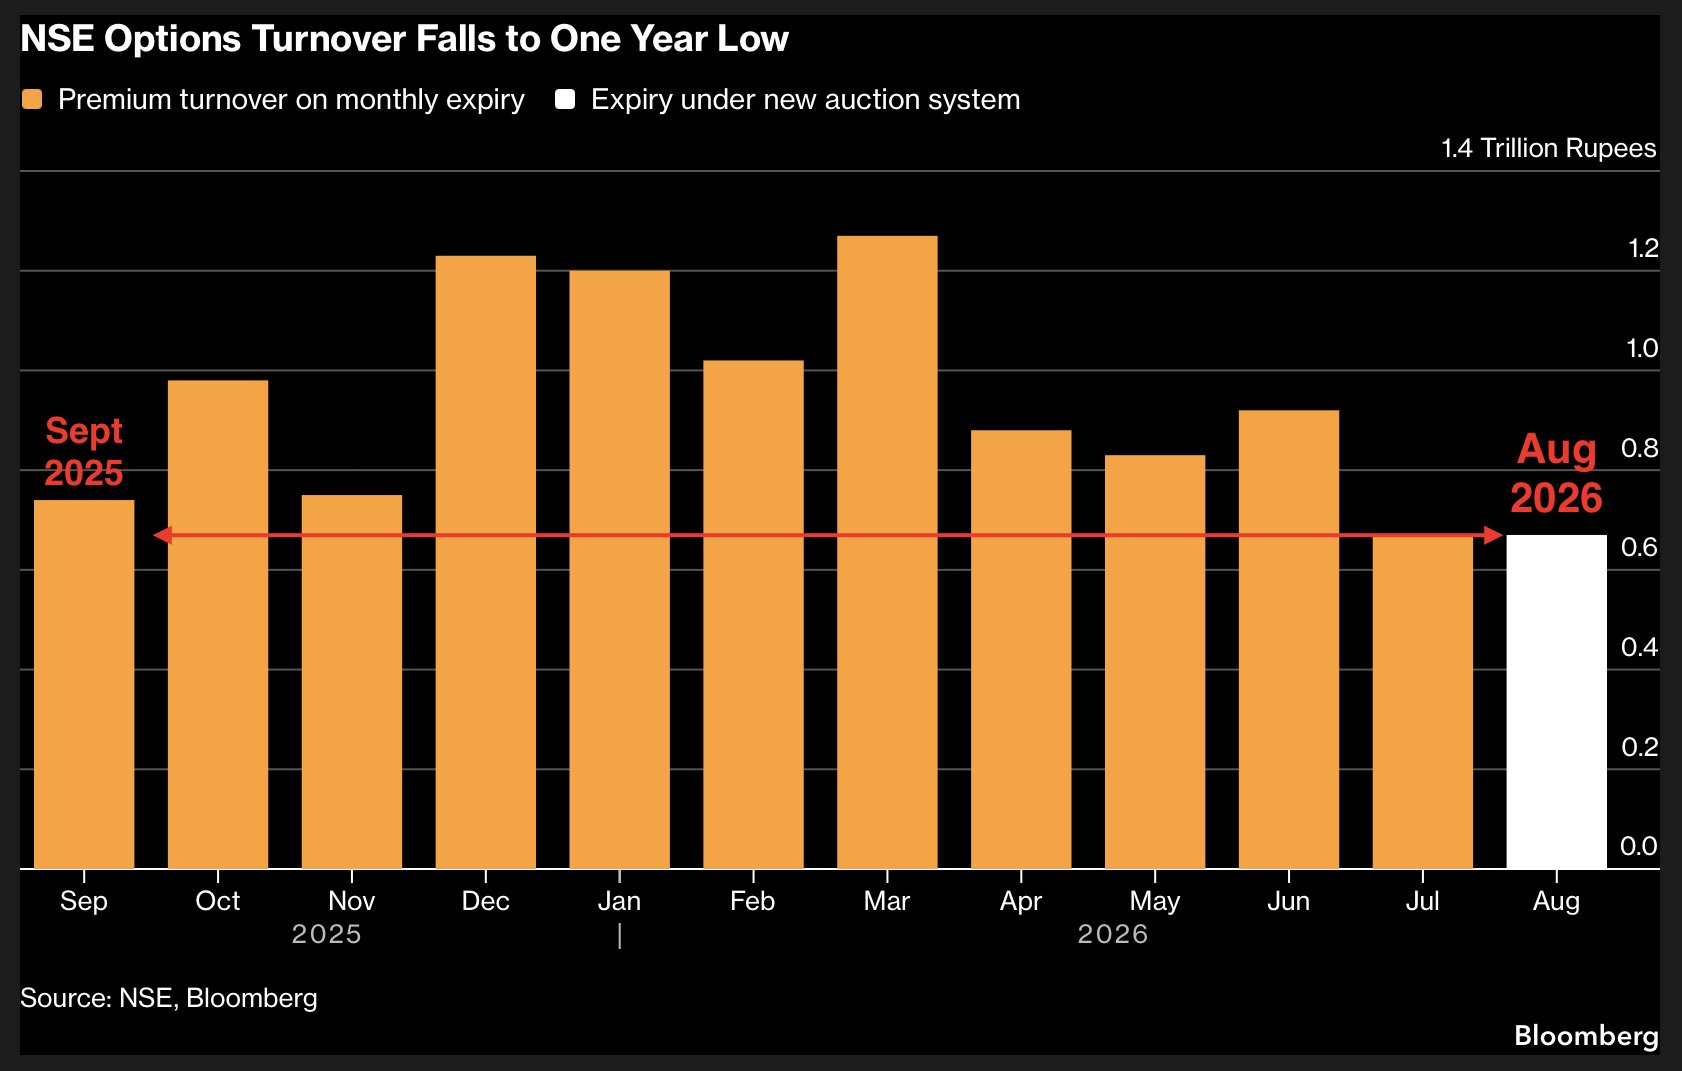
One interesting data point here: NSE options premium turnover on the monthly expiry day fell to a one-year low in August, at around ₹0.62 trillion.
So, along with the muted price movement and lower premiums we’ve been seeing, the overall options activity on expiry has also come down sharply. I do not know if it’s because of CAS.
On the SENSEX monthly expiry on Thursday, August 27, the index traded in a range of 606 points , while the ATM straddle opened at 264 points, almost the same as the previous SENSEX expiry.
At 3:15 PM, the straddle was still trading around 140 points. Then came the CAS move discussed at the top of this edition. The straddle spiked to around 300 points during the CAS window, which was actually higher than where it opened, just minutes before the close.
The final CAS closing price was 249 points below the 3:15 PM price.
Section Two — What to Expect in the Coming Week
Looking ahead, the picture remains fairly range-bound.
On the weekly chart, 24,600 remains the key resistance, while 24,000 is the immediate support. NIFTY is still stuck in the broader 1,500-point range we’ve been tracking since April, and this week’s price action hasn’t changed that picture.
The daily chart also looks cautious, with NIFTY currently trading below all four key moving averages. On the hourly chart, the index remains below the 50-hour EMA, so the short-term trend is yet to turn positive.
Looking at the straddle premium to gauge the expected range for the upcoming weekly expiry on Tuesday, Sep 1:
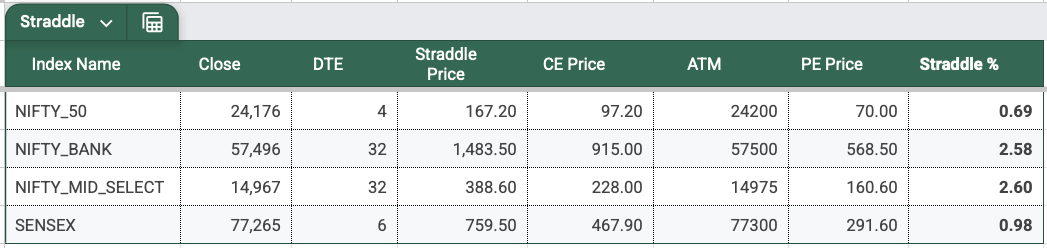
The NIFTY ATM straddle is trading around 167 points , implying an expected move of roughly ±167 points from the 24,176 level. That gives us an expected range of approximately 24,009 to 24,343 going into the expiry.
India VIX
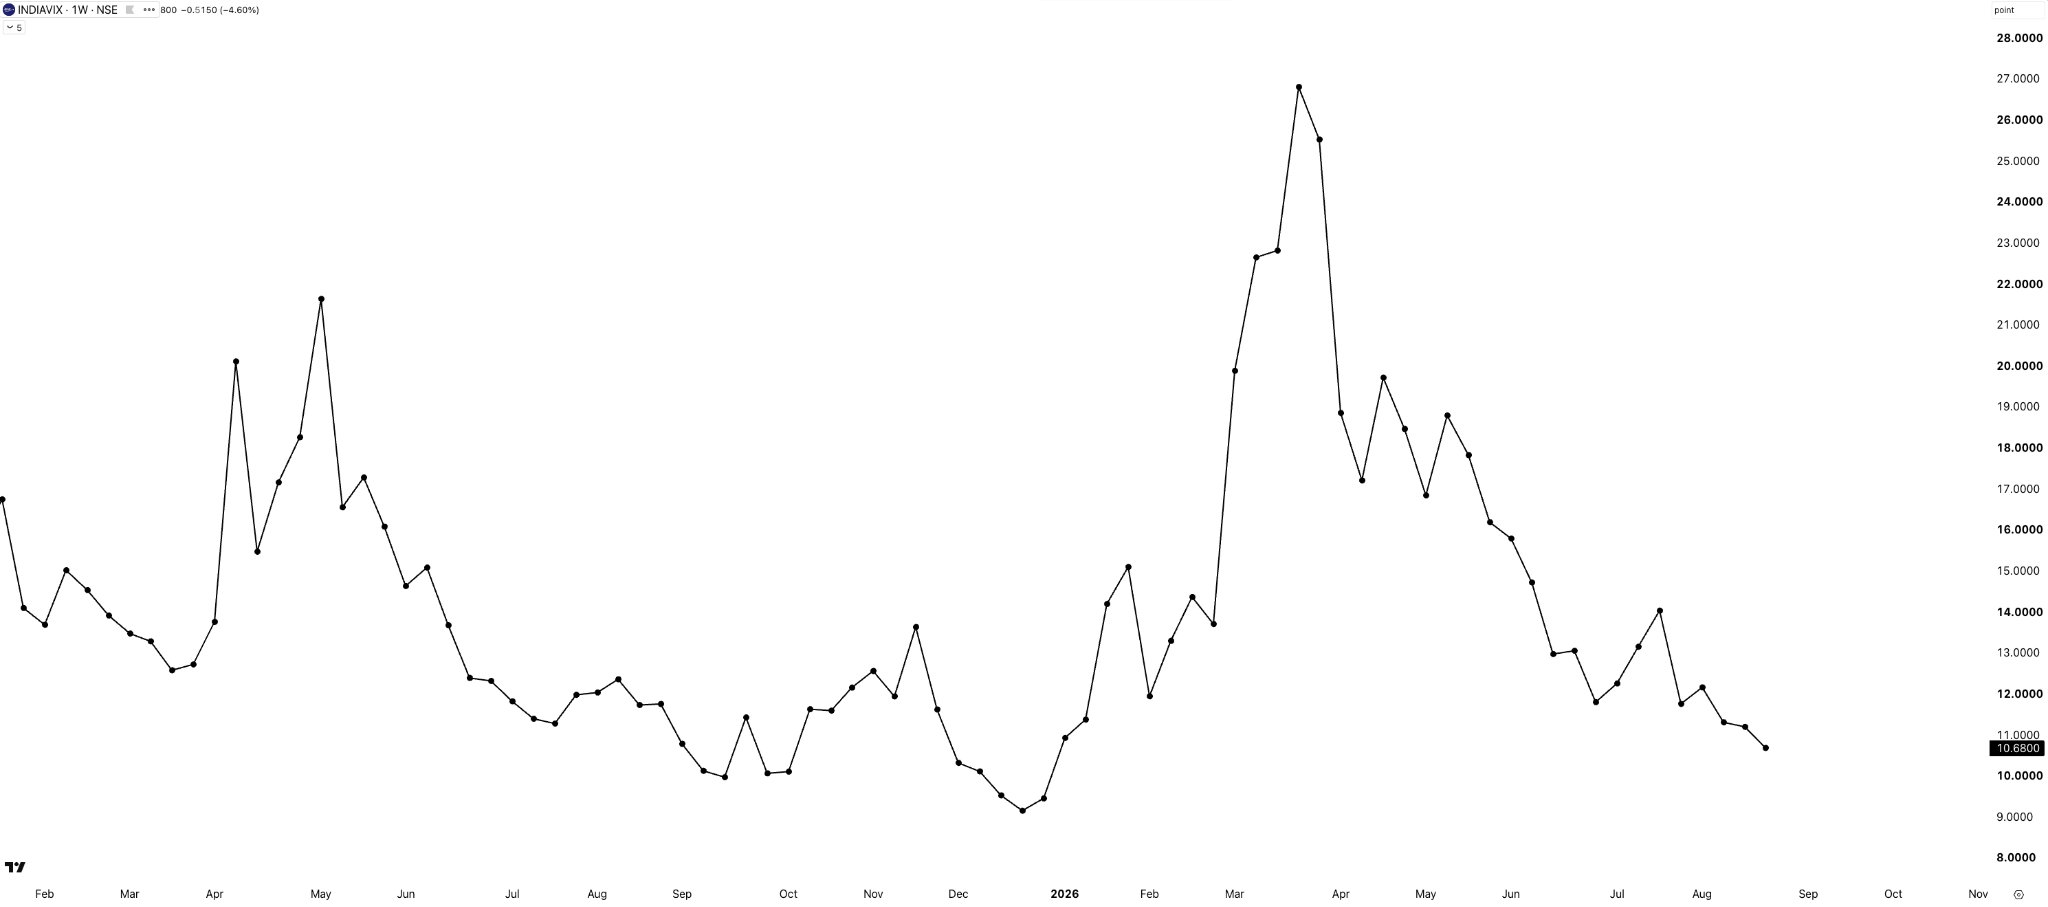
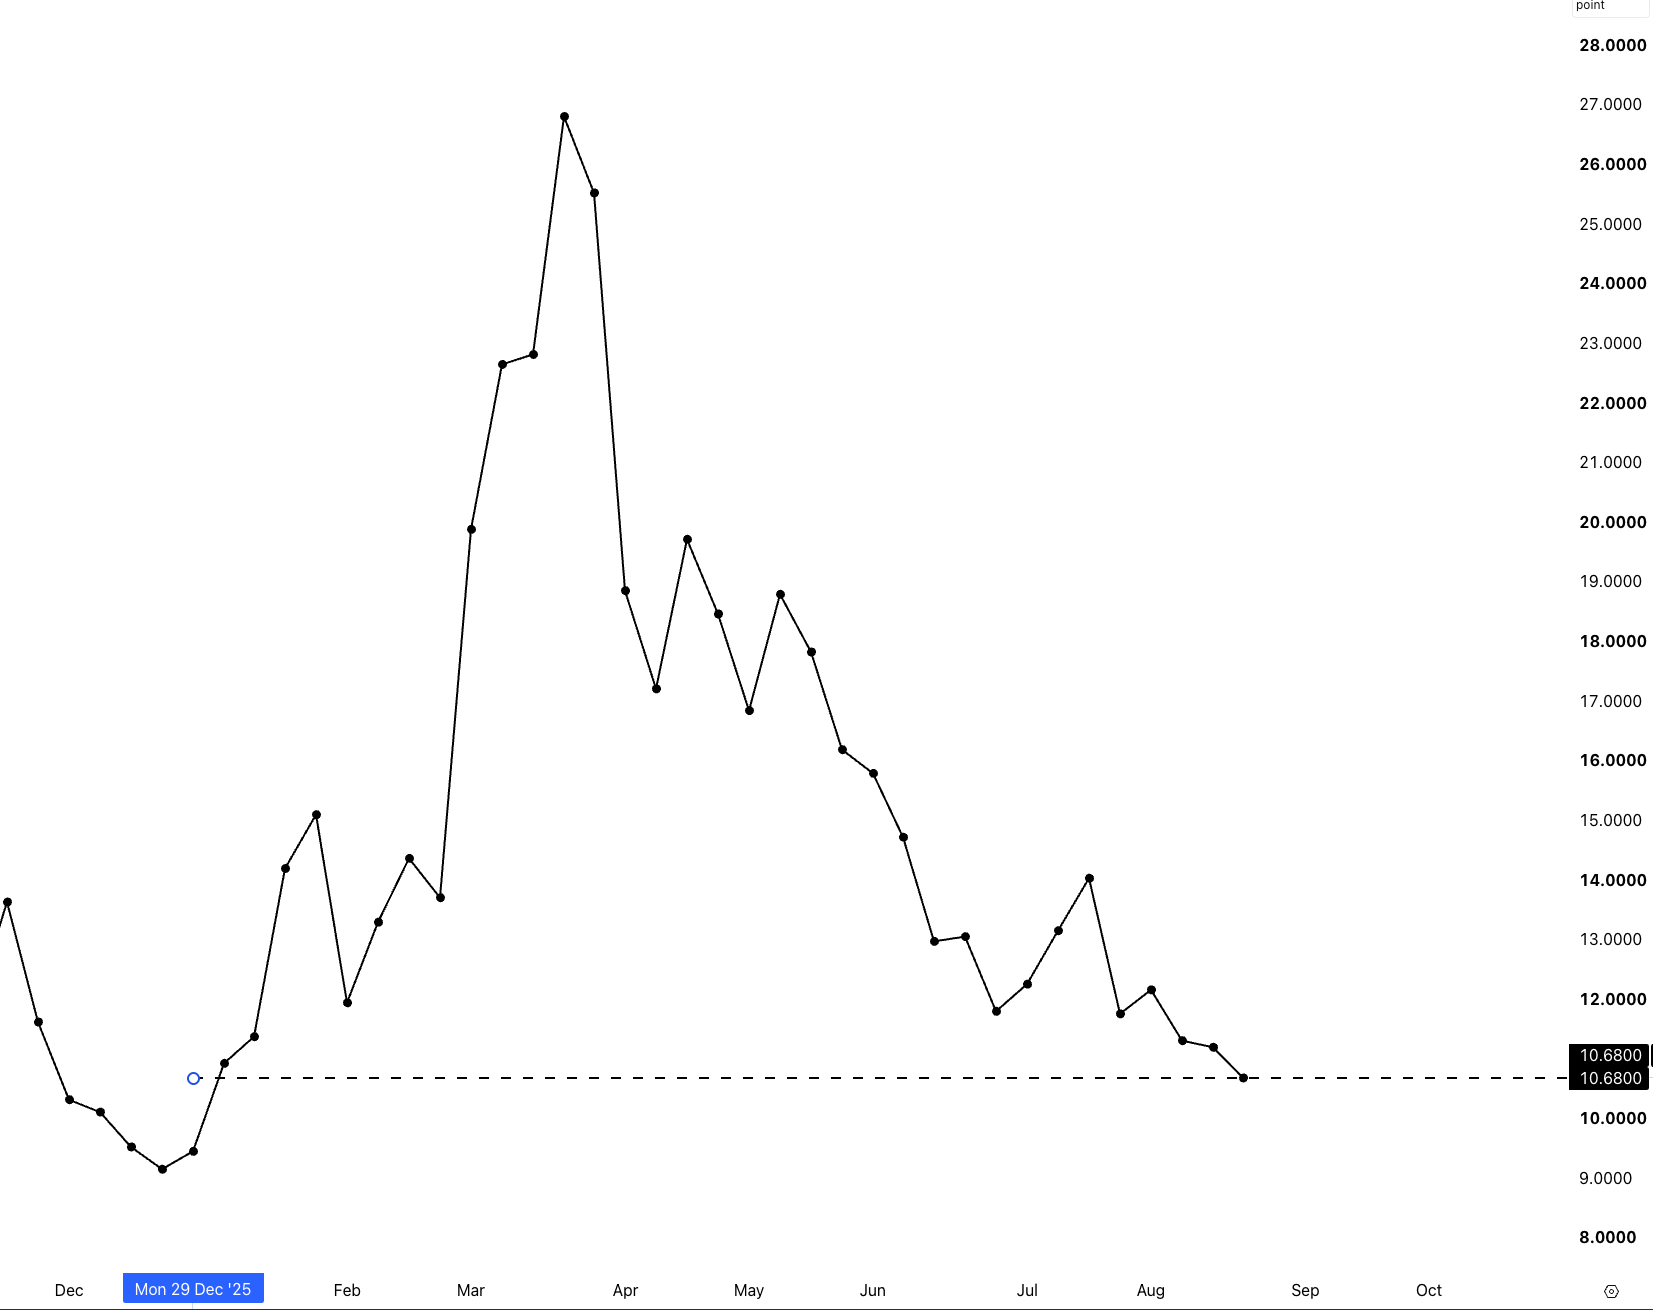
India VIX continued to decline this week, closing at around 10.7 , its lowest weekly close of 2026.
Option premiums continue to reflect the same low-volatility environment, with expected moves remaining relatively compressed and daily and weekly ranges staying shallow.
Sectors
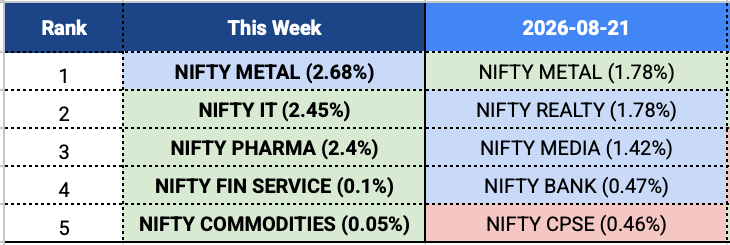
Coming to the sectoral performance, NIFTY METAL led the pack this week, gaining 2.68% , followed by NIFTY IT at 2.45% and NIFTY PHARMA at 2.4%. NIFTY FIN SERVICE and NIFTY COMMODITIES also made it into the top five, although with much smaller gains.
Moving on to the TJI sector baskets, Sugar’s out, and Wires & Cables is in at 5.8%, a consistent sector for a while now.
Tiles at 5.5% is a new entrant, and then we have Metal Pipes again this week at 4% — last week it was up 5.6%.
Then we have Dyes and Pigments and IT Midcap at 3.5 and 3.4% each.
Standouts are Wires and Cables and Metal Pipes for their year-long consistency.
W35

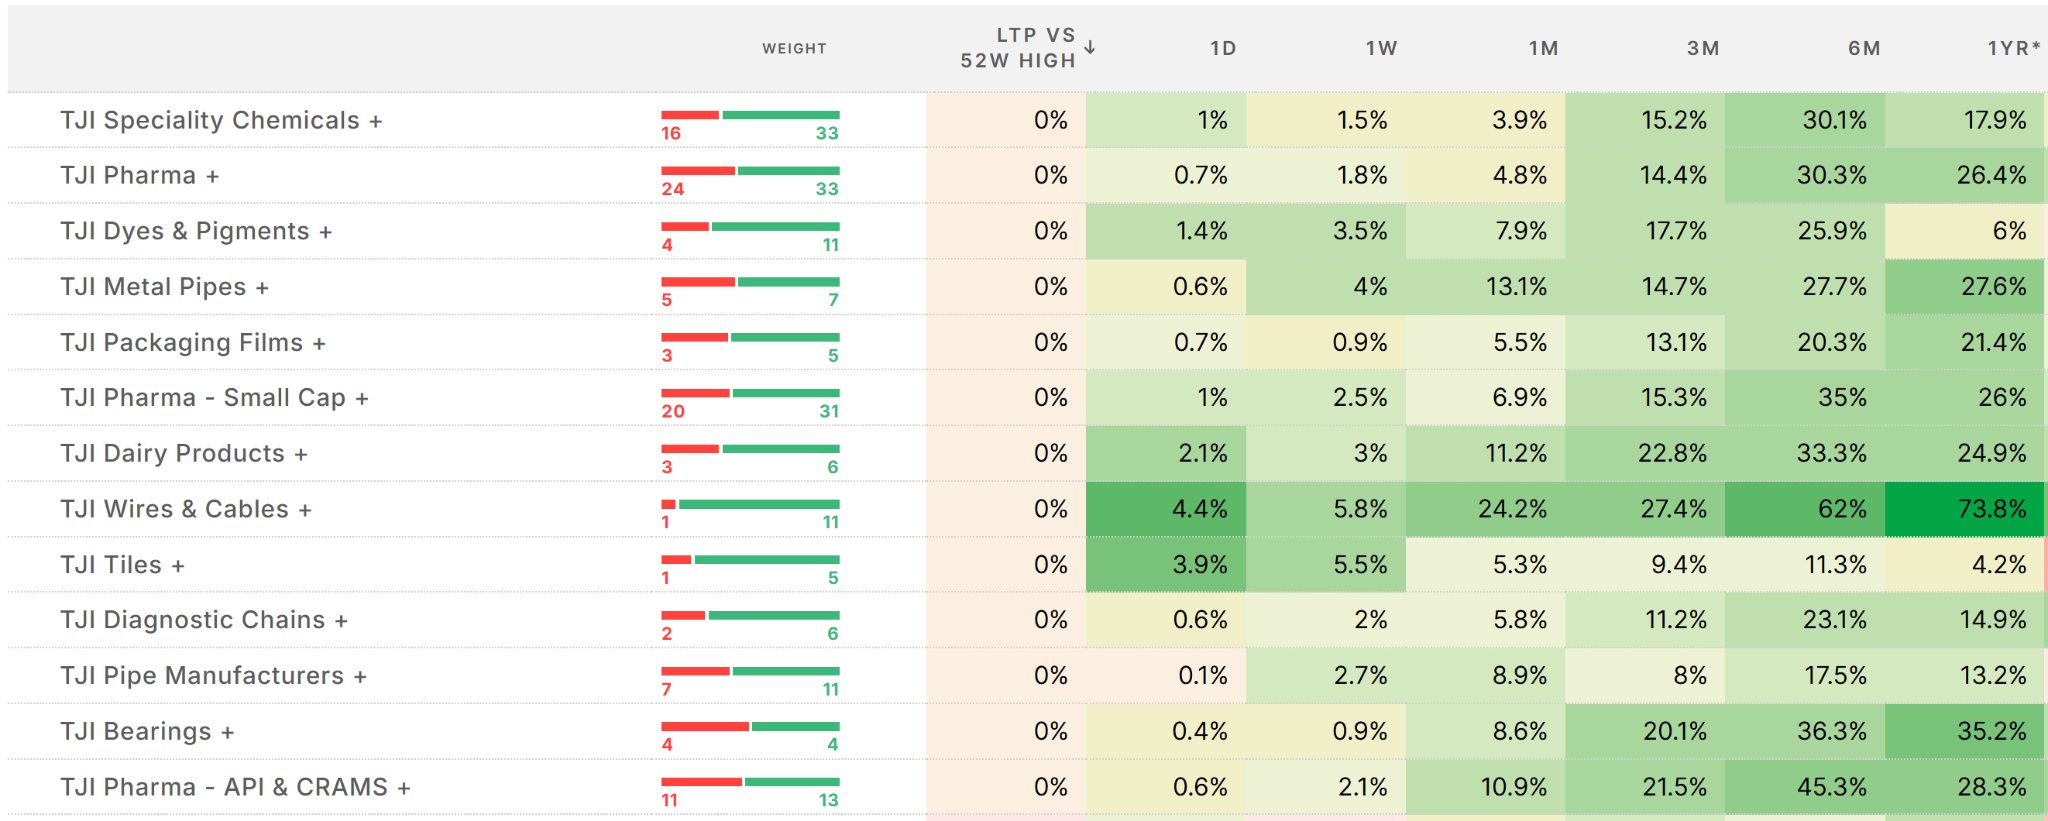
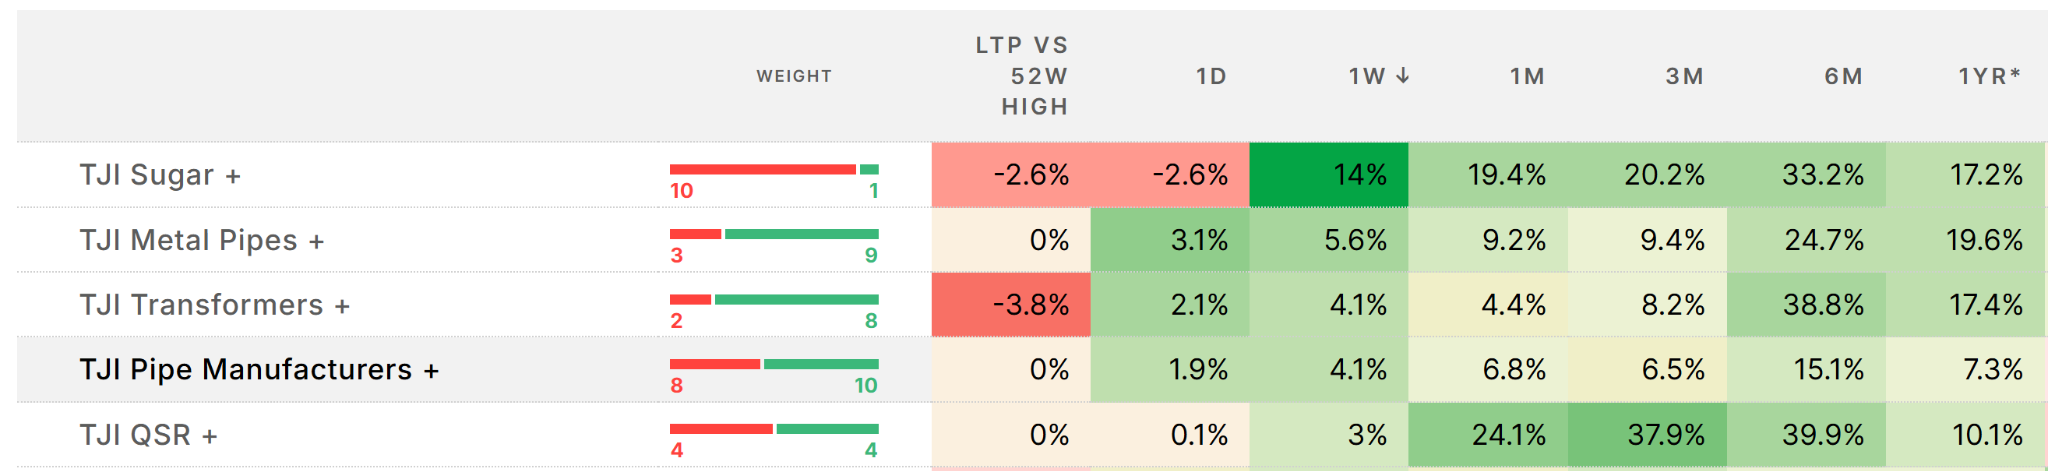
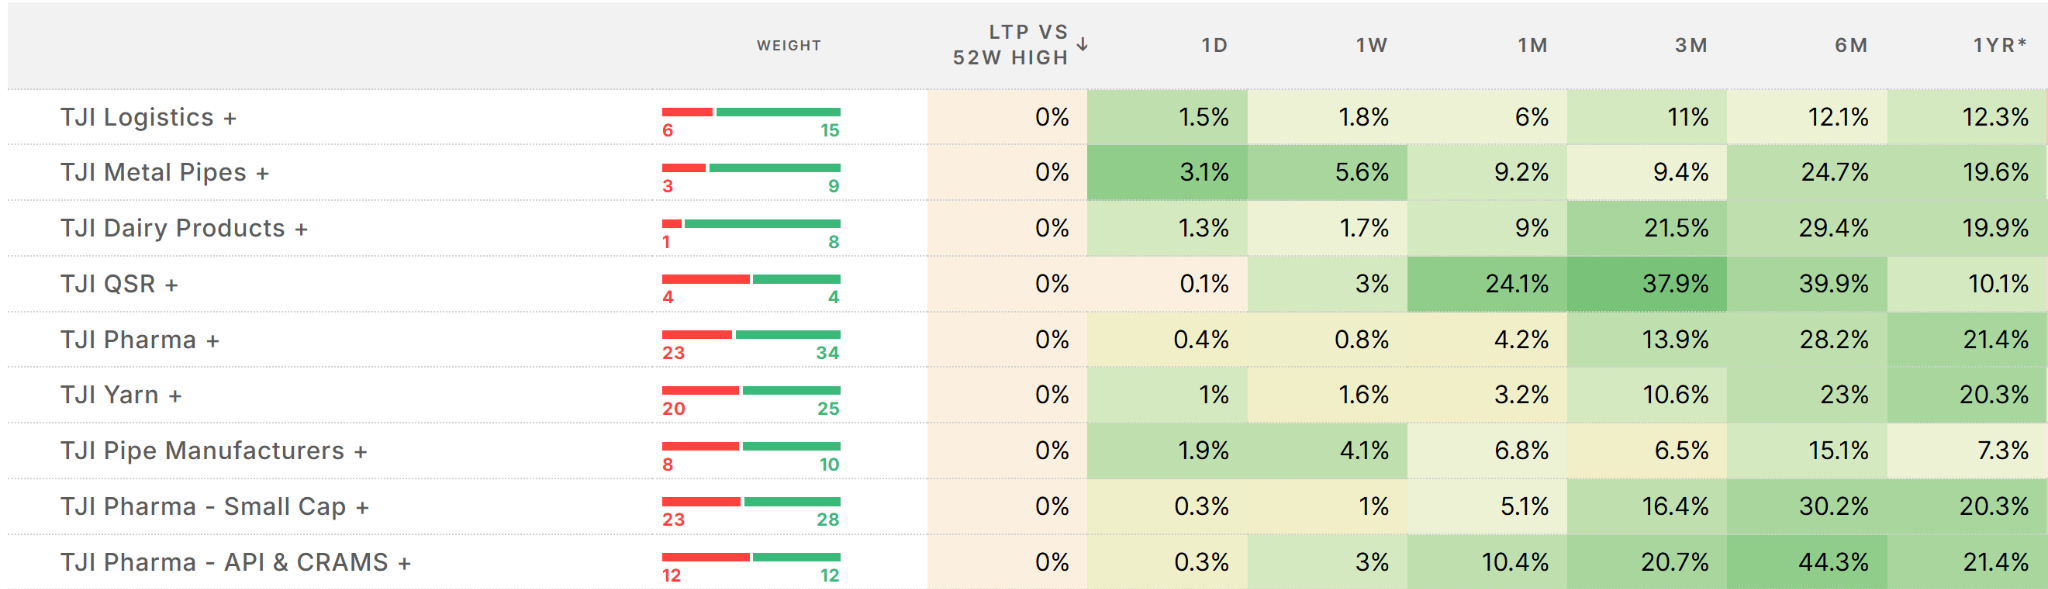
Let’s now look at the sectors at their 52W high. Breadth has improved compared to last week, which had 10 baskets — this week we have 13 baskets at their 52W high.
In terms of standout baskets, as you can see, there is a fair bit of pharma and healthcare in terms of diagnostic chains, the pipes, metals, or otherwise, and lastly wires and cables.
That’s all for sectors this week.
Commodities
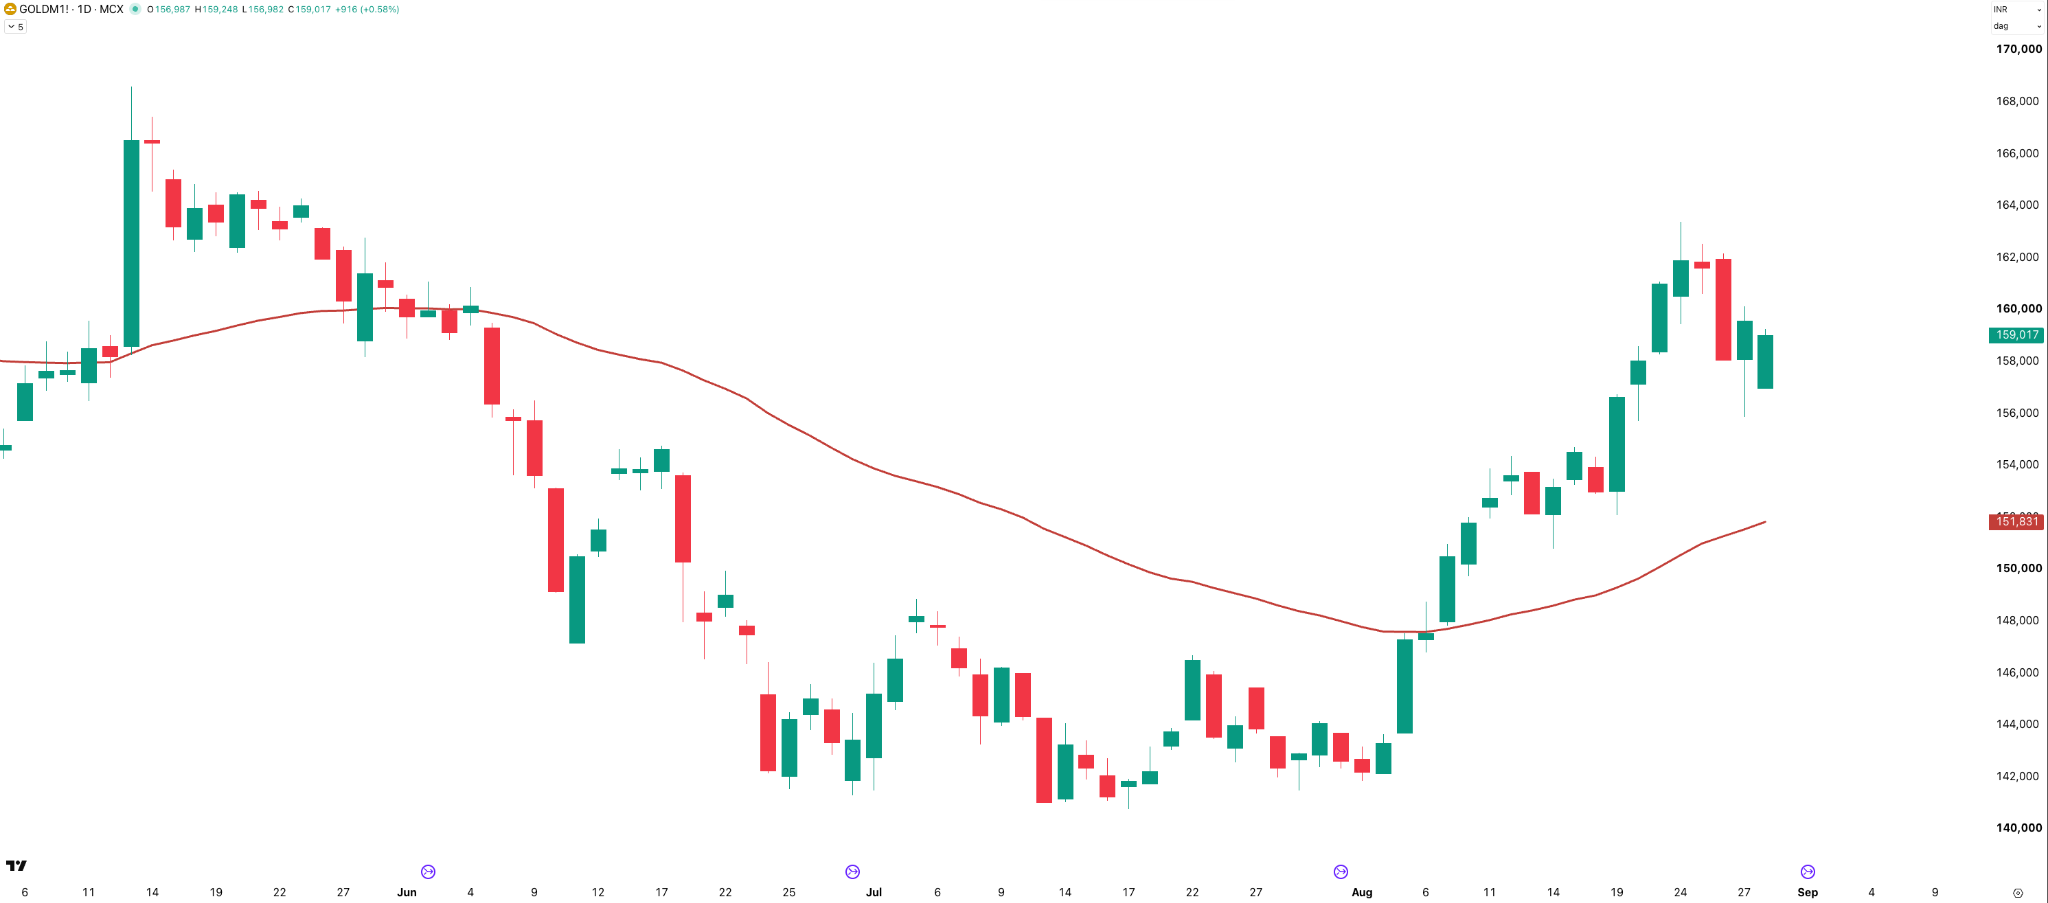
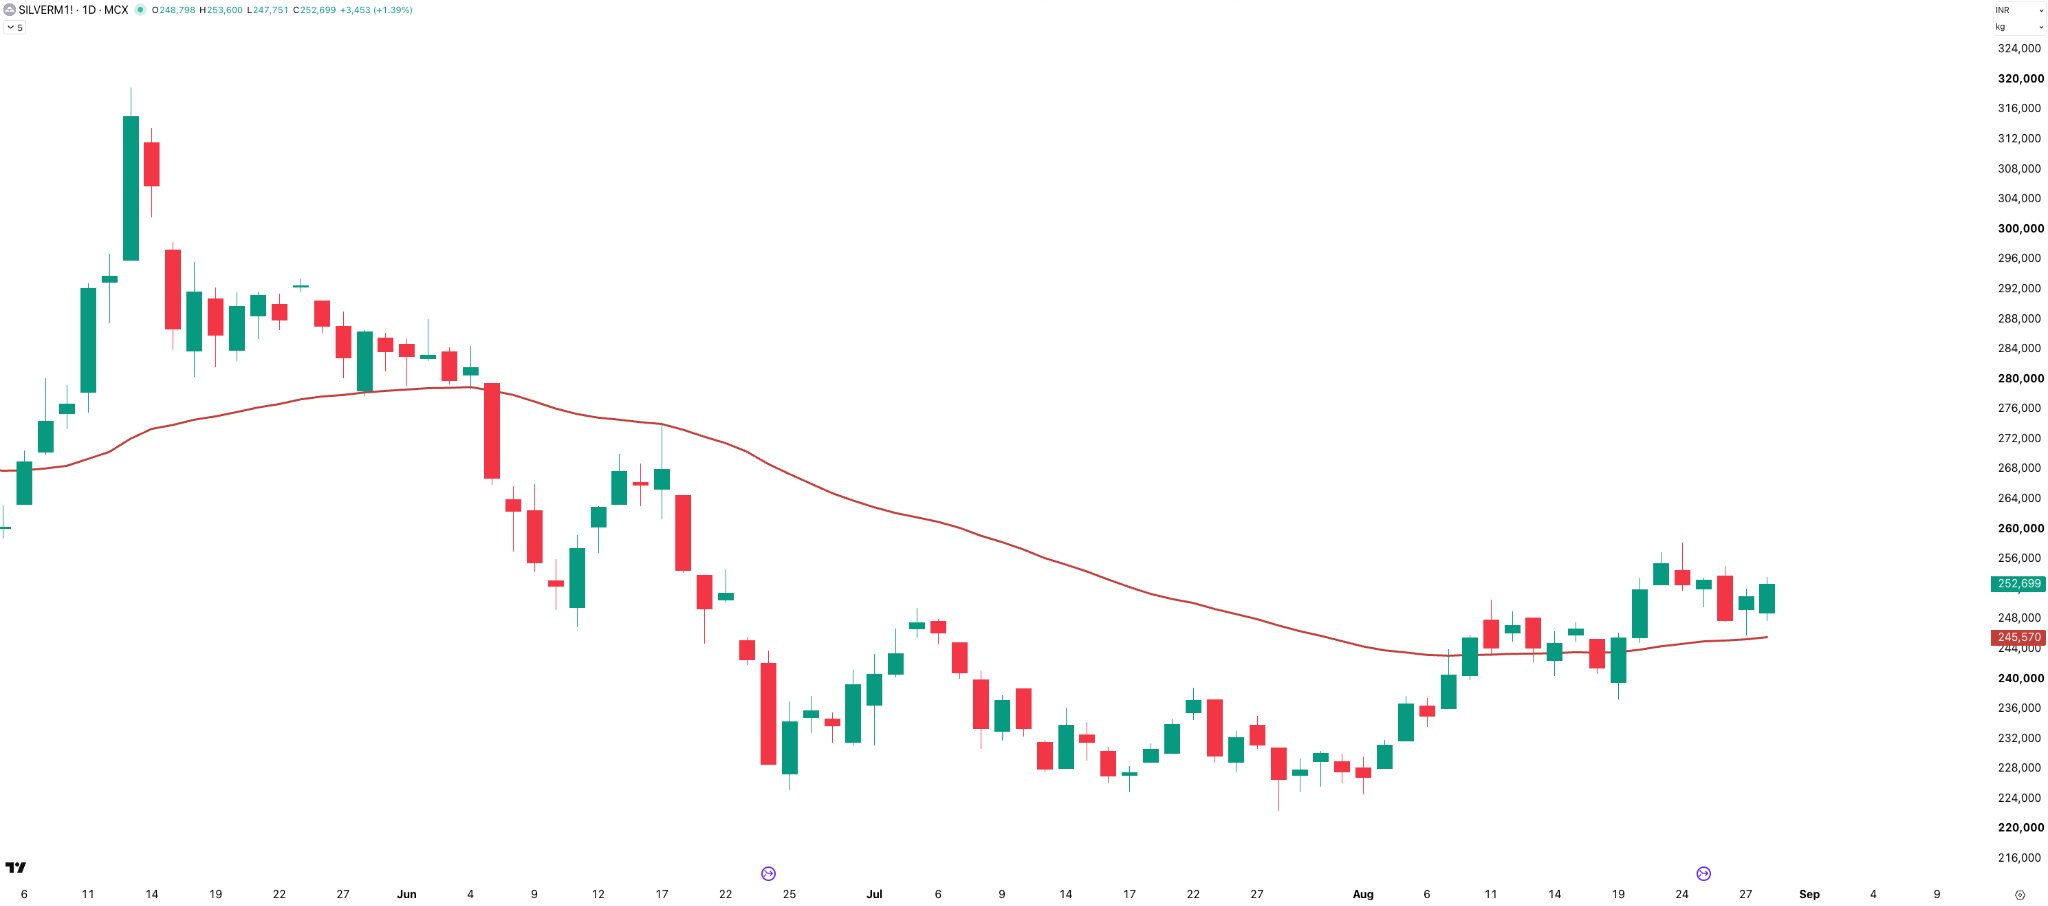
Looking at GOLDM and SILVERM on charts:
After last week’s sharp rally, Gold and Silver saw some pullback this week, with both sliding as much as 2% amid expectations of a cut in import duties.
However, the broader trend remains intact, with both metals continuing to trade above their 50-day EMAs. Gold is currently around ₹1,59,000 , versus its 50-day EMA at ₹1,51,800, while Silver is at ₹2,52,700 , against its 50-day EMA at ₹2,45,570.
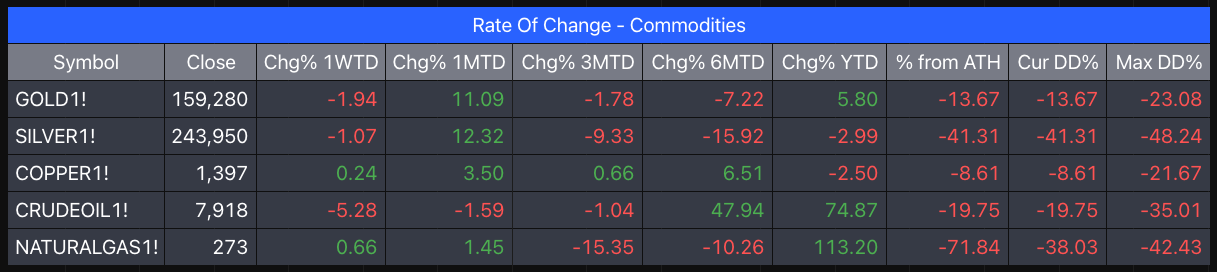
Looking at the broader commodities basket, Gold and Silver pulled back this week, falling 1.9% and 1.1%, respectively. Crude Oil saw the sharpest decline, down 5.3%, while Copper and Natural Gas managed to gain modestly.
Looking at the broader commodities basket, Gold and Silver pulled back this week, falling 1.9% and 1.1% respectively. Crude Oil saw the sharpest decline, down 5.3%, while Copper and Natural Gas managed to gain modestly.
On a YTD basis, Natural Gas remains the strongest performer at 113.2% , followed by Crude Oil at 74.9%. Gold is up 5.8% for the year, while Silver and Copper remain in negative territory.
Wrapping Up
So, to sum it all up, it was another quiet, range-bound week for NIFTY, with 24,000 holding as support and 24,600 continuing to cap the upside. Volatility remains subdued, with India VIX at its lowest weekly close of 2026 and option premiums reflecting the same.
The bigger story remains CAS, with the sharp SENSEX move during the closing auction raising fresh questions around liquidity and price discovery. Meanwhile, gold and silver pulled back after last week’s rally, but both continue to hold above their 50-day EMAs.
For now, the market remains stuck in the same range, volatility remains low, and CAS remains the big thing to watch.
What Caught My Attention This Week
Moving on to what caught my attention this week. Three picks this time — one closer to home, two that zoom all the way out.
- First , staying with our sugar theme: an edition of Daybreak, The Ken’s daily business podcast, on India’s decade-long sugar rush.We’ve been a sugar-exporting country - one of the largest exporters- and now, for the first time in roughly a decade, India is importing sugar again. Daybreak explains what really happened. How did we get to this point?
 Daybreak — The Ken (Spotify)
The next two recommendations are on the current state of Geopolitics - the two go together, because they wrestle with the same question — what happens now that the old world order has come apart?
- The first is an FT essay by Alec Russell, titled “The new world order? Every man for himself.” He argues that with America no longer championing democracy, autocrats everywhere feel emboldened, from Zimbabwe to Sudan, while China fills the vacuum.
- The second is the Indian take — edition four of Watching the Wheels, the new show from Amit Varma, Shruti Rajagopalan and Pranay Kotasthane. Watching the Wheels — Episode 4 (YouTube)
Pranay lays out a few frameworks to think clearly about the disorder. Its one long freewheeling chat, totally worth your time. FT: The new world order? Every man for himself.
Events to Watch Next Week
Now, over to the events to factor in for the coming week.
- There are no market holidays next week.
- Monday, August 31 is an important day, with the MSCI rebalance taking place, and NIFTY is at 1DTE; let’s see how the premiums behave.
- We also have the Q1 GDP growth numbers coming out post-market on Monday, so that will be one more thing to watch.
And finally, Zerodha turned 16 this month. We have put out an interesting update on the business and the state of the markets, which I’ll link in the show notes. Do read it.
Zerodha: 16 Years of Zerodha — Fresh Enthusiasm
That’s pretty much it for the week.
If you find this series useful, don’t forget to subscribe to the channel - and yes, do share it with your friends.
Until then — stay curious, stay steady, and enjoy your weekend.