Hello and welcome to Weekly Market Metrics. I’m Sandeep Rao, and we’re in Week 37 of 2026. We are back at it again.
Yemen’s war has reignited, with the Houthis pushing towards the Bab al-Mandeb Strait — a vital Red Sea chokepoint — fighting the Saudi-backed government. Alongside the wider US-Israel war on Iran, tensions also flared up again with US strikes on Iranian oil tankers and Iran restricting passage through the Strait of Hormuz, making Bab al-Mandeb the next pressure point. All that instability in the Middle East pushed Brent crude past $100 a barrel for the first time since July.
Closer to home, New Delhi is getting a facelift ahead of the 18th BRICS summit this weekend. I actually have a recommendation towards the end — a podcast that touches on the lessons from the 2003–2005 BRICS investment theme. More on it later.
Moving on to the monsoon — well, it isn’t cooperating either. India’s rainfall deficit has widened through the first half of September, pretty worrying to say the least.
There’s a silver lining though: net SIP inflows hit a record high this year, and the NSE is finally getting ready for its own IPO.
But all in all, the markets haven’t taken it well. Nifty is down roughly 2% from last week, closing at 23,400 on Friday. And yes — I’ve run some specific analysis on where Nifty stands right now and what to expect. Honestly, not the most upbeat picture, but worth a look.
With that, let’s get into what happened last week and what we expect in the coming week.
How Long Has NIFTY Been Below the 200-Day SMA?
If you’ve been following Weekly Market Metrics, you know Nifty has been under the 200-day SMA for a while now. So, me being me, I looked up how long we’ve been under it, and how many such instances have happened in the past. We don’t have a very long history of the markets, but still no harm in looking at what we do have.
I looked at all the past periods when NIFTY stayed below its 200-day SMA for an extended period — extended as in more than 100 days. The current episode started in February 2026 , and NIFTY has now spent 196 calendar days below the 200-day SMA. That makes this the fourth-longest such stretch since the post-2008 era.
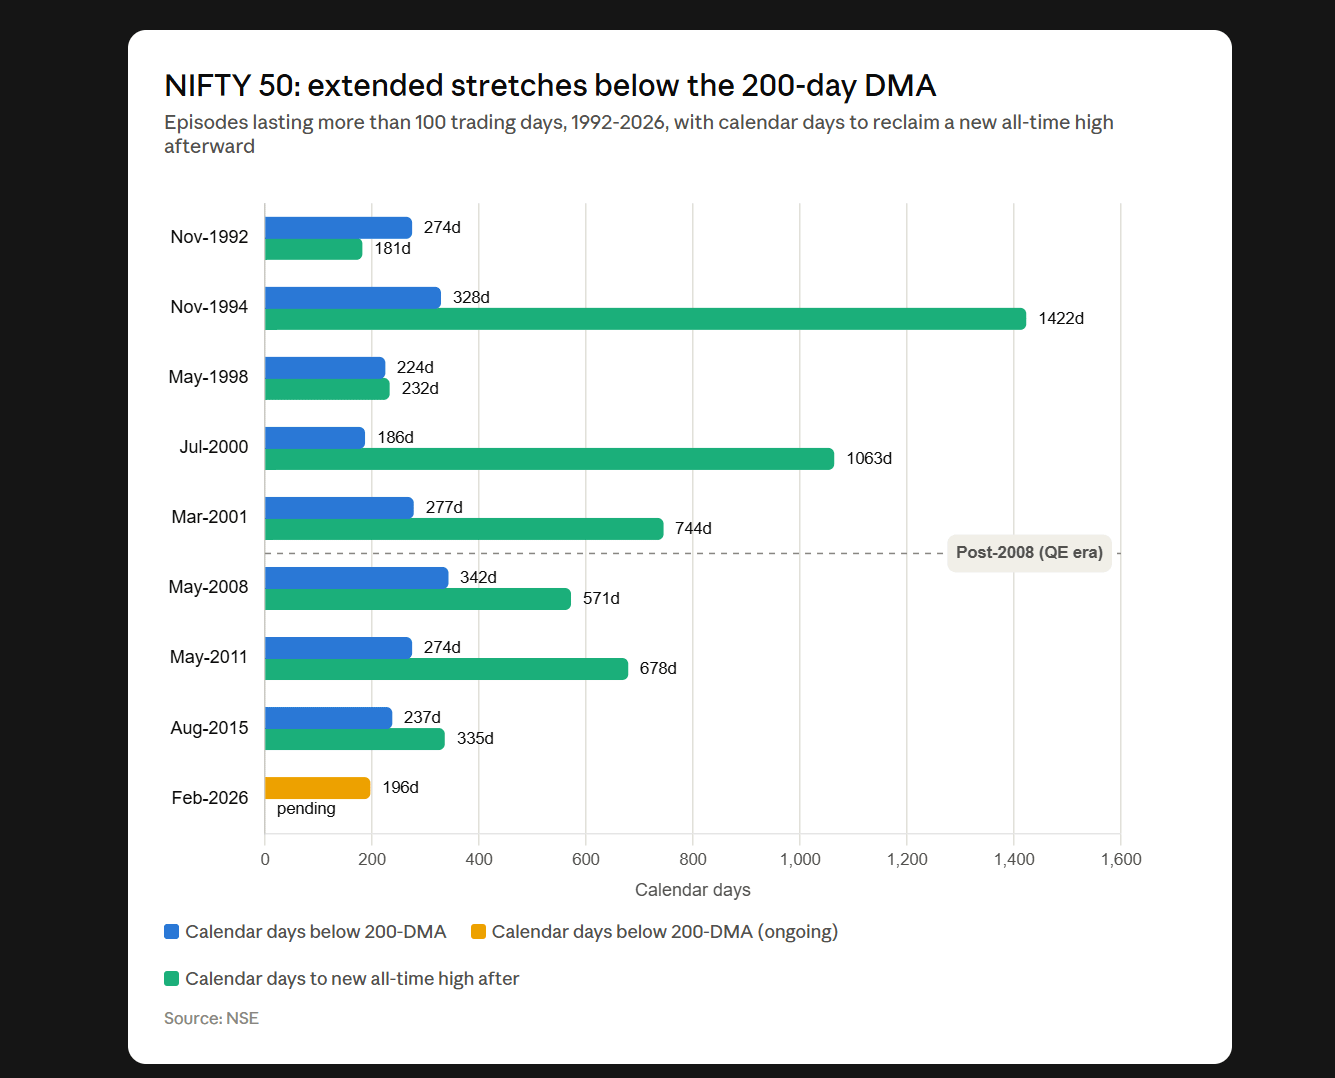
Historically, it has taken around 528 calendar days on average to make a new all-time high after these extended periods below the 200-day SMA — roughly 1 year and 5 months. I’m not trying to scare you here; I’m just putting the data in front of you. Maybe we’re in for a long winter — worth remembering that NIFTY has delivered no or negative returns over the last two years, so far. Of course, this doesn’t tell us what happens next, but it does give us some perspective on how long these periods of weakness can sometimes last.
Section One — Weekly Recap
Rate of Change (ROC)

NIFTY 50 had the weakest week, falling 2.1%, NIFTY Next 50 fell 1.1%, Midcap 150 declined 1.4%, and Smallcap 250 was down 0.8%. Microcaps were the only segment to finish positive, gaining 0.7%.
Looking at how far these indices are from their 52-week highs, the divergence is even more interesting. NIFTY 50 is 11.1% below its 52-week high, compared with just 3.6% for Next 50, 2.9% for Midcaps, and 1% for Smallcaps. Microcaps are almost back at their 52-week high, just 0.2% below it.

For the broader indices, NIFTY 50 fell 2.1% this week and closed below 23,400 at 23,398 . NIFTY Bank was down 1.33%, Mid Select fell 0.88%, while Sensex declined 2.27%. On a YTD basis, Mid Select remains the strongest performer, up 5.86% , while NIFTY Bank is down 4.99%, NIFTY 50 is down 10.45%, and Sensex is down 12.25%.
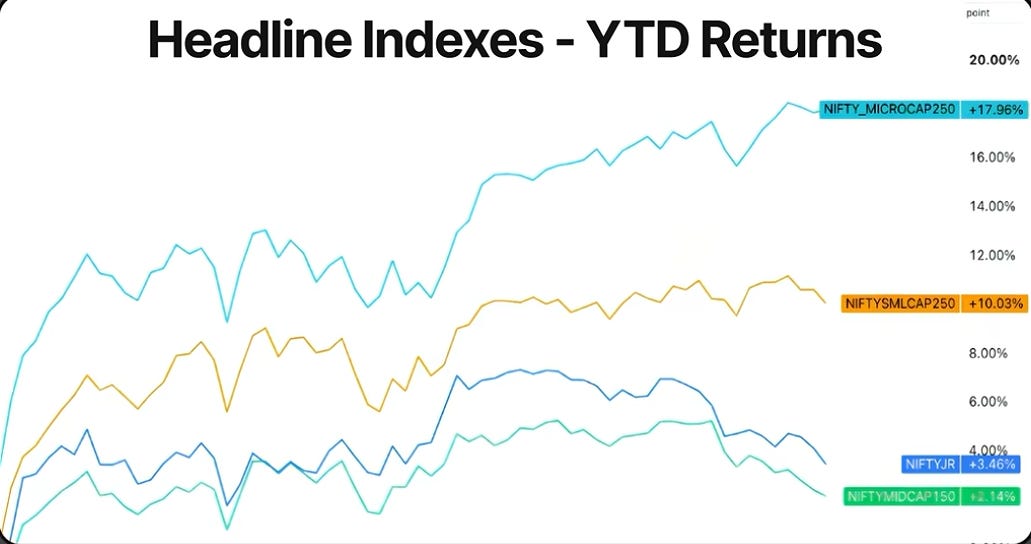
Looking at the year-to-date performance, all the indices moved broadly in sync from January through April. But from April onwards, the divergence has been striking — NIFTY has largely lagged, while the broader market continued to move higher. Microcaps have gained 18% YTD, followed by Smallcaps at 10%, NIFTY Junior at 3.5%, and Midcaps at 2%. In contrast, NIFTY 50 is down 10.5%.
NIFTY — Weekly
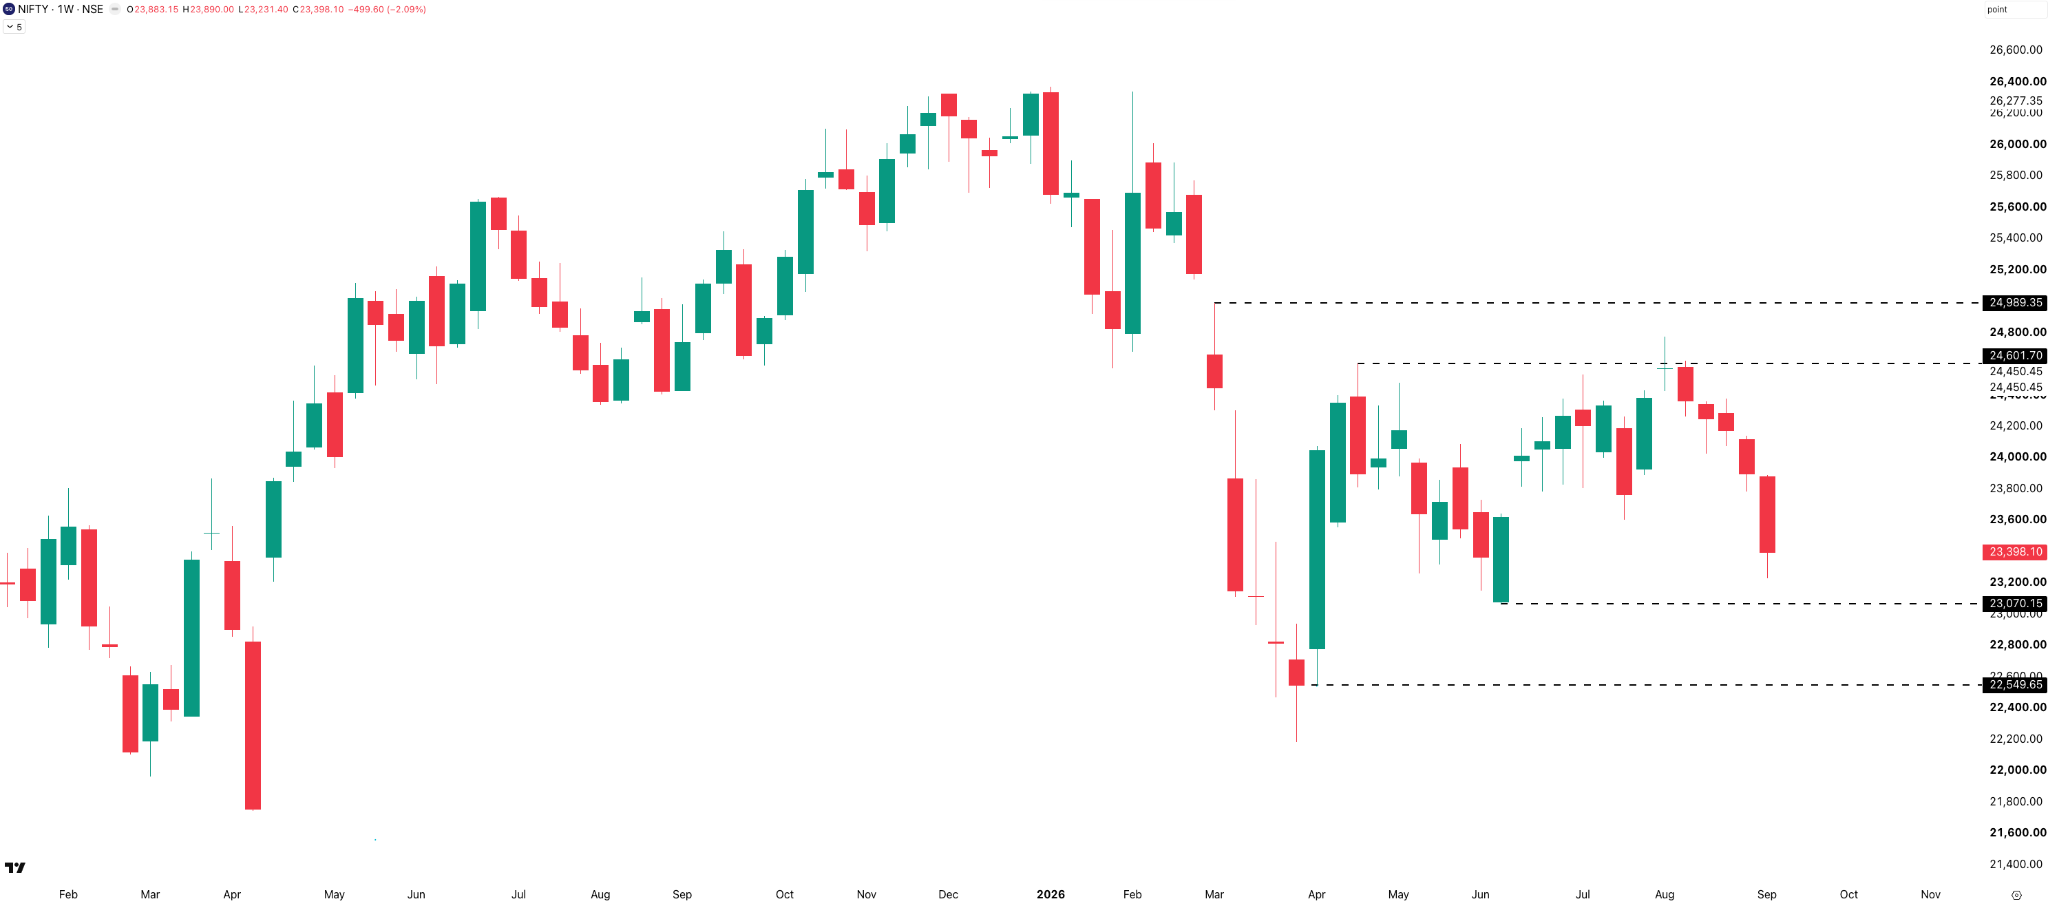
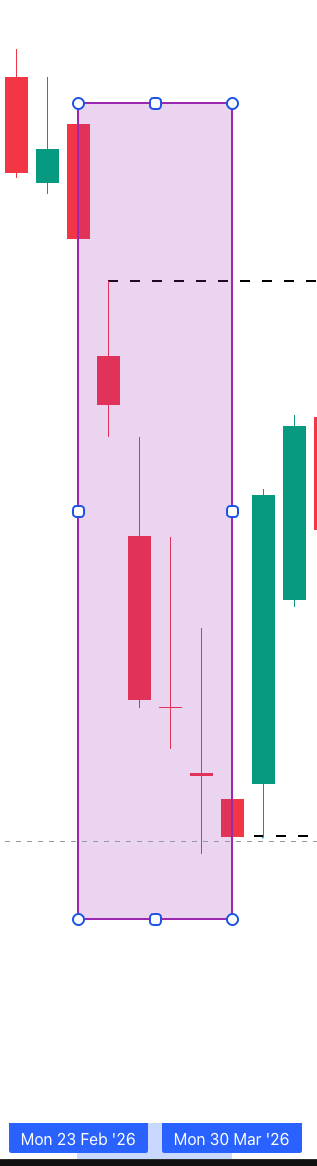
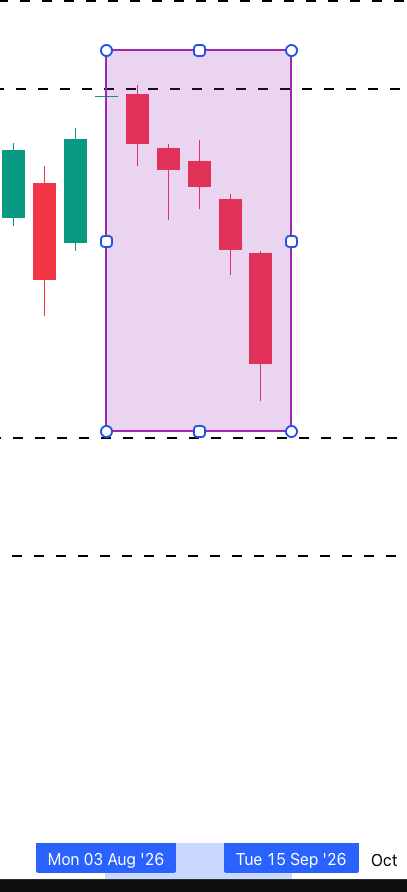
This is the fifth consecutive red week for NIFTY. The last time we saw such a long streak was from 23 February to 4 April 2026, and that decline was brutal — NIFTY lost more than 11% on a weekly closing basis. This time around, the decline has been much more measured, with NIFTY down around 4.8% over the five weeks. The next key level on the downside is 23,000 and then 22,600 .
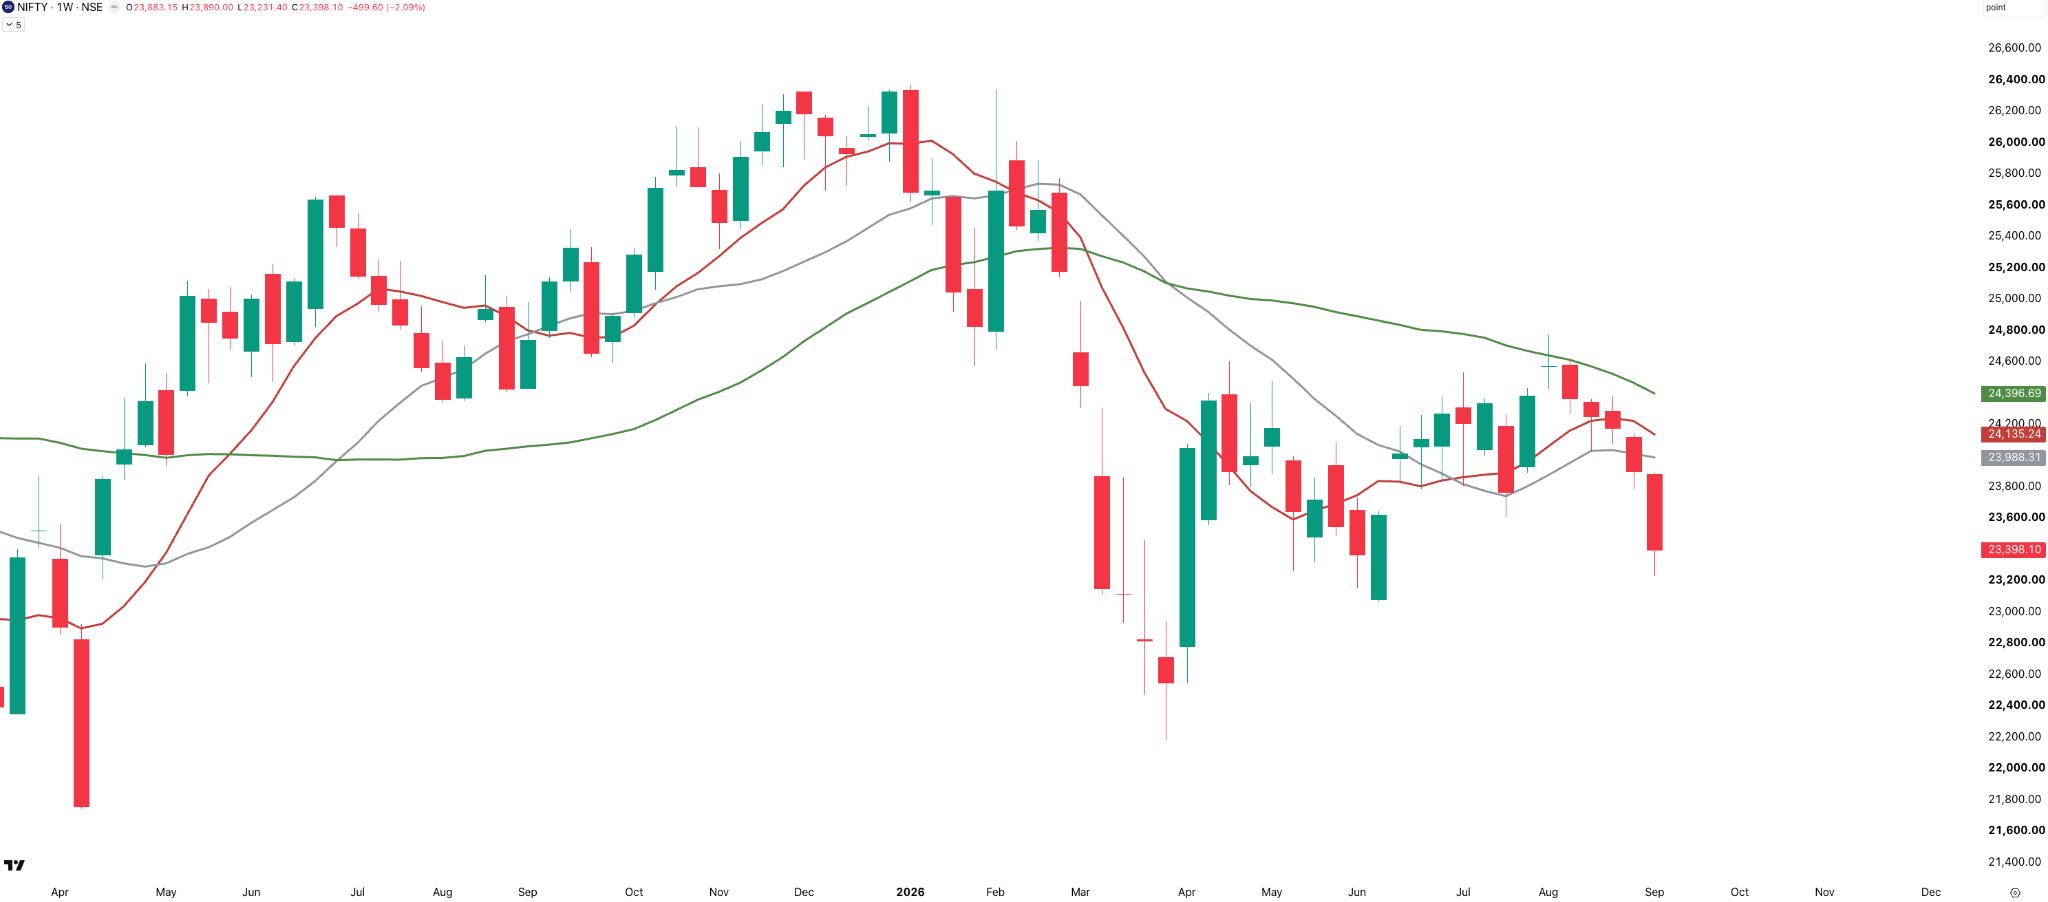
On the weekly moving averages, just like last week, NIFTY continues to trade below all three key averages — the 10, 20, and 40-week SMAs. This continues to point to weakness in the broader weekly trend.
NIFTY — Daily
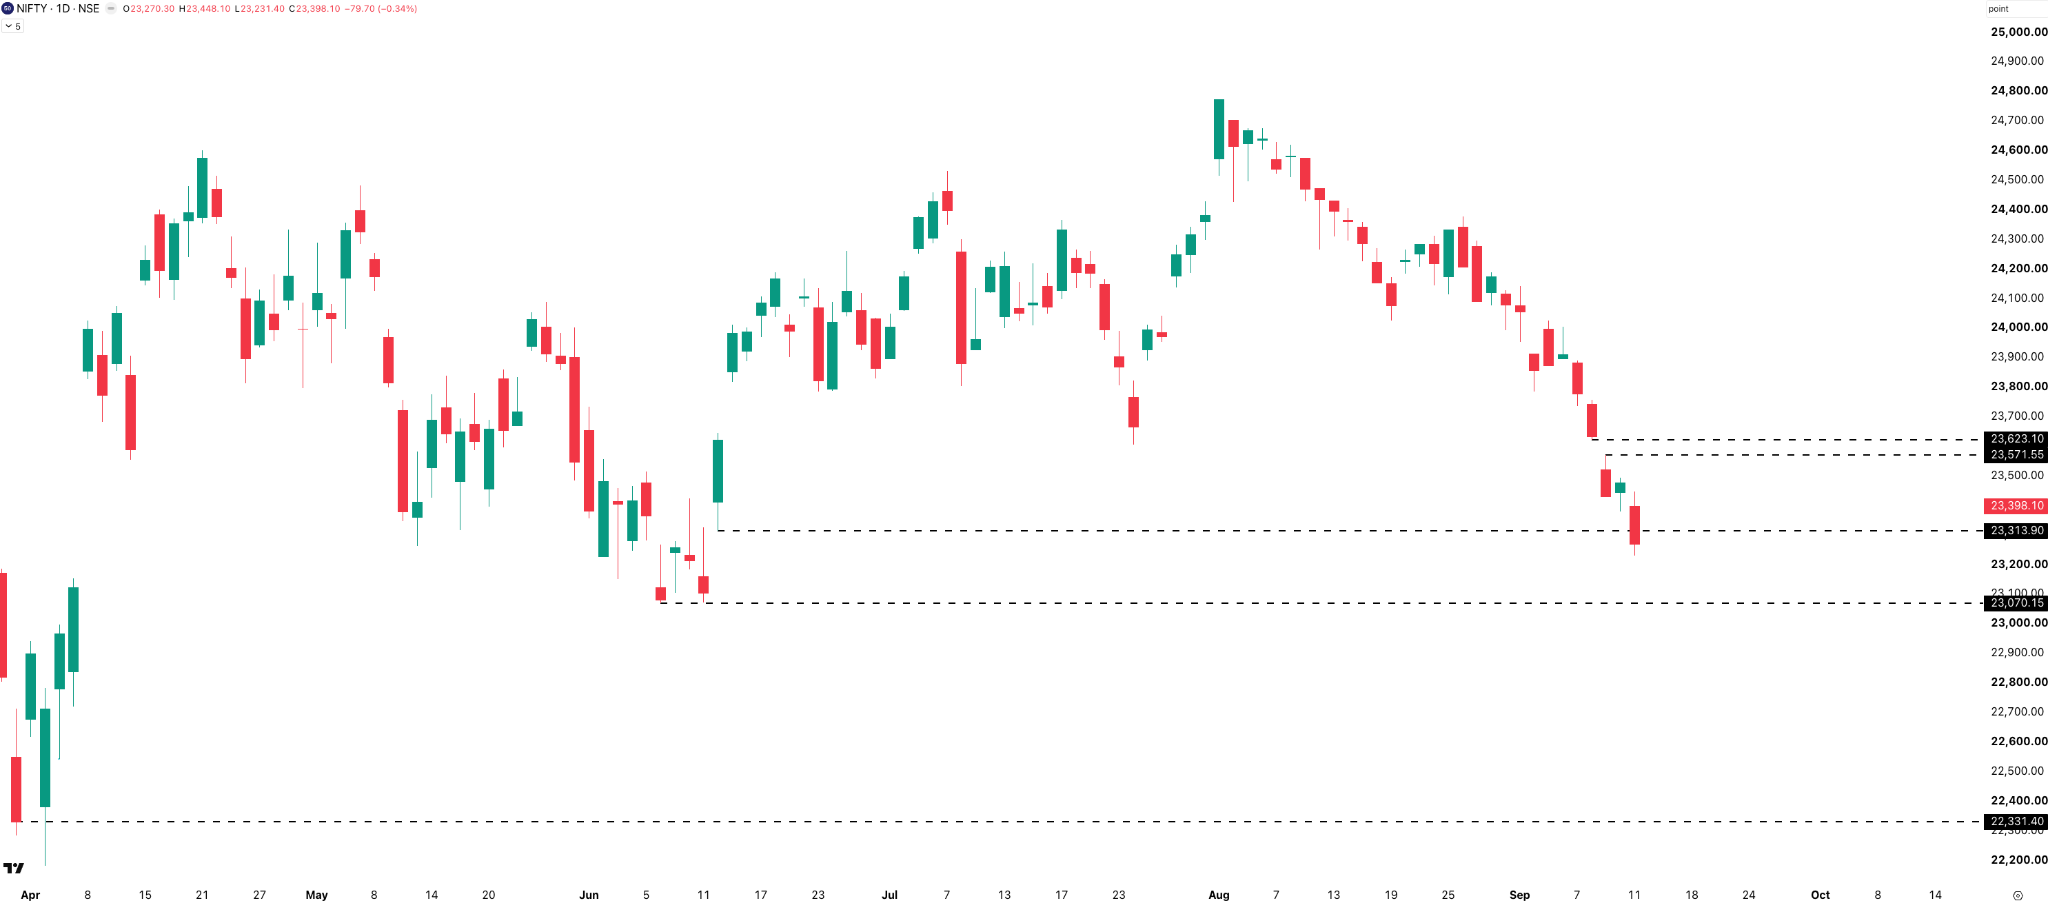
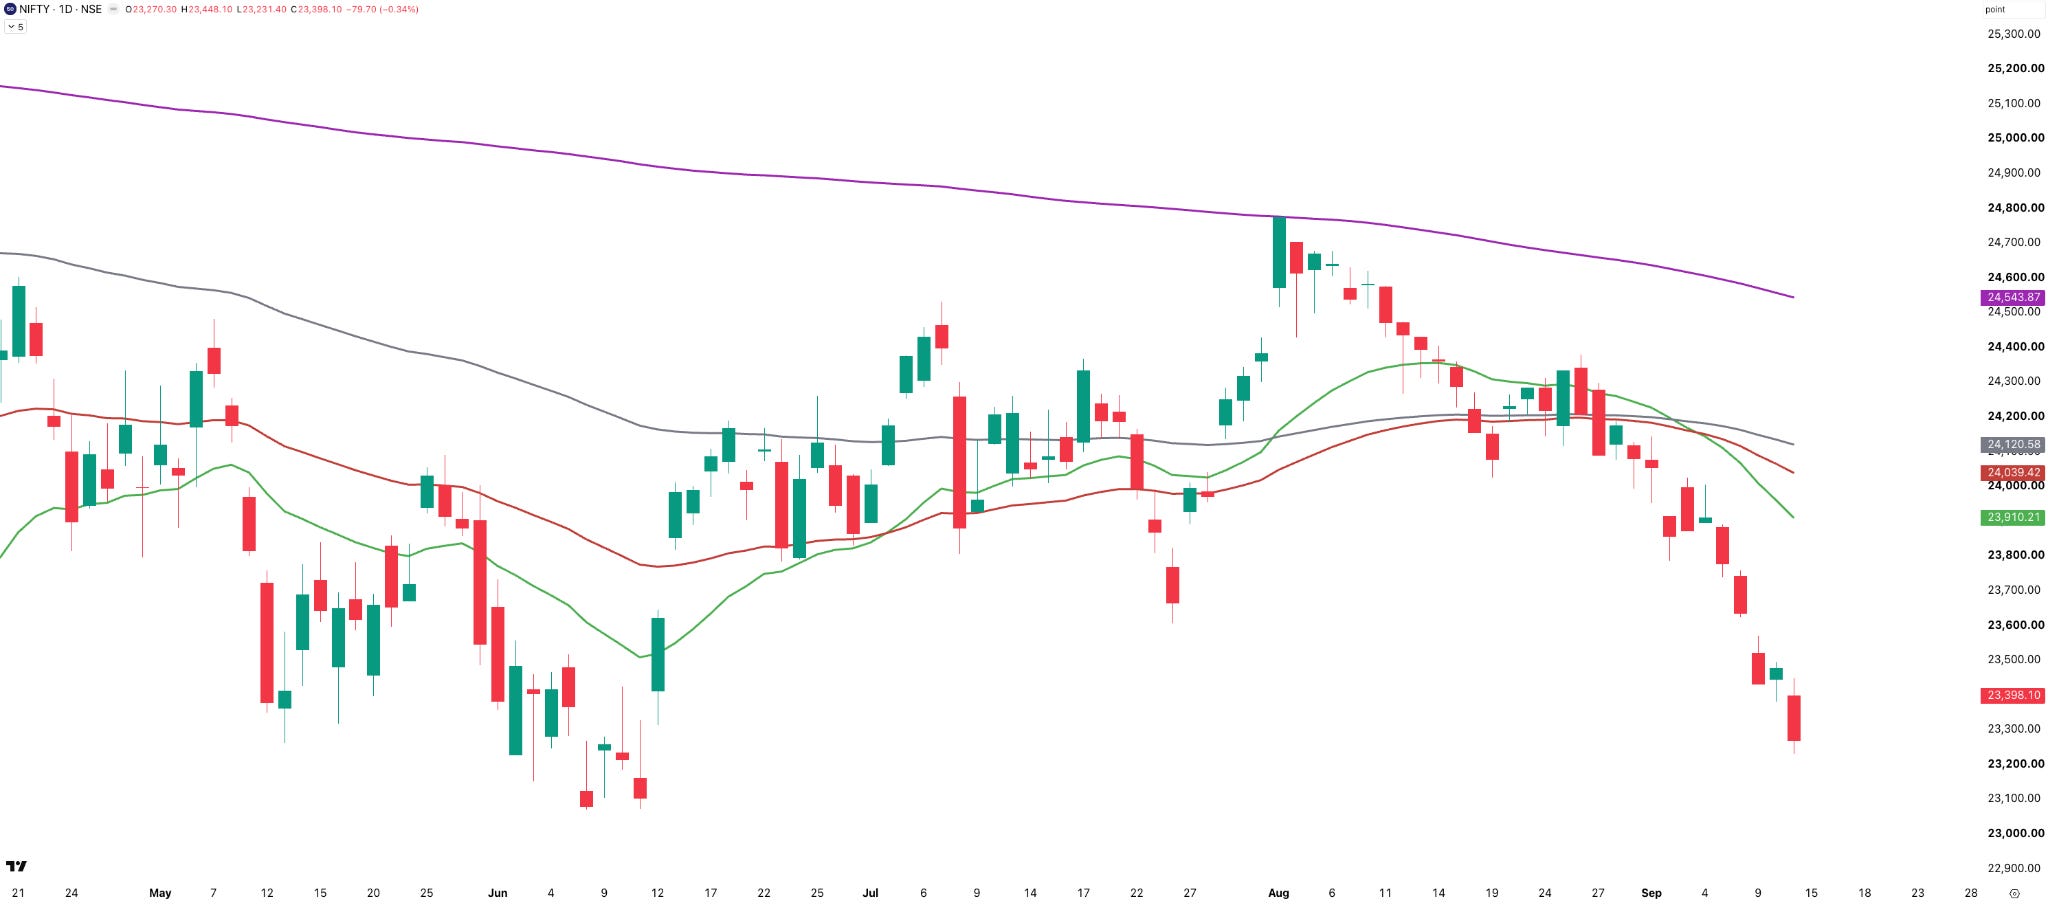
On the daily chart, NIFTY had four negative sessions and just one positive session this week. We also saw three gap-down openings on Tuesday, Wednesday, and Friday. On Friday, the index breached 23,300 but managed to close back above it, around 23,400 . So, 23,300 is the immediate support, followed by 23,000, and below that, 22,300. On the upside, the 23,600 zone is the key resistance to watch.
On the daily moving averages, just like we saw on the weekly chart, NIFTY is trading below all the key moving averages — the 21, 50, 100-day EMA and 200-day SMA — confirming the continued weakness in the trend.
Range — W37
W37

W36

Compared to last week, the weekly range has expanded sharply, from 356 points in Week 36 to 659 points this week. The 5-day average daily range also increased slightly, from 143 points last week to around 152 points. The highest daily range was around 217 points on Friday, while the narrowest day was Thursday, at around 115 points.
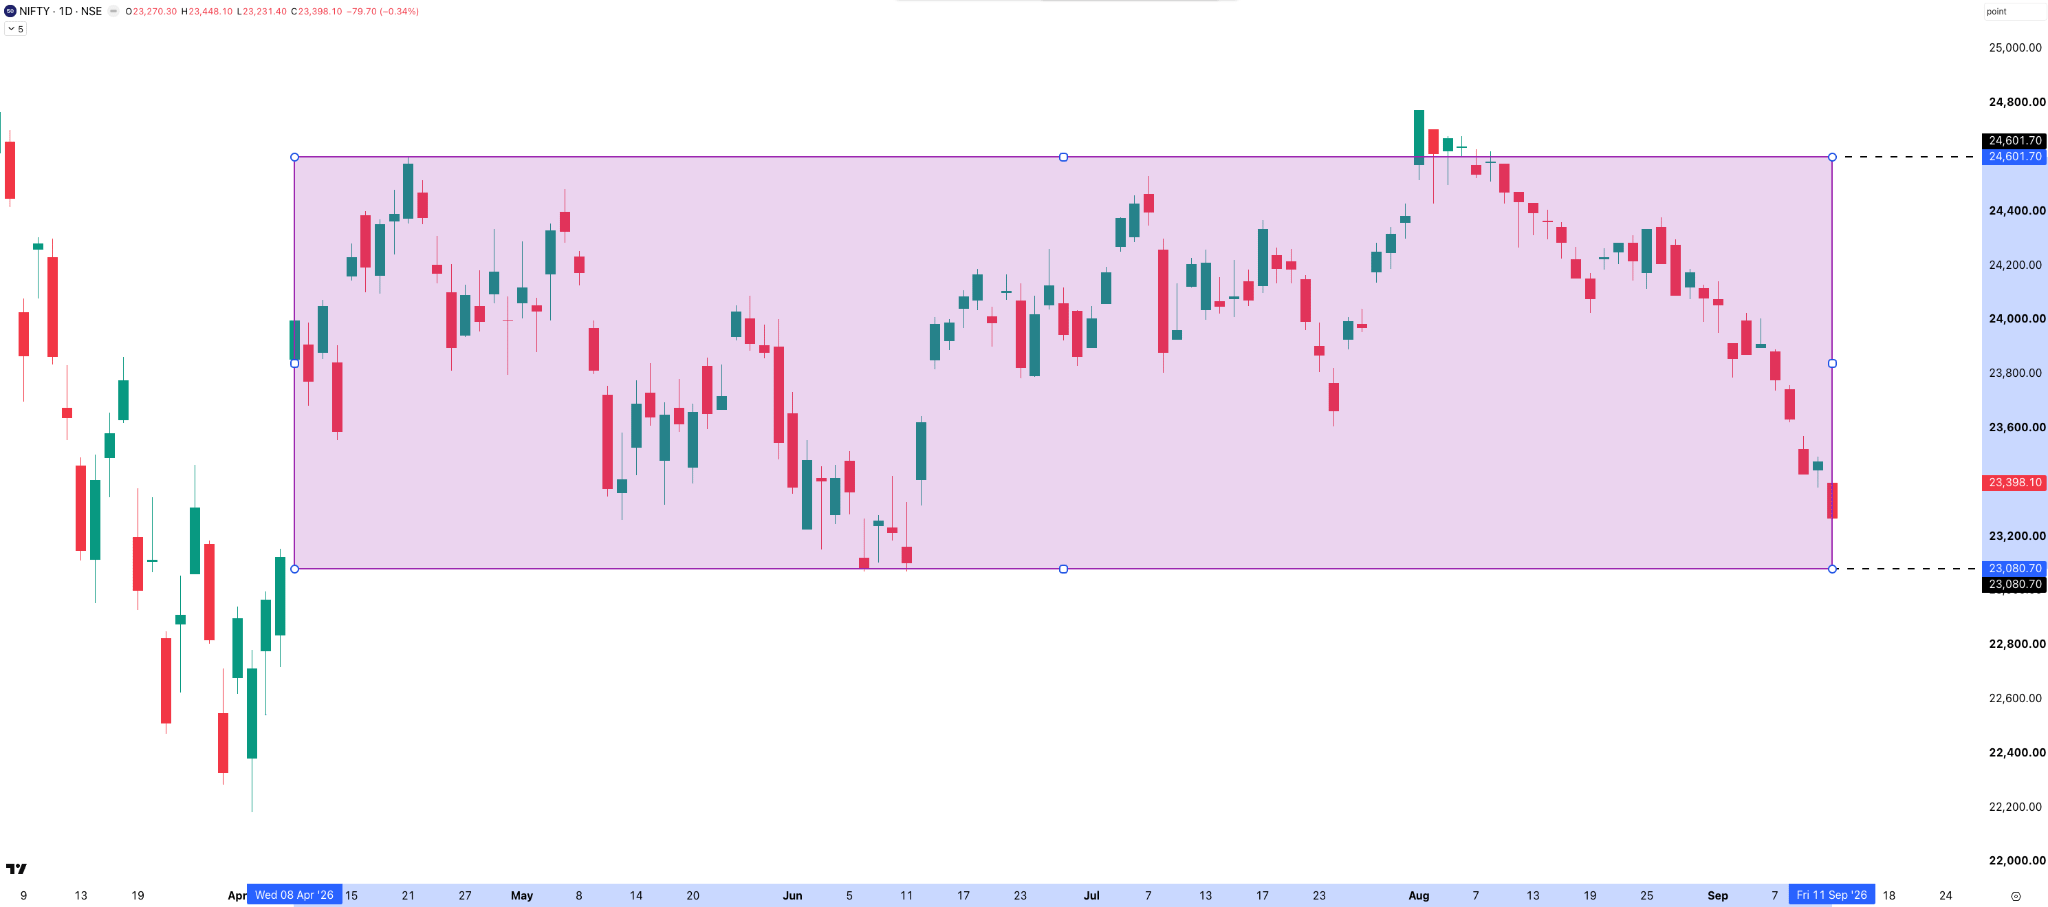
An update on the 1,500-point range we’ve been tracking over the past few weeks. NIFTY remains within the range, but it is now very close to the lower end of it, around 23,080 . Interestingly, this time around, the down move looks more sustained and cleaner than what we’ve seen previously within this range. With NIFTY approaching the lower boundary, this will be an important level to watch.
NIFTY — Hourly
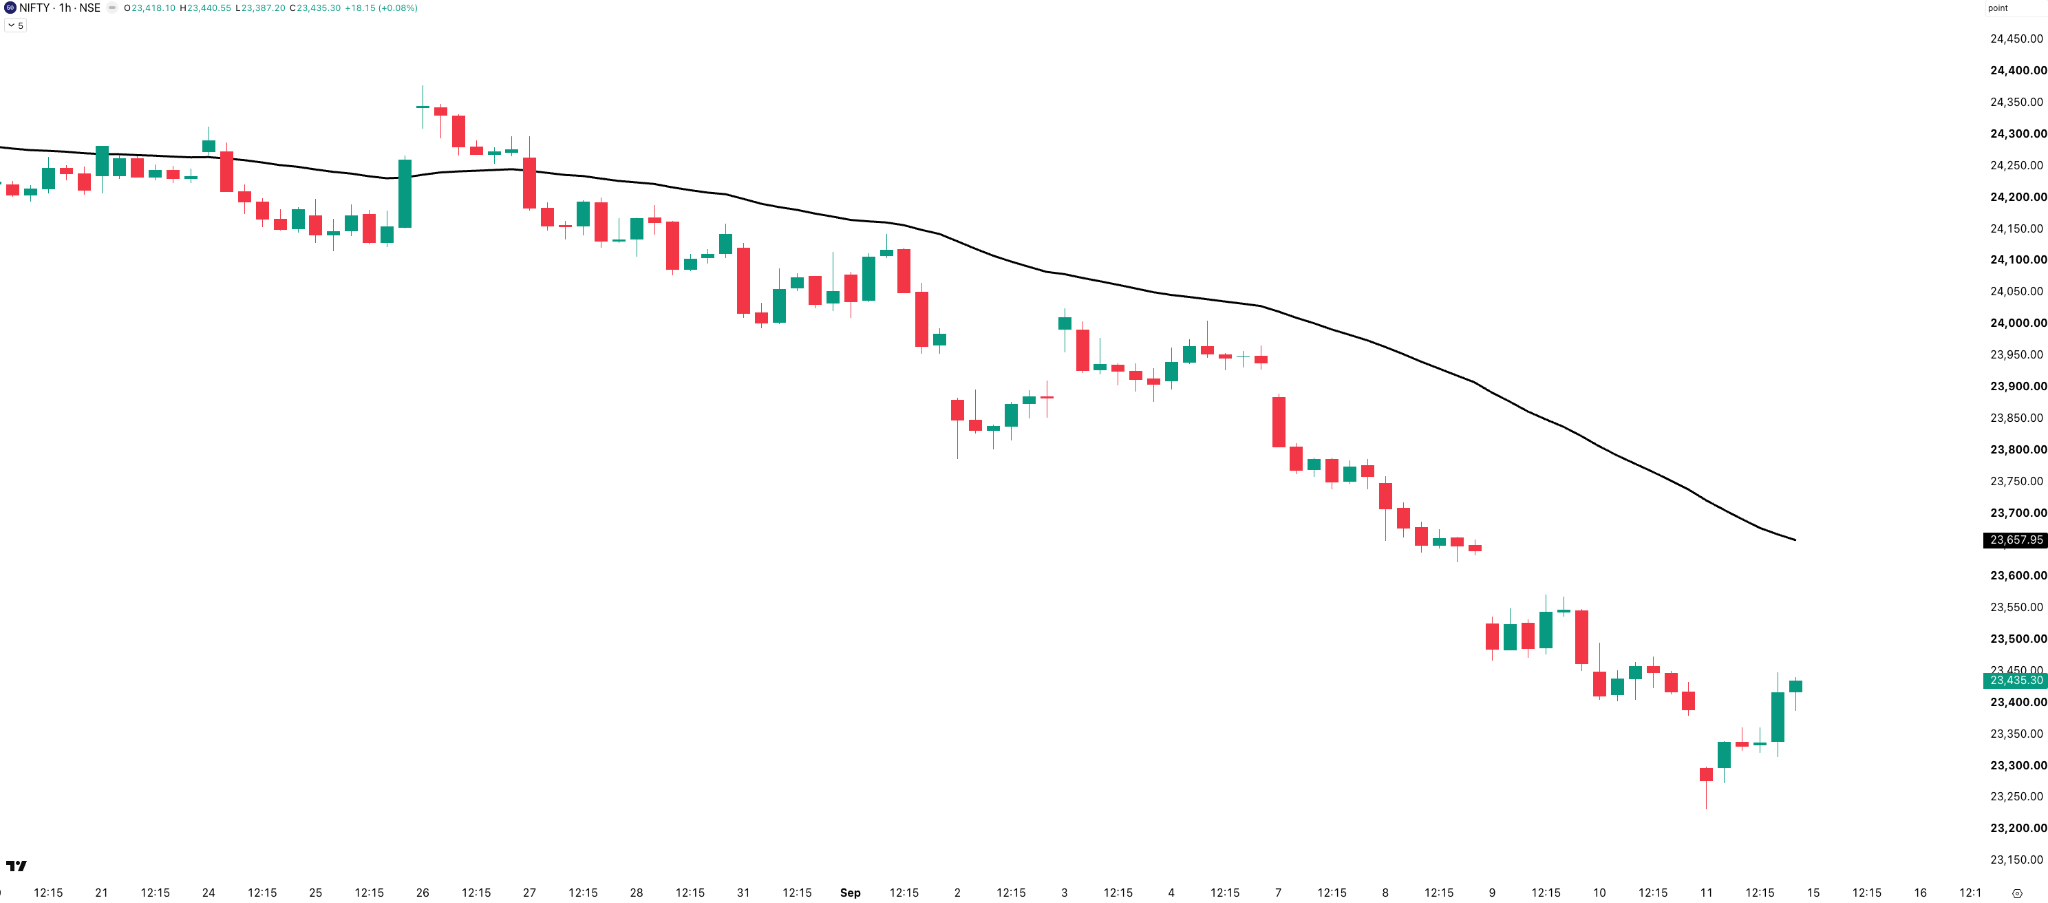
On the hourly chart, NIFTY continues to trade below the 50-hour EMA, which is currently around 23,658 . The index has remained below this average through the recent down move and for the entire current week. At least, that’s something for the short-term trend followers to be happy about.
Weekly Expiry Recap
Talking about the NIFTY weekly expiry on Tuesday, September 8, the index saw an intraday range of 136 points . The straddle opened at around 97 points, up from last week’s 88 points, and was trading at about 75 points at 3:15 PM. During CAS, the index closed at 23,635 , just 5 points below the indicative price at 3:15 PM.
So does that mean CAS on expiry days is working? Not really. The problem is that the indicative price itself can see some wild swings, especially on expiry days, making it difficult to know what the actual closing price will be. The entire trading community is now waiting for SEBI’s consultation paper on changes to how the closing price for derivatives will be calculated on expiry days. Hopefully, these changes will address the issue and make these wild swings during CAS a thing of the past, even on expiry days.
On the SENSEX weekly expiry on Thursday, September 10, the index traded in a range of 312 points , the narrowest range of the week — but the swings during CAS were anything but narrow. The indicative price first moved from around 74,600 to 75,600, a 1,000-point jump. It then fell to around 74,500, another 1,100-point move, before jumping to 75,800, up 1,300 points, and finally settling around 74,900, about 900 points lower. That’s a 4,200-point swing in the indicative price, all within roughly less than 10 minutes.
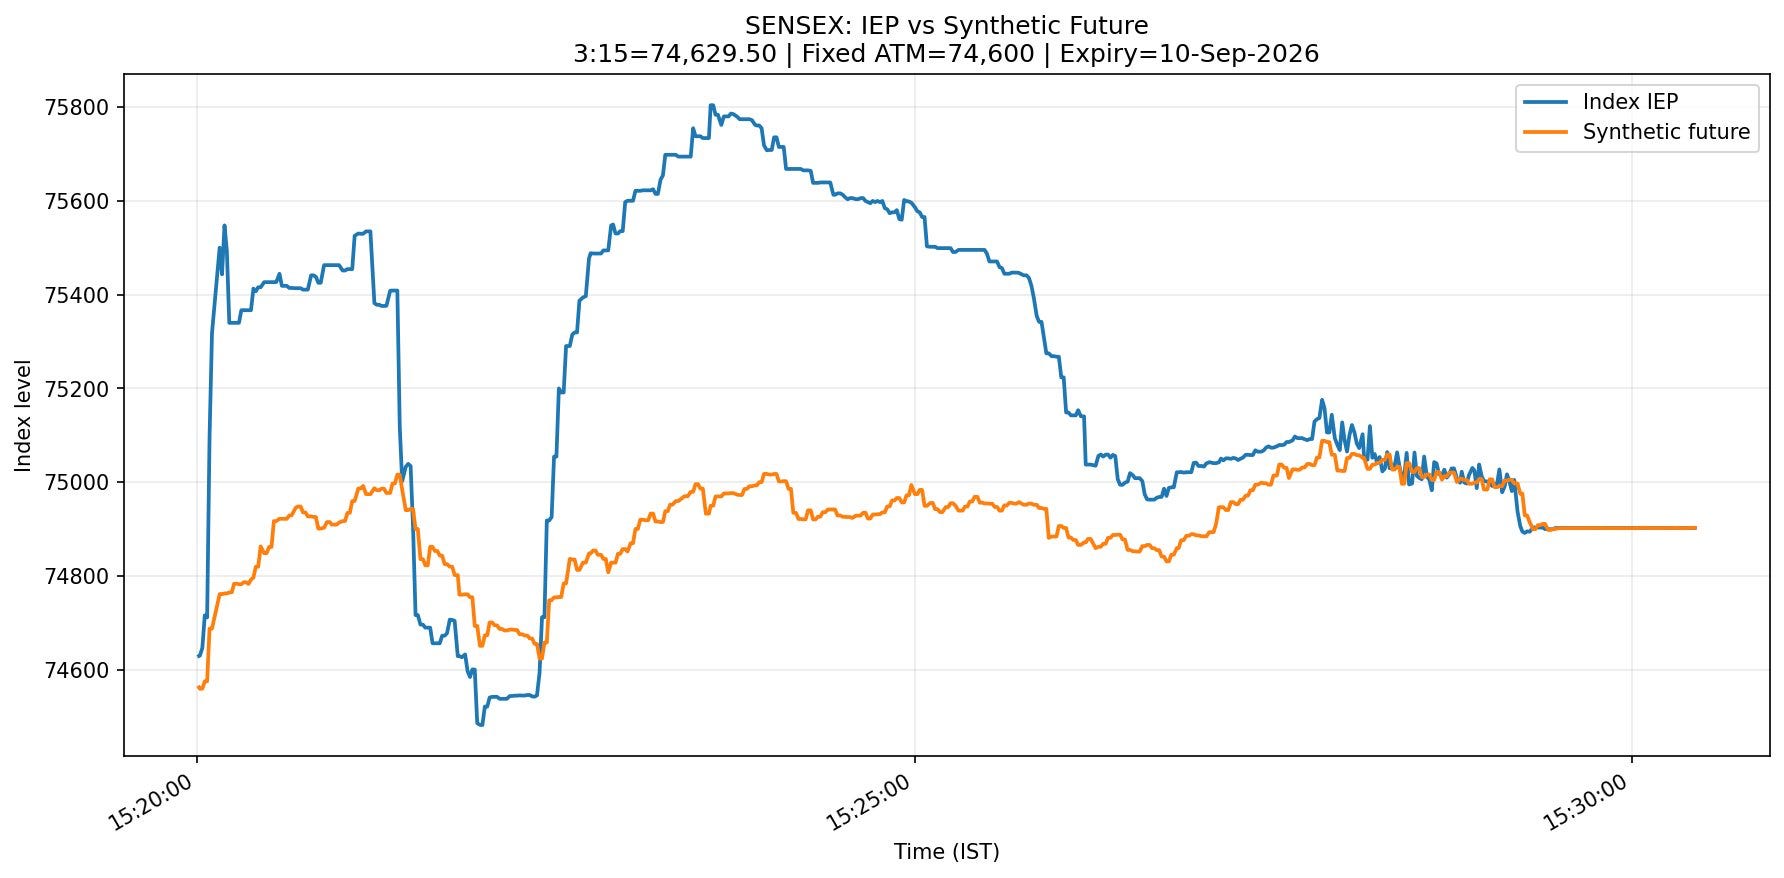
[Image: Sensex indicative price swings during CAS — image credit: @AshishGupta325]
And during those 10 minutes, from 3:20 to 3:29 PM, options prices across several strikes went crazy. This keeps happening again and again, and traders are getting a new surprise almost every week. I sincerely hope we get a resolution to this soon.
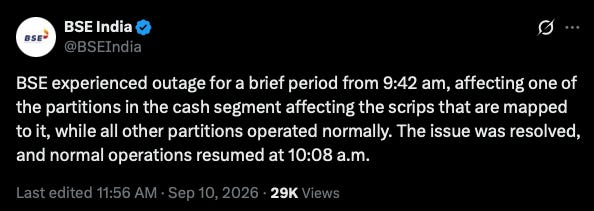
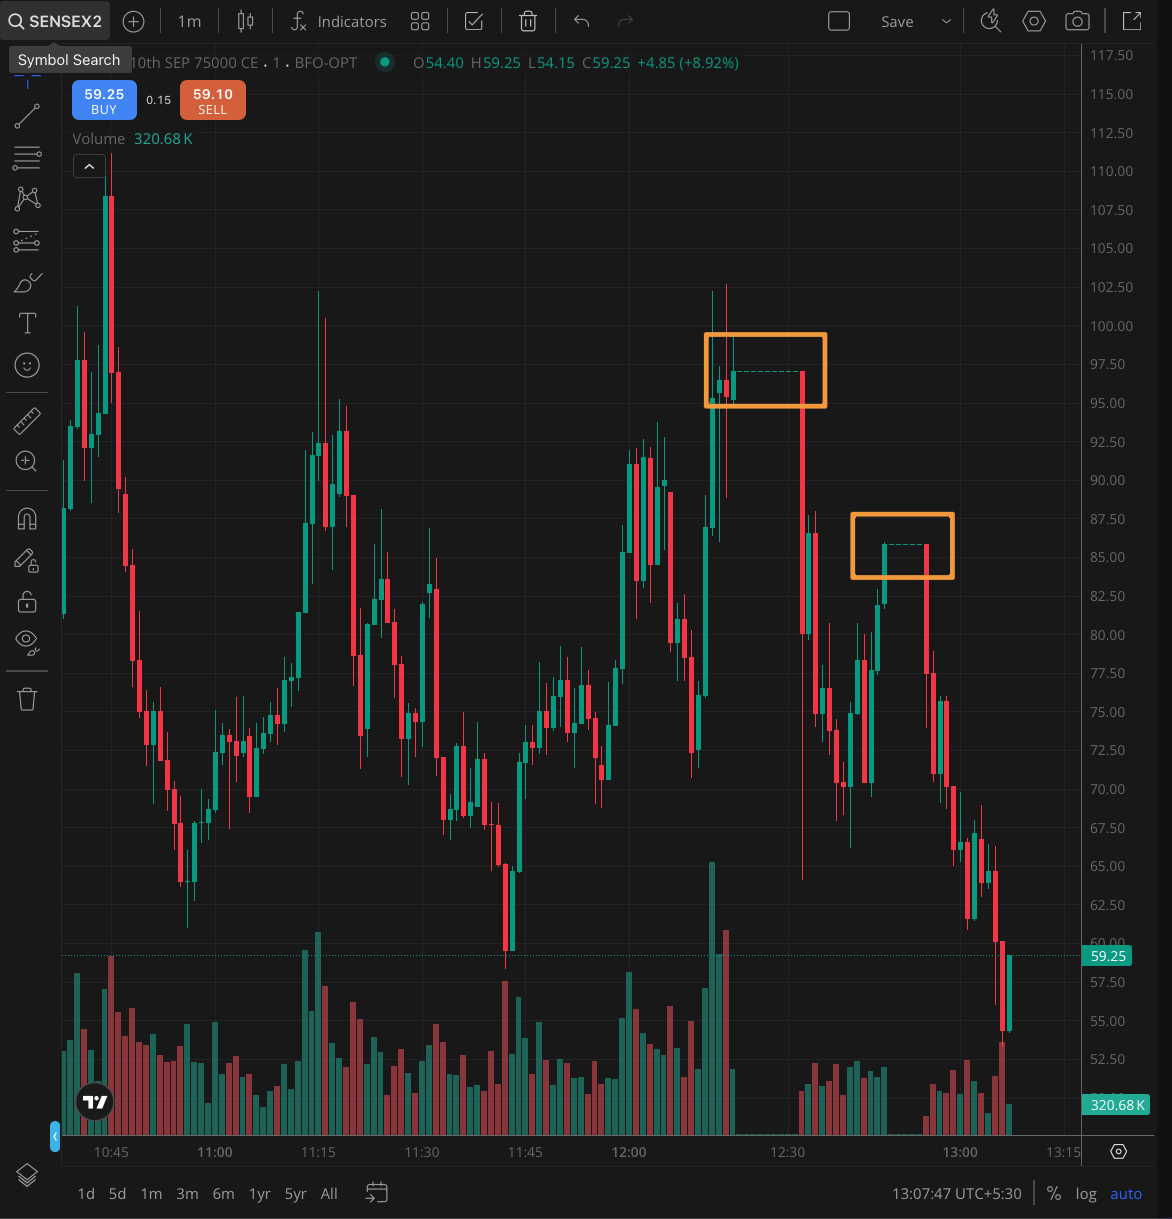
There was another issue on the day too — the 75,000 CE strike stopped updating prices twice, and BSE put out an update saying there was an issue, which was subsequently resolved, but it happened again around 12:45. When things like this happen on expiry day, it’s pretty scary for traders.
And there was another issue on the day. The 75,000 CE strike stopped updating prices twice, and BSE put out an update saying there was an issue, which was subsequently resolved, but it happened again around 12:45. But when things like this happen on expiry day, it is pretty scary for traders.
Section Two — What to Expect in the Coming Week
Now, after five consecutive weeks of weakness, NIFTY is getting closer to the lower end of the five-month range. The picture is pretty weak, with the index trading below the 200-day SMA and all the other key moving averages. On the downside, 23,300 is the immediate support, followed by 23,000 and then 22,300. On the upside, 23,600 remains the key resistance.
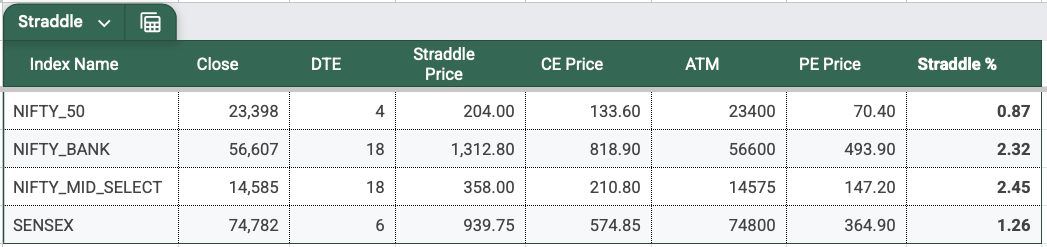
Looking at the straddle premium to gauge the expected range for the upcoming weekly expiry on Tuesday, September 15 — one important thing to keep in mind is that Monday, September 14 is a market holiday on account of Ganesh Chaturthi, so the market will open directly on Tuesday after a long weekend. The higher straddle premium of 1DTE is therefore also pricing in the risk of a larger move after the long weekend. With NIFTY at 23,398 and the straddle premium at 204 points , this implies an expected range of roughly 23,194 to 23,602 for the expiry.
India VIX
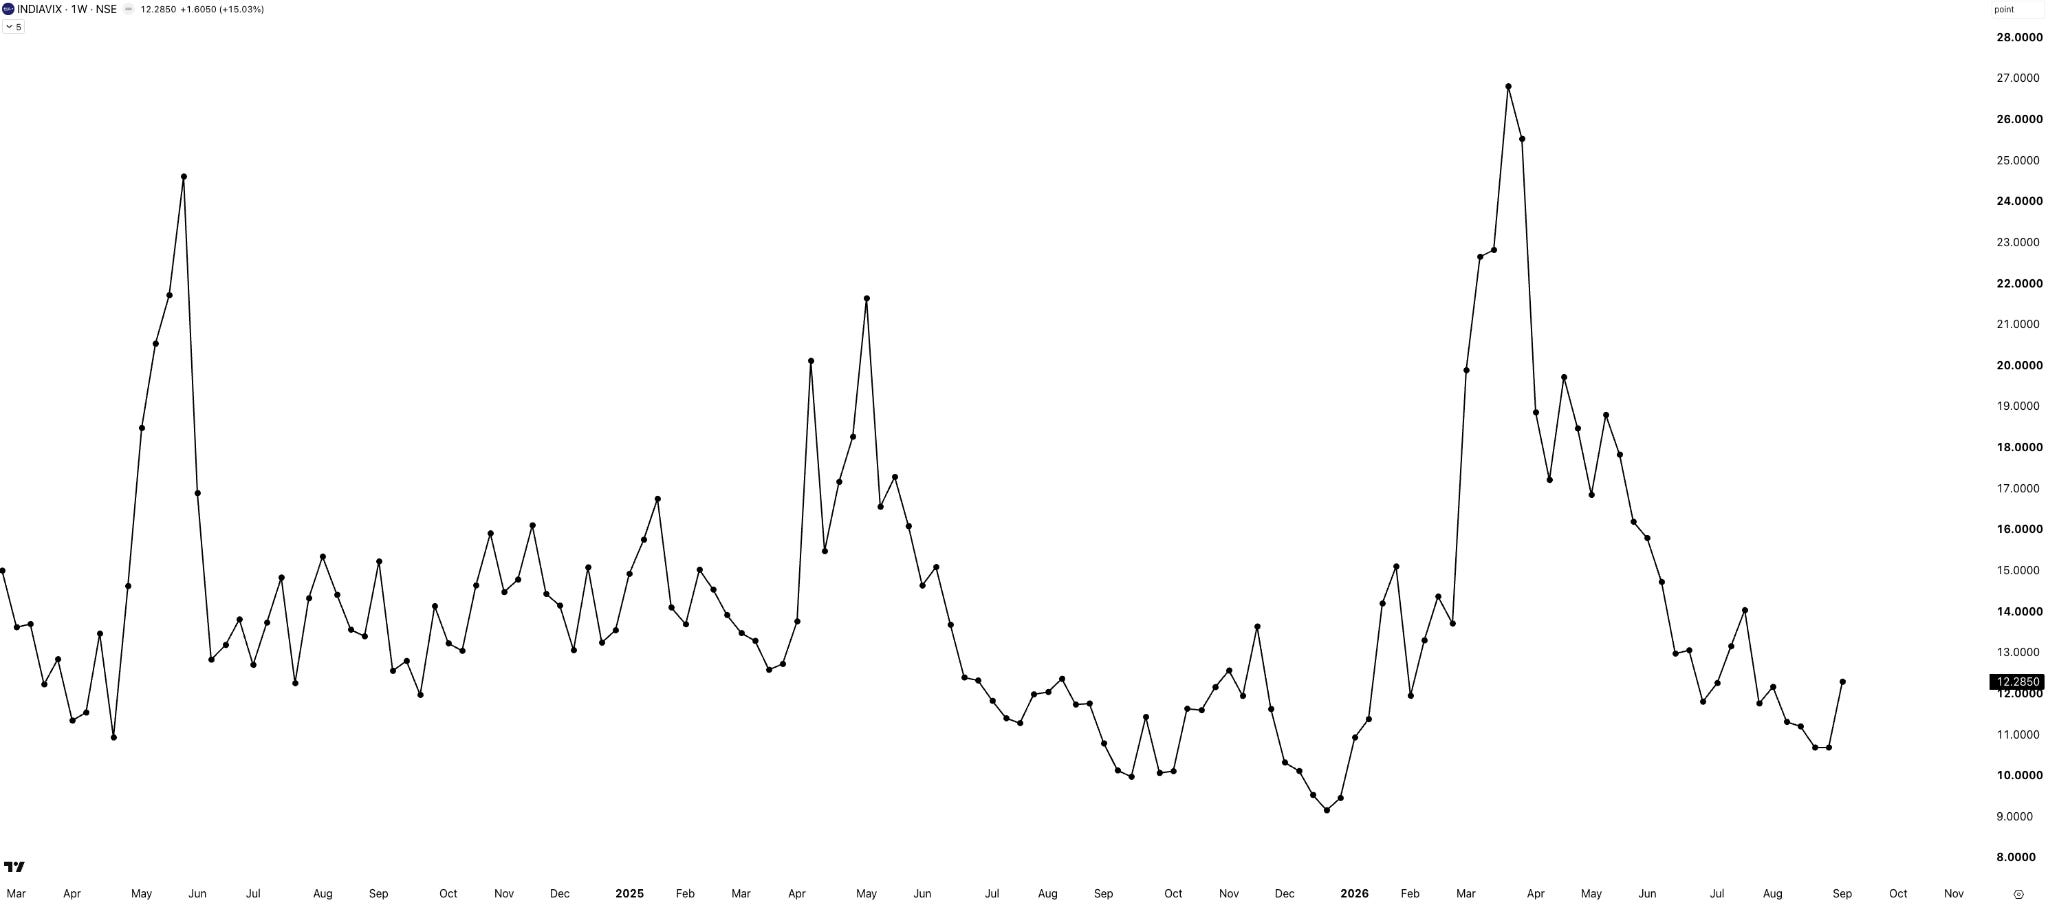
With NIFTY falling around 2% for the week, India VIX spiked 15% , or about 1.6 points, to close at 12.29 . This is a clear pickup in volatility, although VIX is still well below the levels we saw earlier this year.
Sectors
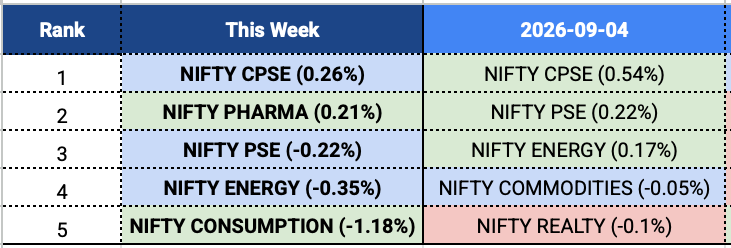
There isn’t much to see here this week. Of the top five sectors, only two delivered positive returns — CPSE and Pharma . The other three, despite making it into the top five, were still negative: PSE, Energy and Consumption. Three sectors — CPSE, PSE and Energy — continued from last week, while Pharma and Consumption were new entrants.
Moving to the TJI sector baskets — Upstream sits right at the top this week, no prizes for guessing why. Below that, the same names keep showing up: Communication Equipment, Pharma API and CRAMS, and Dyes and Pigments, continuing their run from previous weeks, and Defense, back again as a consistent performer.
On the 52-week-high side, the list is thin — right now it’s just Pharma and Communication Equipment holding that spot. Given the broader downtrend the market’s in, that’s not surprising, but it does tell us which pockets are holding up even through this bad stretch.
W37

W37-52W H

[Chart: Sectors — W37, and W37 at 52-week high]
Commodities
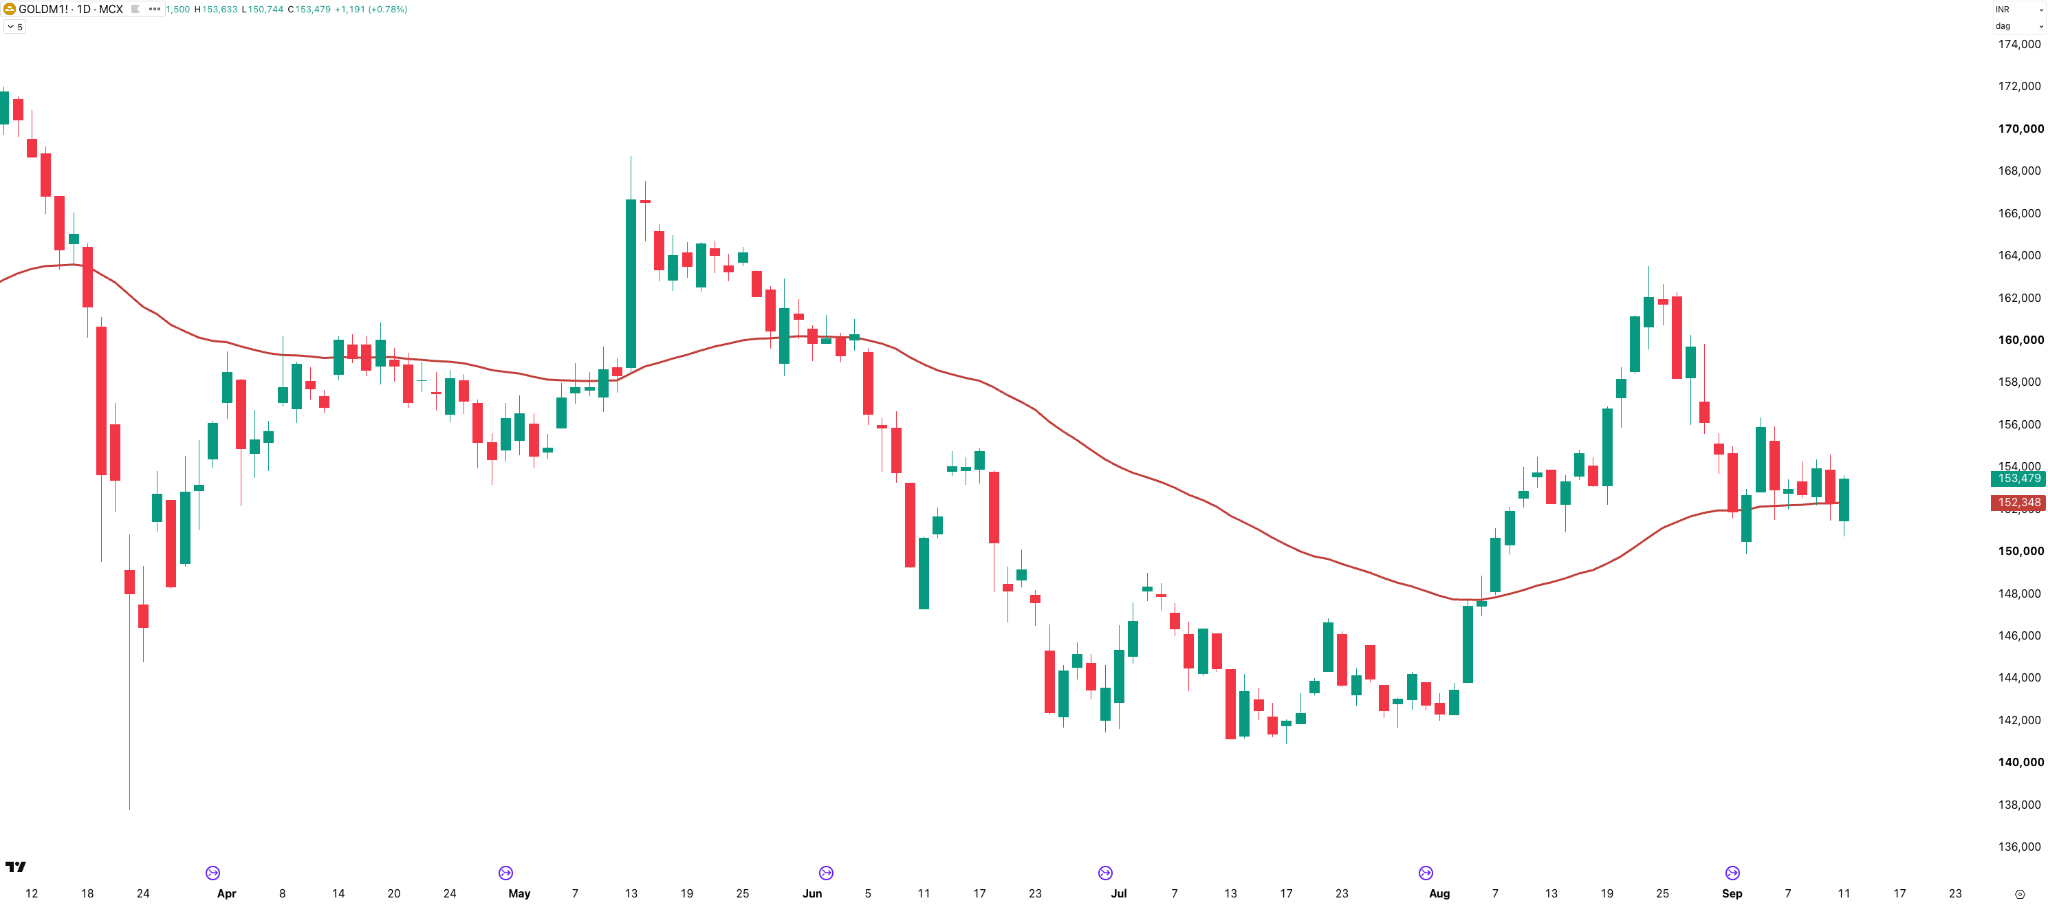
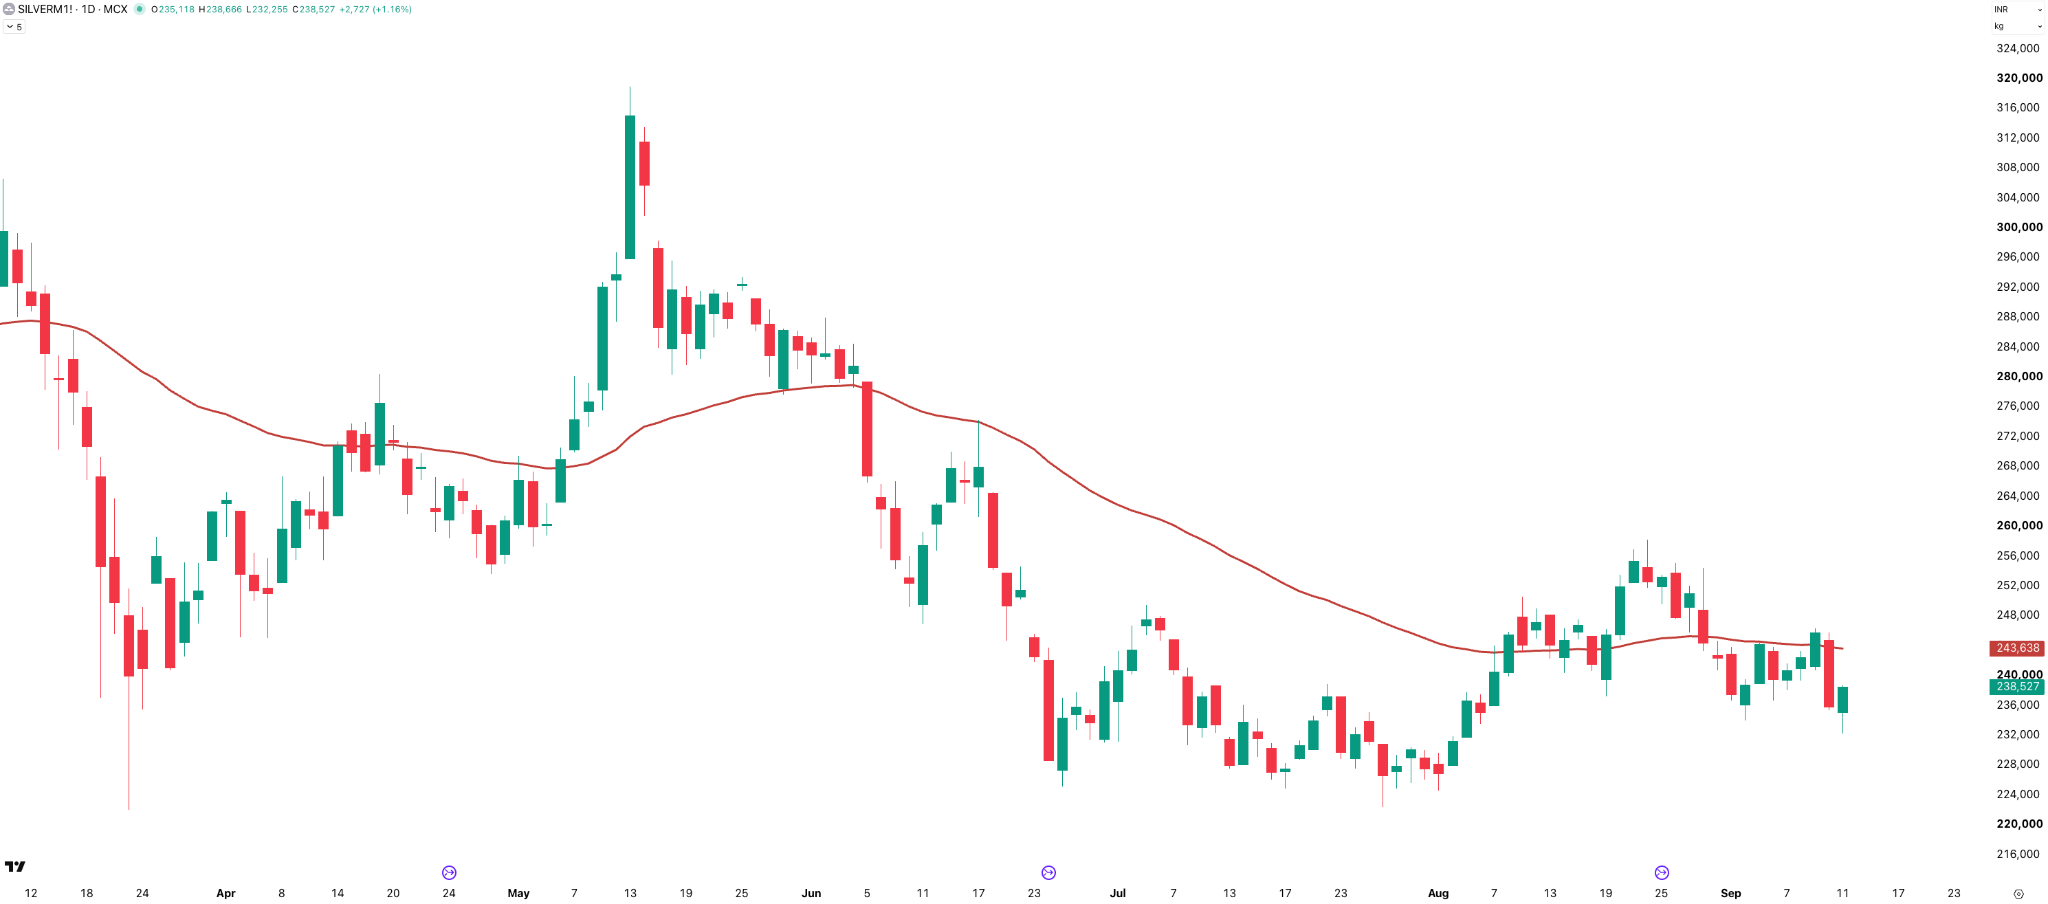
Gold continued to hold above its moving average and is trading around ₹1,53,500 , while Silver is trading around ₹2,38,500 at the time of recording. Both have recovered from their recent lows, but Gold is currently trading above its moving average, while Silver remains below it — Silver also tried to pull back towards its 50-day EMA this week but couldn’t close above it, and just like Gold, it fell sharply on Friday, around 2.6% lower at ₹2,37,800.
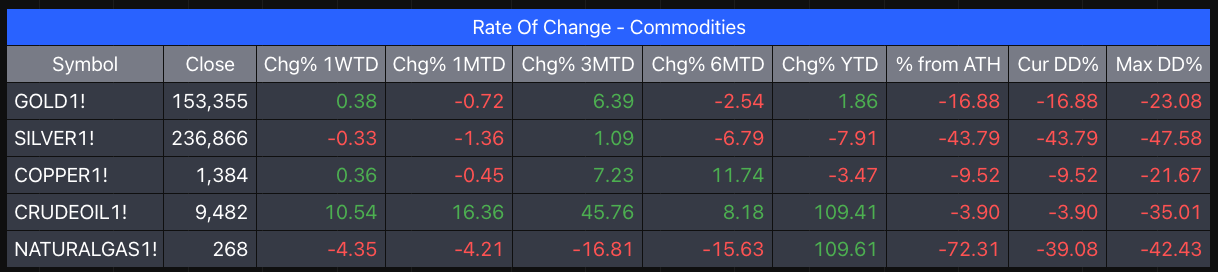
Looking at commodities, Crude Oil continues to be the standout performer, gaining 10.54% this week and more than 109% YTD. Natural Gas is also up 109.61% YTD, but has been weak recently, falling 4.35% this week. Gold is up 1.86% YTD, while Silver is down 7.91%. Copper is also down 3.47% YTD, despite being up 11.74% over the last six months.
Wrapping Up
So, to sum it all up, it was another weak week for NIFTY, falling around 2.1% and closing below 23,400. This was the fifth consecutive weekly decline, with 23,300 and 23,000 as key supports and 23,600 as resistance. India VIX also picked up, rising 15% to 12.29, while the broader market continues to outperform NIFTY.
The bigger story remains the CAS issue, with SEBI expected to provide more clarity on the settlement price methodology. Gold continues to hold above its 50-day moving average, while Silver remains below it. Crude Oil remains the standout performer this week.
What Caught My Attention This Week
Two picks this week, pulling in rather different directions.
- First is a long conversation with Arvind Chari, Chief Investment Officer at Quantum Advisors, on where India stands in the eyes of global investors. He traces the swing from “TINA” — India being the only game in town right after COVID — to today’s more skeptical “anti-India” mood, pinning much of it on high valuations and the absence of a big domestic AI story. He also makes the case for why foreign capital still matters even with record domestic savings, and digs into why corporate capex remains sluggish despite the optimism. One line stuck with me: manufacturing gets all the credit for job creation, but he thinks services and GCCs will carry more of that weight, provided India fixes its public education gaps.
- Second is a post on X by Anand Shah on a particular but rather common kind of investing failure — not the blow-up type, but the one where decades pass while your corpus barely moves, even through real bull runs and real multibaggers. Time is brutal, and it waits for no one.
Events to Watch Next Week
- Monday, September 14 is a market holiday on account of Ganesh Chaturthi, which gives traders a long weekend — the first one we’ve had in over two months.
- Wednesday, September 16, 11:30 PM — the US Fed’s rate announcement will be interesting to watch, especially given the current market weakness.
So yeah, that’s pretty much it for the week. If you find this series useful, don’t forget to subscribe to the channel — and yes, do share it with your friends.
Until then — stay curious, stay steady, and enjoy your (the long) weekend.