Hello and welcome to Weekly Market Metrics! I’m Sandeep Rao.
 | What to Expect Next Week")
We’re in week 41 of 2025, which means just 11 weeks remain in the year. If you had planned for 6-pack abs, you should have at least hit 5 packs by now. Just saying.
Moving to more mundane stuff like market metrics this week.
What a lovely week this was! The markets closed significantly higher than last Friday’s close. The positive sentiment was fueled by news of a ceasefire between Israel and Hamas, and the festive cheer around Diwali added to the optimism. US markets have also shown resilience, helping sustain the upbeat tone across global markets. The positive momentum from last week has clearly carried forward.
NIFTY 50 - Technical Analysis
Weekly Timeframe
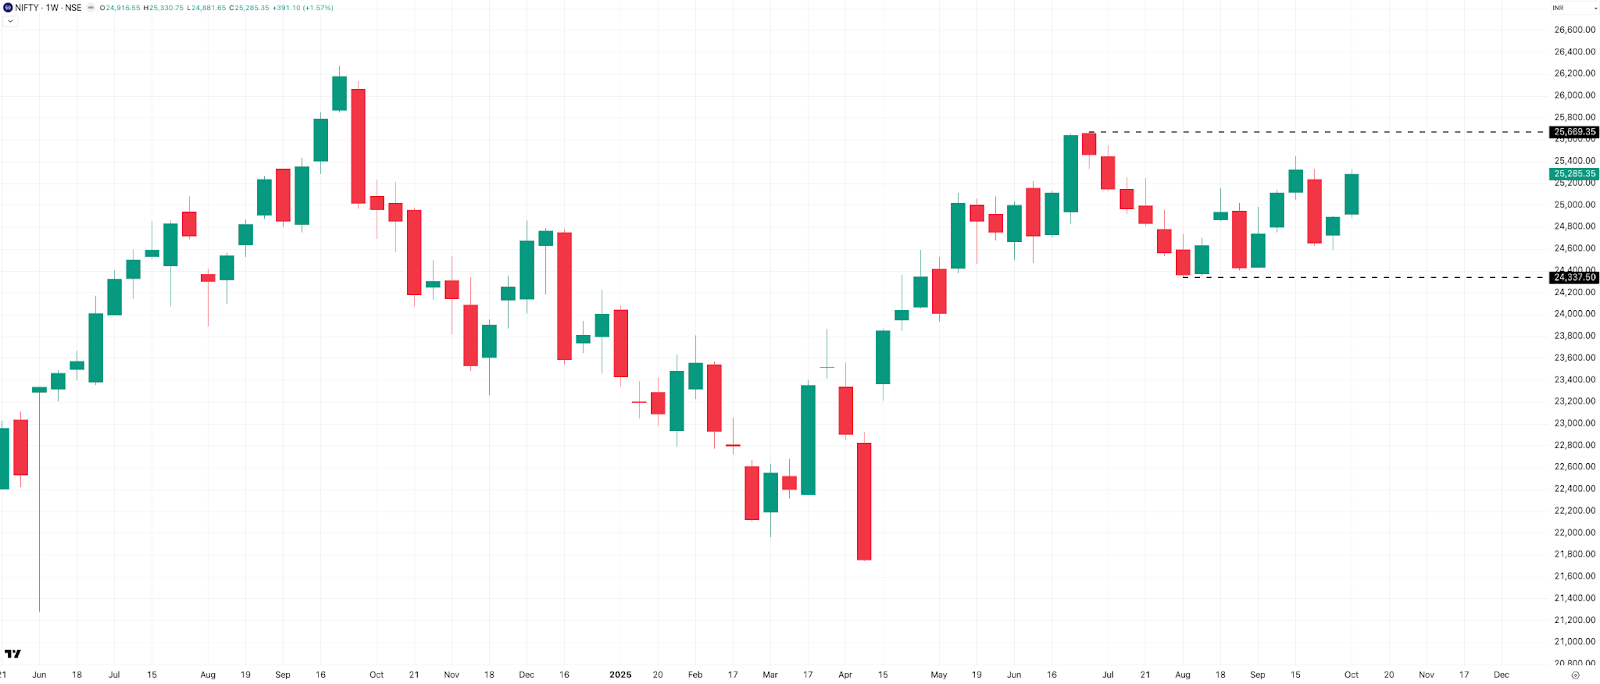
We’re still trading within the broad range of 24,350 to 25,650—a range we’ve been stuck in for nearly 15 weeks now. Nifty moved up by 391 points, or about 1.57%, from last Friday’s close, marking two consecutive green weeks and signaling sustained momentum.
The Nifty is now just about 4% away from its all-time high at 26,277. I have a feeling we should make a new ATH sometime this month. Fingers crossed.
Daily Timeframe
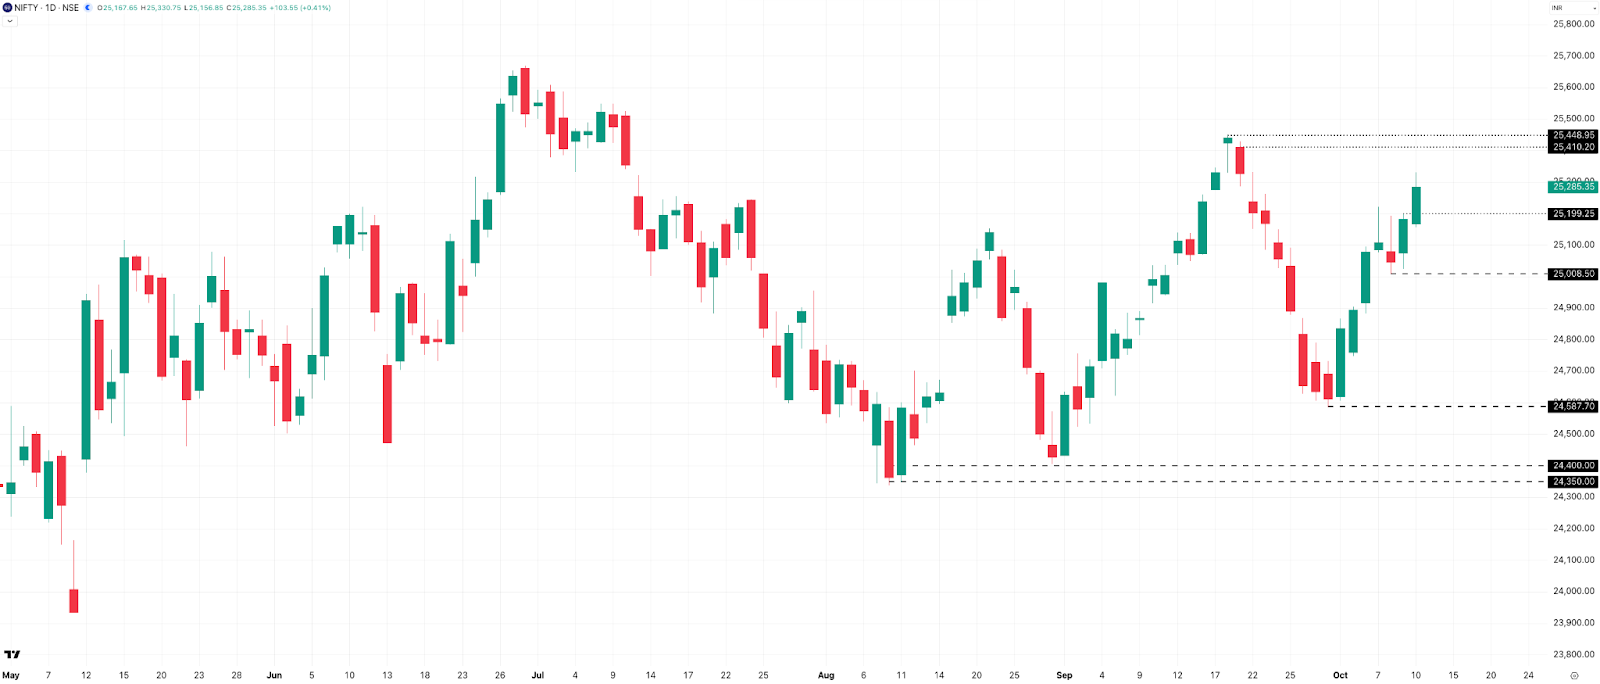
Nifty has nicely crossed last week’s resistance zone of 25,000 to 25,100. Monday and Thursday were solid, with gains of +0.74% and +0.54%, while Friday added another +0.41% (about 104 points). Tuesday and Wednesday were relatively muted, showing some selling pressure around the 25,200 zone.
Friday’s strong close above 25,200 confirms that buyers are still in control. The next immediate resistance lies at around 25,400 to 25,450, while 25,200 now turns into near-term support. Last week’s low near 25,000 should hold well—not just technically, but psychologically too.
Hourly Timeframe
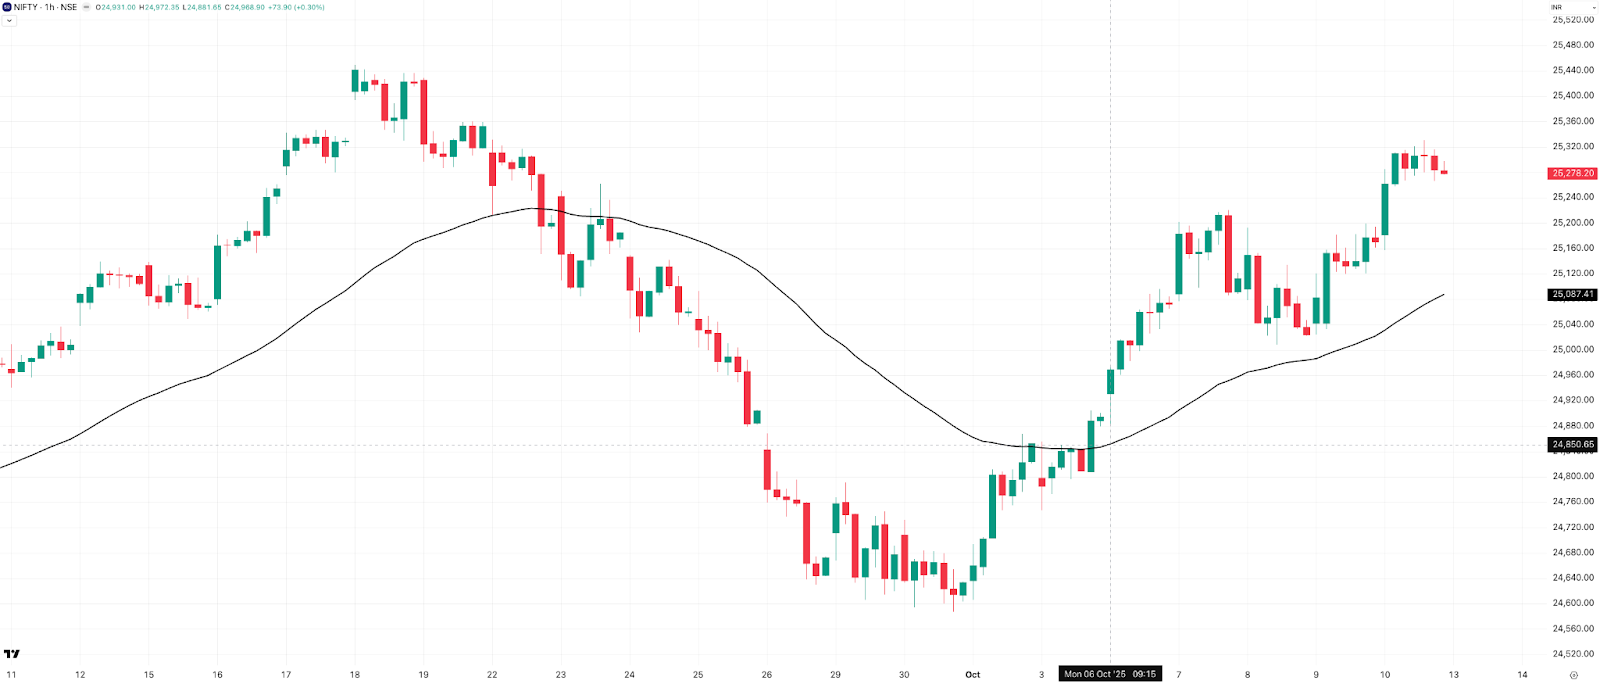
The index held comfortably above the 50-EMA throughout the week, showing strong underlying momentum. There was a brief pullback on Wednesday when prices fell from around 25,200 to 25,000, but the dip was quickly bought into over the next two sessions, confirming the strength of the uptrend. The chart continues to show a clean and well-defined uptrend, with higher highs and higher lows clearly in place.
Overnight vs. Intraday Moves
![]()
Most of the action this week came during market hours in the intraday segment, while overnight moves remained largely muted. For the year so far, Nifty remains up 7.59% on overnight moves cumulatively, and the intraday performance has just turned positive, thanks to this week’s positive intraday moves.
BANK NIFTY - Technical Analysis
Weekly Timeframe
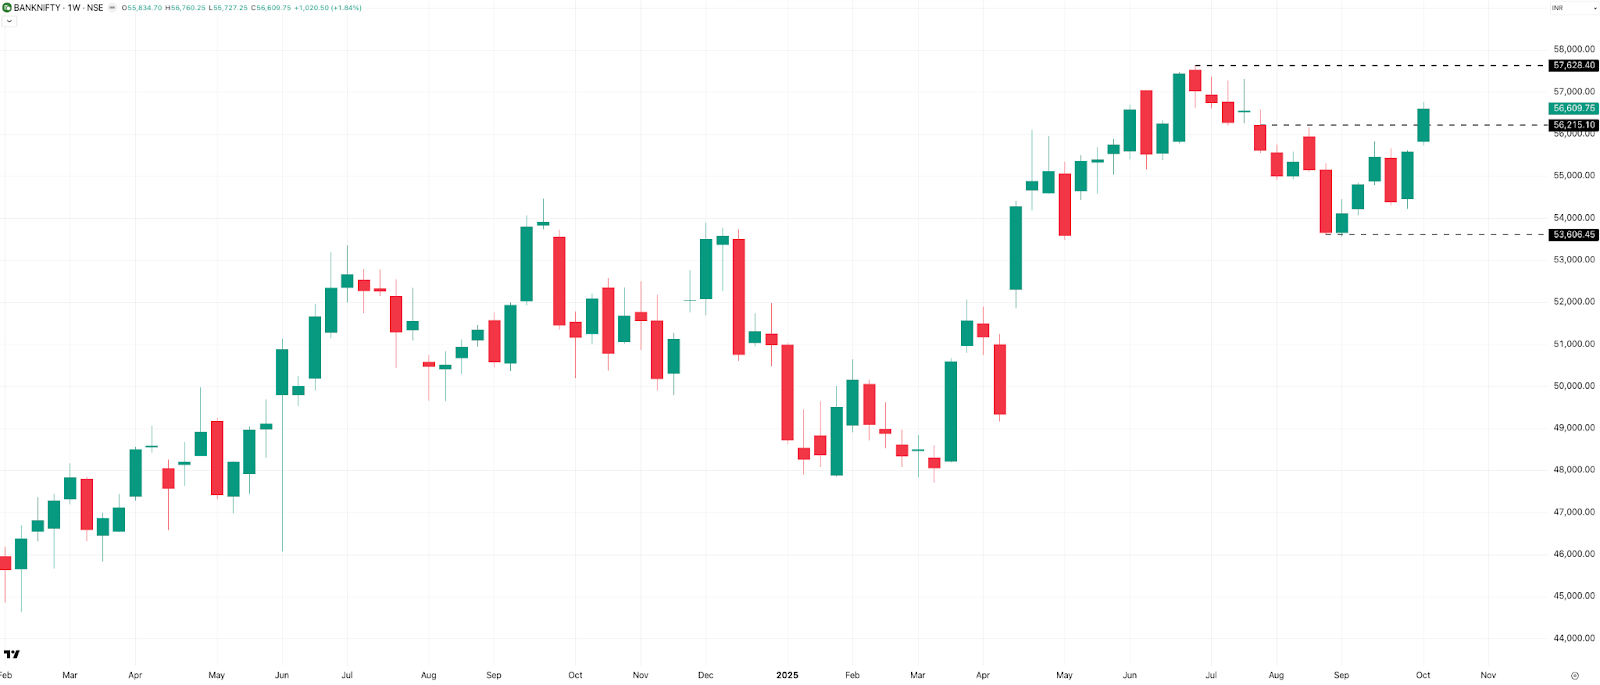
Bank Nifty is up 1.84%, or about 1,020 points, closing well above the key resistance at 56,200, which now turns into support. The next major hurdle is the all-time high at 57,629. While Nifty sits around 4% below its ATH, Bank Nifty is just 1.8% away. Will we see a new ATH in the coming week? Since we’re just about 1.8% away, the bull in me is certainly positive about it.
Daily Timeframe
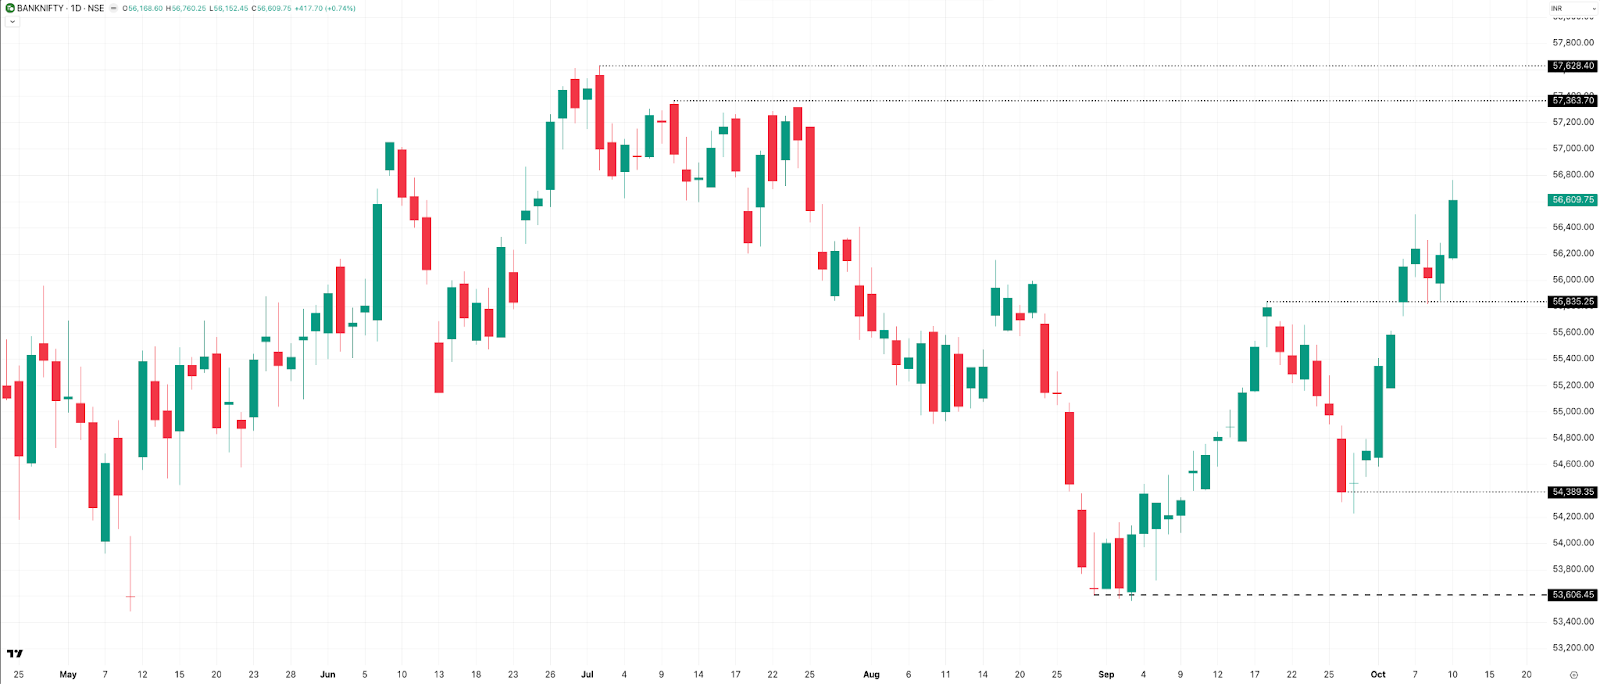
Bank Nifty is trading comfortably above the previous resistance of 55,800, which will now act as a strong support zone. The index had a strong week with four green sessions and only Wednesday closing in the red, highlighting the underlying bullish momentum. The next resistance lies between 57,350 and 57,600, very close to the all-time high level at 57,629.
Hourly Timeframe
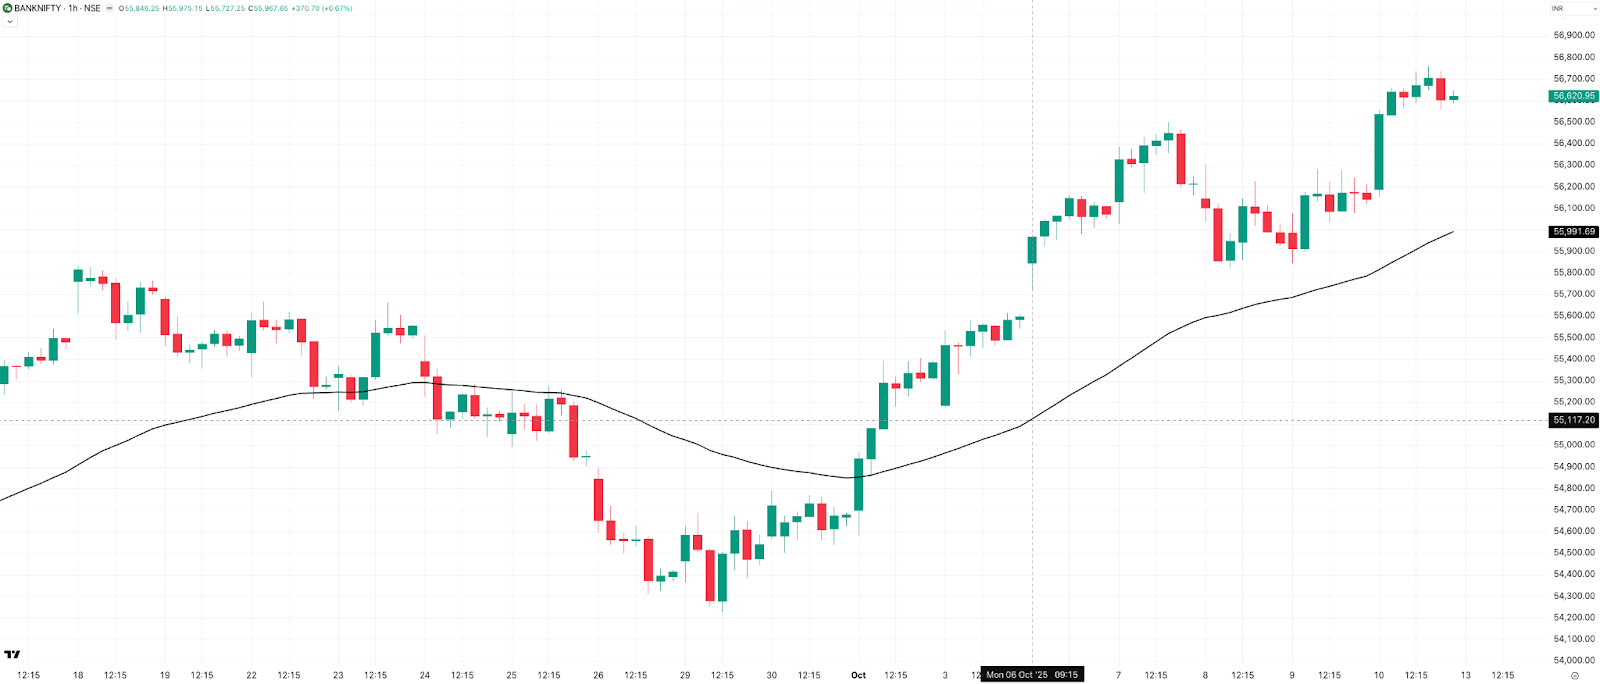
Bank Nifty shows a pattern similar to Nifty—staying consistently above the 50-EMA throughout the week, reflecting a steady and well-supported uptrend.
NIFTY MIDCAP SELECT - Technical Analysis
Weekly Timeframe
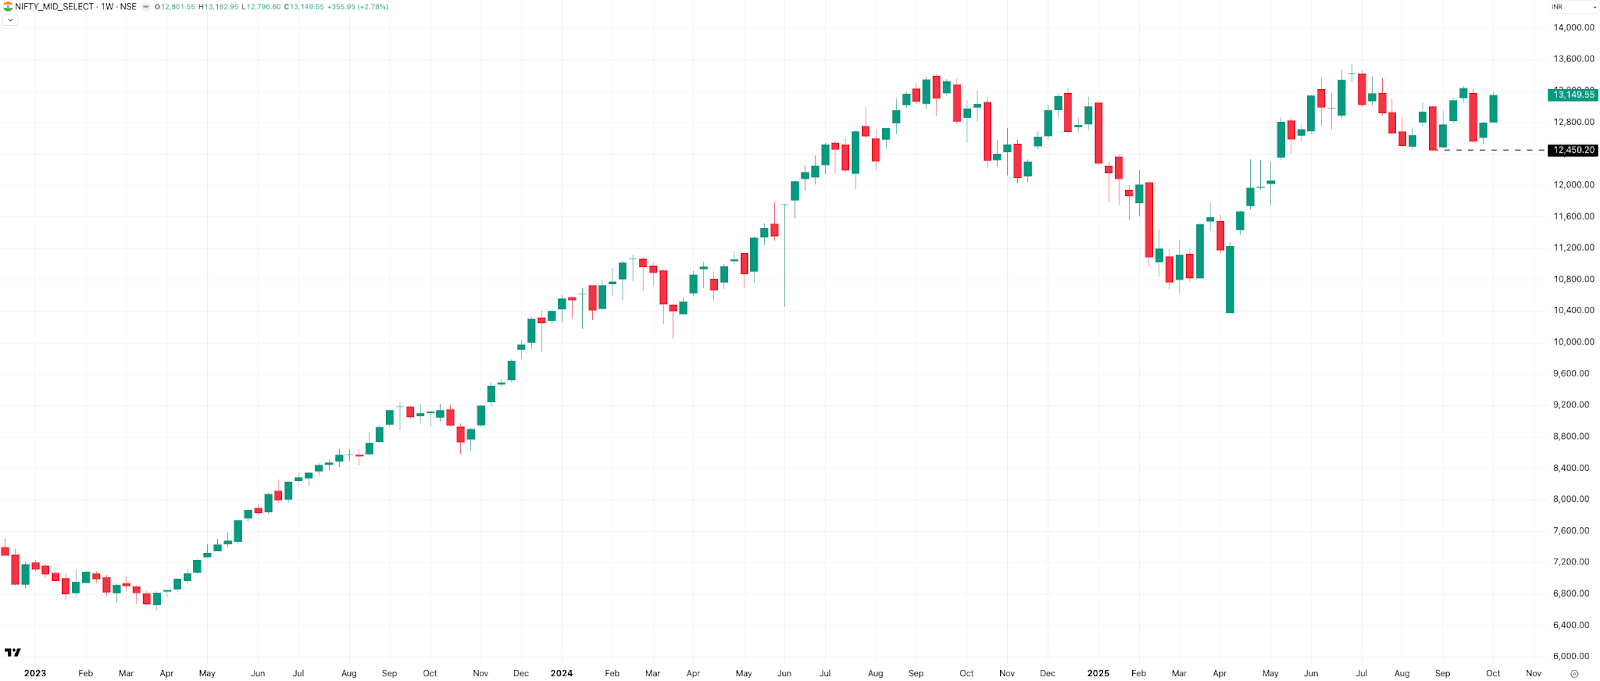
Nifty Midcap Select is looking strong—up 356 points or 2.78% this week, marking two straight green weeks. The index is showing solid momentum, holding above a strong support near 12,450. As long as it stays above that level, the bullish trend looks set to continue.
Daily Timeframe
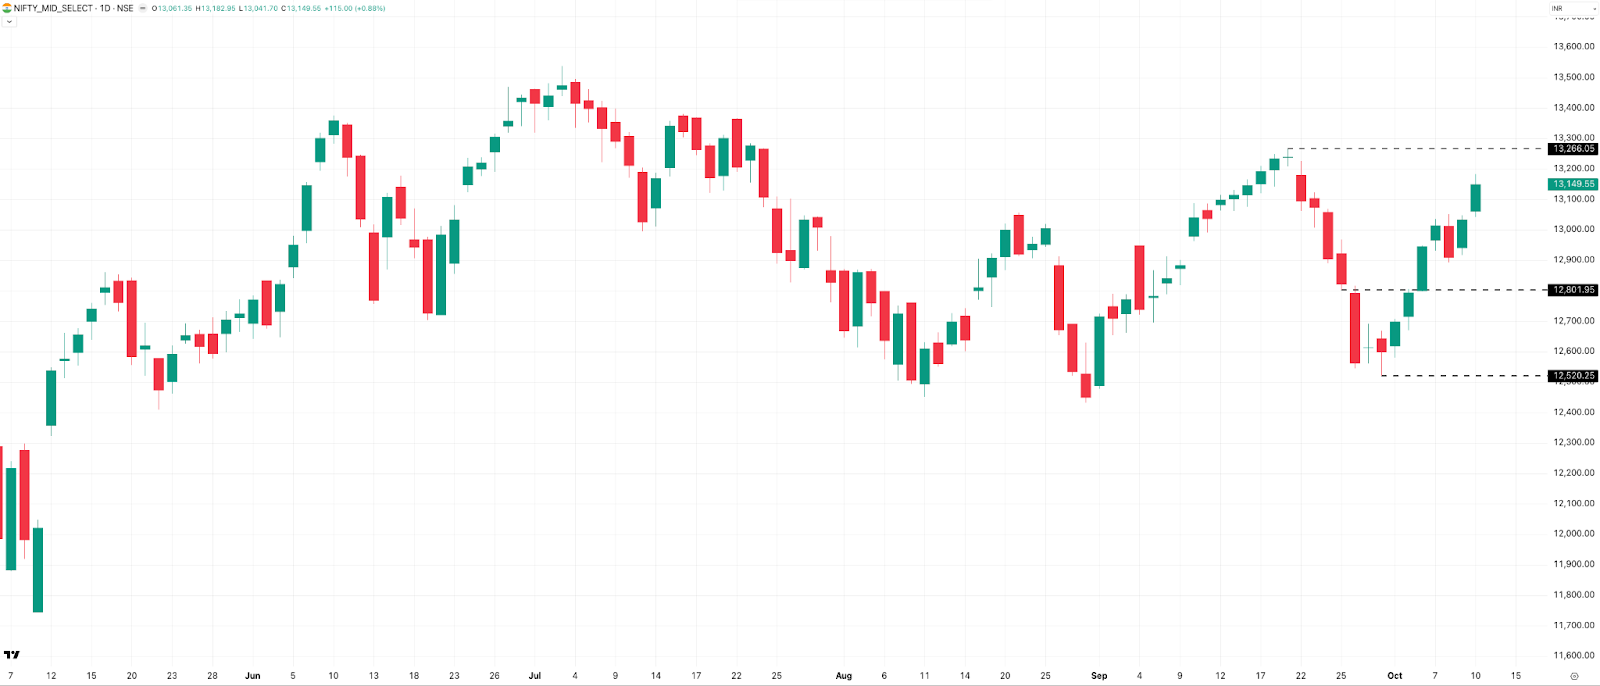
The index is showing a strong trend recovery. After forming a solid base around 12,500, it has moved up nicely over the past two weeks and is now approaching the key resistance near 13,260 (the recent swing high). As long as it holds above the 12,800 breakout zone, the structure remains positive, with higher highs and higher lows clearly visible.
A breakout above 13,260 will change the game and open a path towards a new ATH, which is around 3% away. Support levels are at 12,800, followed by 12,500. Overall, the momentum remains bullish for Midcap Select as well.
SENSEX - Technical Analysis
Weekly Timeframe
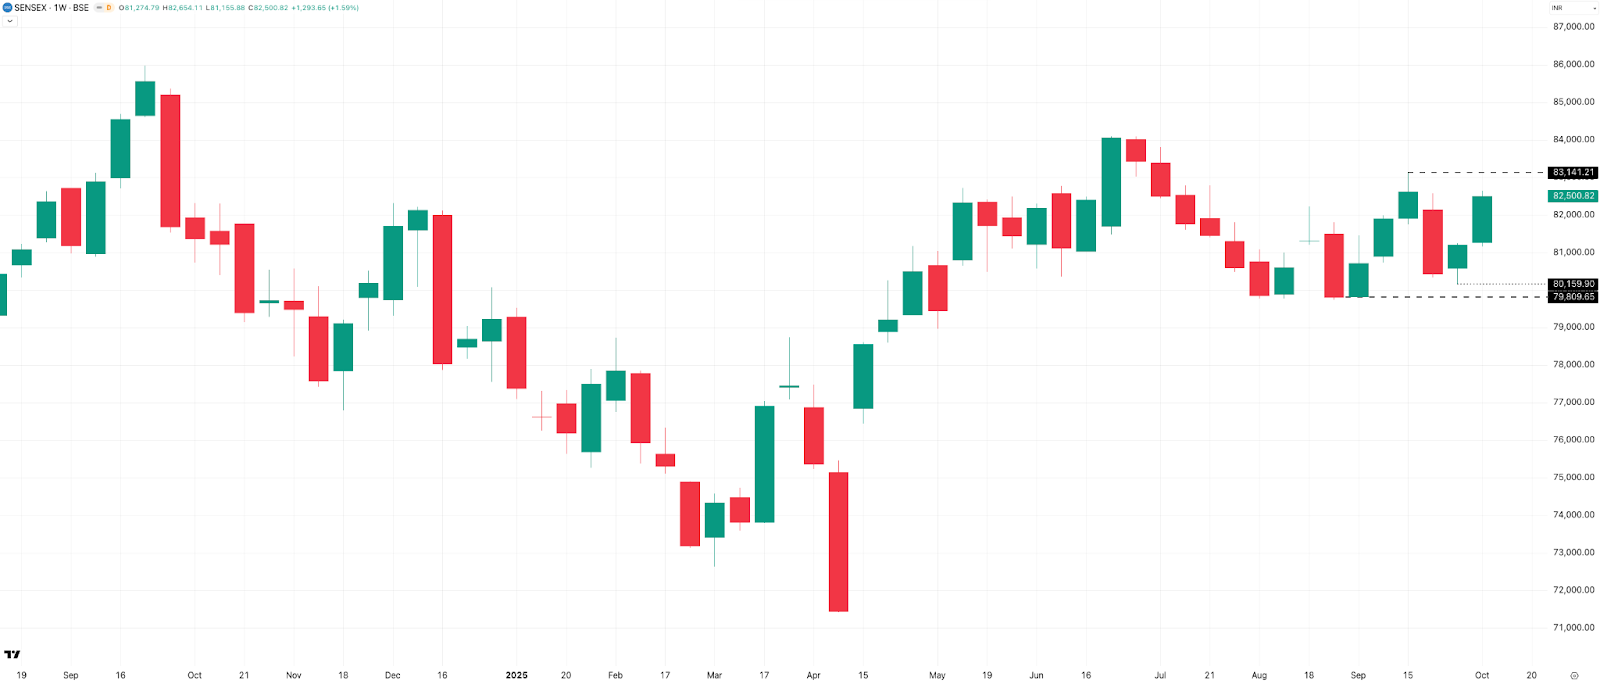
Sensex ended the week up about 1,294 points or 1.59%, showing solid strength and signaling bullish momentum like all other indexes. Key support zones are around 80,150–79,800, while resistance is seen around 83,100 levels. A breakout above that could open the door for new highs in the coming weeks.
Daily Timeframe
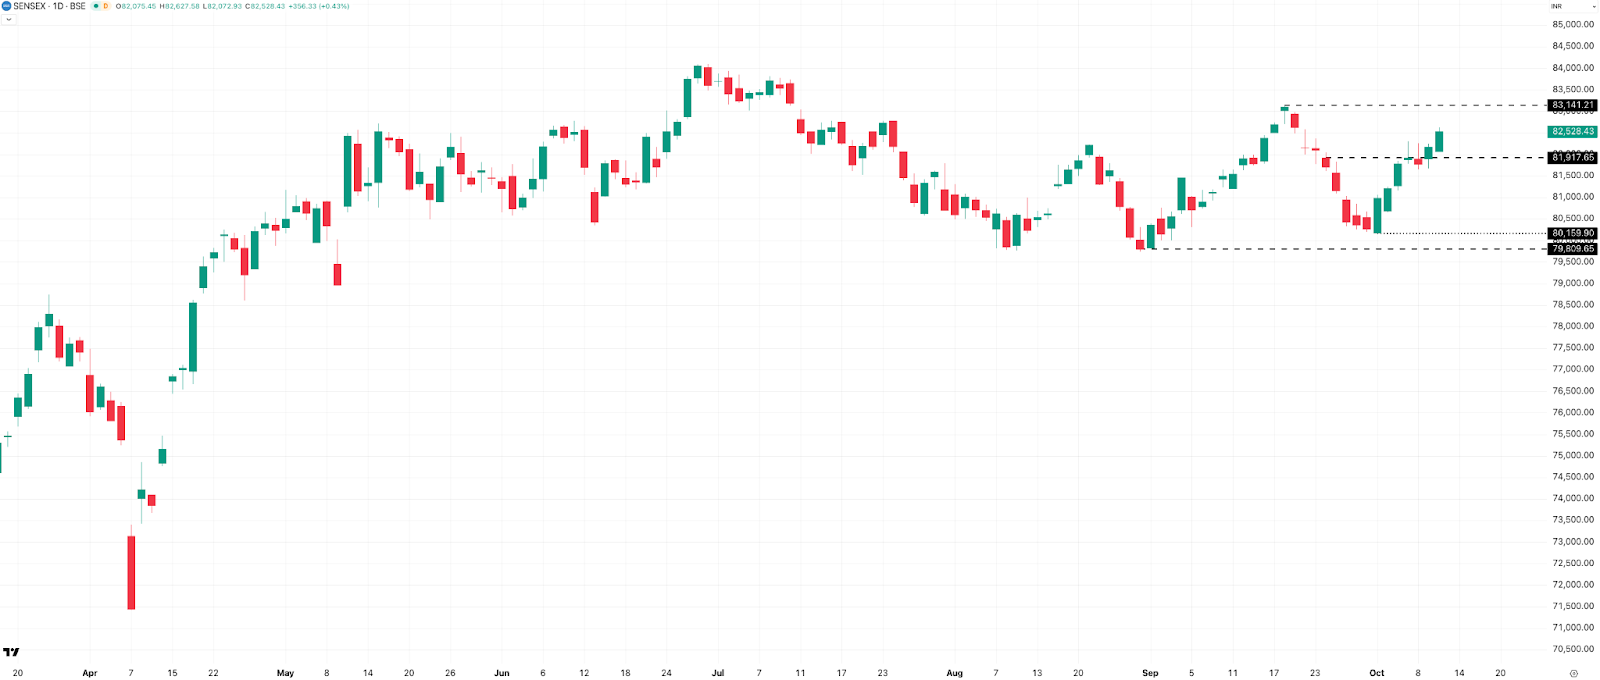
Sensex ended the week on a strong note, closing four out of five daily sessions in green. Monday led with a solid 0.72% gain, followed by Thursday’s 0.49% and Friday’s 0.40% rise, reinforcing the ongoing short-term uptrend. The index has reclaimed the 82,000 mark, which now acts as immediate support. A breakout above 83,100 should lead to a new ATH.
Market Metrics Summary
Rate of Change (YTD)
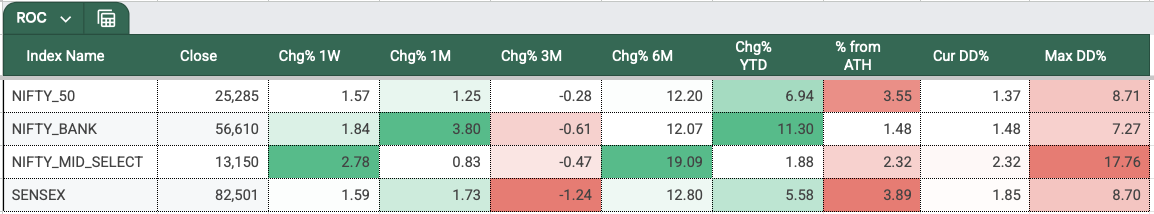
All major indices are now in the green. Until last week, the Midcap index was still in negative territory, but it has since turned positive. Bank Nifty continues to lead with impressive 11.3% YTD gains, followed by Nifty 50 up 6.94%, while Midcap Nifty remains the laggard with a modest 1.88% rise so far this year.
Directional Bias
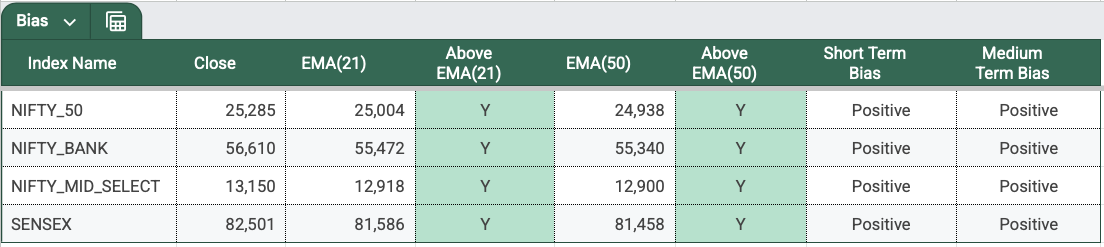
All major indices—Nifty 50, Bank Nifty, Midcap Select, and Sensex—are trading above their 21-day and 50-day EMAs, indicating strong momentum. Both short-term and medium-term biases remain positive, reflecting a broadly bullish market setup. All engines blazing sort of week!
Sectoral Performance
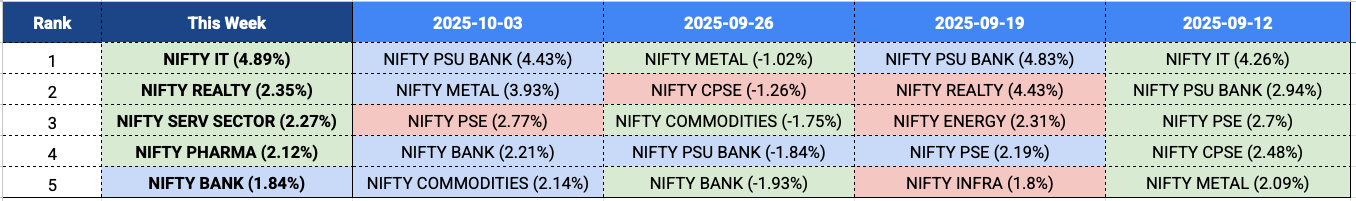
This week’s top sectoral performers saw four new entrants—Nifty IT (perhaps on the back of good news from IT incumbents such as TCS), Realty, Services, and Pharma—taking the lead. Bank Nifty continues its momentum from the previous week.
Volatility & Derivatives
Range and Expiries
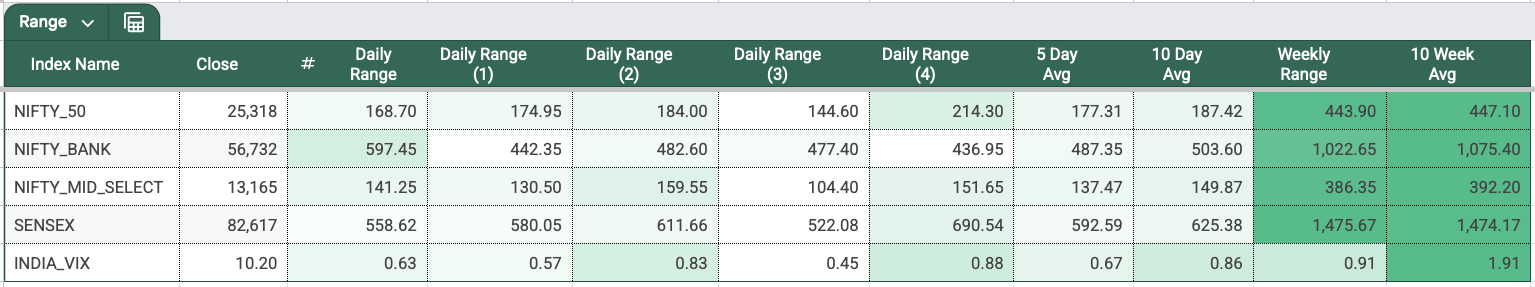
The range data shows that volatility remained moderate across major indices, with most trading near their 10-week average ranges. Nifty 50 saw a weekly range of 449 points, while Sensex moved 1,498 points—both consistent with recent averages.
The 5-day average range remains below the 10-day average range for all four major indices, indicating mildly subdued intraday volatility.
During the week, Nifty expiry on Tuesday witnessed a 145-point range with an M-shaped move, while the Sensex expiry on Thursday had a 580-point range forming a W pattern. Both sessions were tough for short vol traders, as sharp intraday swings and low option premiums left little room for profit. In short, it was a tough week for option sellers despite the seemingly contained ranges.
India VIX
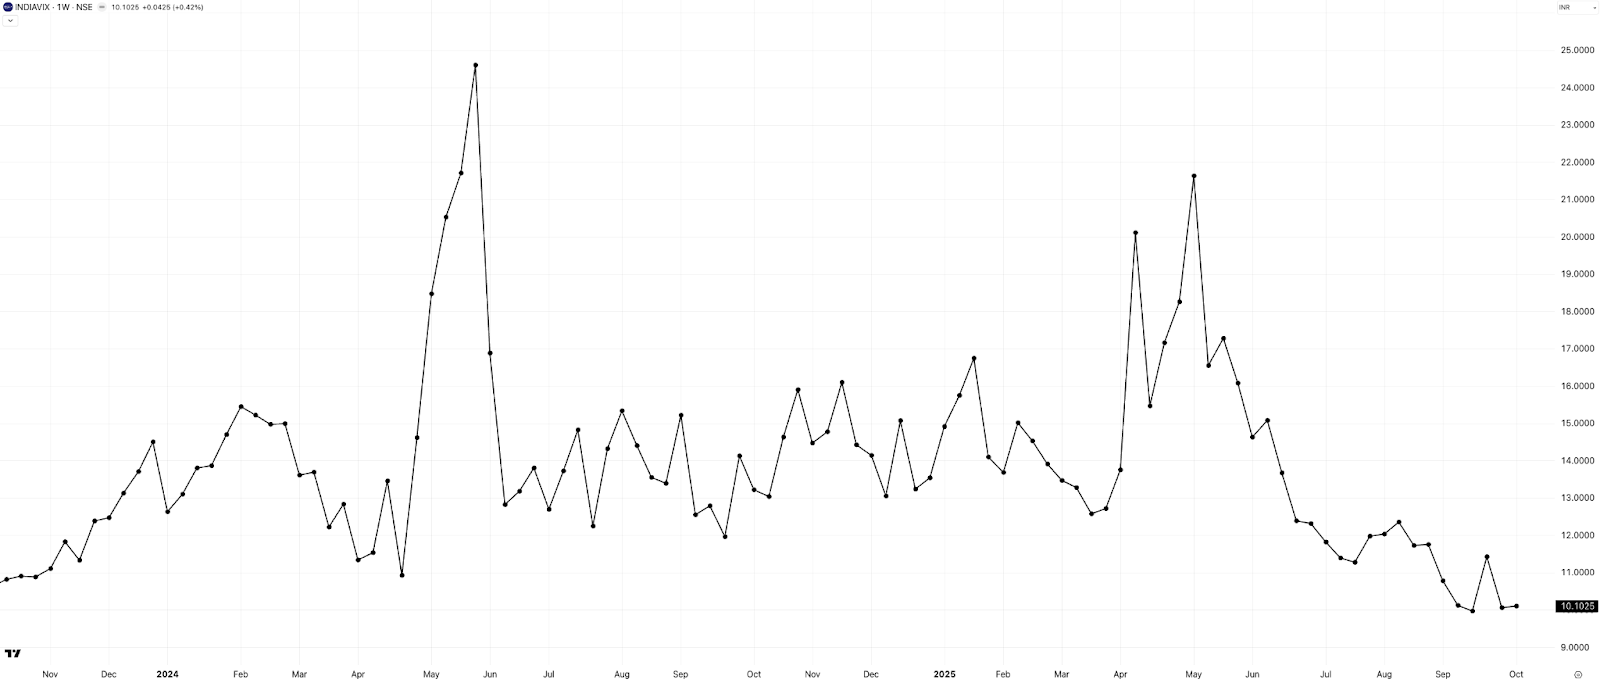
India VIX stayed nearly unchanged this week, hovering around 10 levels—possibly the lowest in many years. Such prolonged low volatility often reflects complacency in the market, with traders underpricing risk. While timing a reversal is tricky, history suggests that periods of extremely low VIX are often followed by mean reversion, meaning volatility could spike ahead if any catalyst triggers uncertainty. But we cannot time it—VIX can continue to be low for many weeks. Good time for trend followers, perhaps.
Commodities Update
It’s often said that gold moves in the opposite direction of the market, but this week that logic didn’t hold. Gold, in USD terms, surged past the $4,000 mark this week, while silver climbed above $50, breaking its previous all-time high from August 2011.
In India, gold rose 2.86% this week, while silver gained 2.33%, extending their strong momentum. However, silver ETFs are currently trading at unusually high premiums, so if you’re planning to invest, make sure to check the iNAV and LTP to understand the premium before buying.
Natural Gas fell sharply, losing over 5% this week, while Crude Oil slipped 0.62%, extending its downtrend.
Looking Ahead
We’ve had two consecutive positive weeks, and with Diwali just around the corner, a festive mood is likely to set in—bringing renewed positivity and momentum to the markets.
There are no market holidays next week, and no major scheduled economic events either, except for the Indian inflation rate announcements on Monday and Tuesday.
On a lighter note, María Corina Machado, the Venezuelan opposition leader, took home the Nobel Peace Prize this year—and not Donald Trump. So, let’s just hope he doesn’t get upset and make some crazy announcements over the weekend and spook the markets on Monday! Can never trust that man.
Till then, trade safe—and I’ll see you next week.
 References:
![]() 6 Key Market Metrics → • 6 Key Weekly Market Metrics You Should Tra…
6 Key Market Metrics → • 6 Key Weekly Market Metrics You Should Tra…
![]() Market Metrics Google Sheet → tinyurl.com/Market-Metrics-Sandeep-Rao
Market Metrics Google Sheet → tinyurl.com/Market-Metrics-Sandeep-Rao
Special Announcement
Before we forget, thanks to all of you, the In the Money by Zerodha YouTube channel has now crossed 10,000 subscribers in such a short time! ![]()
We are really grateful for your incredible support. We’ve been receiving amazing comments and feedback on our videos, and I deeply appreciate the time you take to share your thoughts. Please do keep them coming.
See you soon!