Hello and welcome to Weekly Market Metrics!
We’re already in week 43 of the year—can you believe that? Just nine weeks left in 2025! Just the right time to start writing down all that you would like to accomplish in 2026—just the way you did in 2025.
Anyway, let’s get back to business—time for our weekly dose of market metrics. Oh, and I hope you all had a fantastic Diwali week. I did, and as always, I traded on Muhurat as well.

Now, on New Year’s Day, there was a tweet from Prime Minister Modi addressing DJT—thanking President Trump for his phone call and warm Diwali greetings, and expressing hope that the two great democracies would continue to illuminate the world with hope and stand united against terrorism in all its forms.

Maybe this tweet had something to do with the +400-point rally in GIFT NIFTY on our Hindu New Year’s Day—even though the markets were closed! But when NIFTY finally opened on Thursday, it gapped up only 189 points, and then got sold off from around 26,100 all the way till 25,718 by Friday. So yeah… bulls (including me) were indeed dreaming of an all-time high, but that dream didn’t last long and reality came biting.
NIFTY 50 - Technical Analysis
Weekly Timeframe
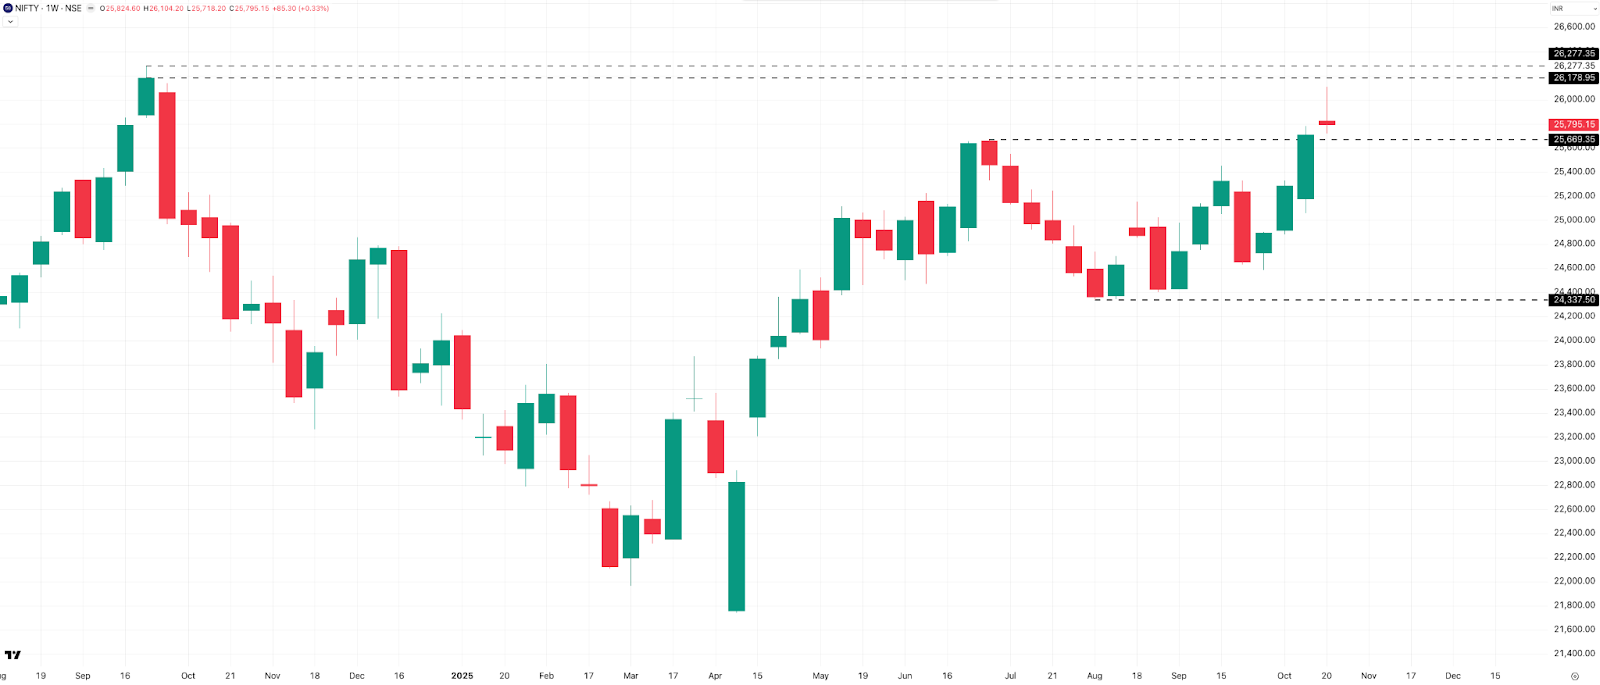
Starting, of course, with everyone’s favorite… NIFTY Weekly!
After nearly 15 weeks of consolidation, NIFTY finally seems to be showing some action. This week’s candle? A Bearish Doji—and for those who don’t speak fluent candlestick, that’s a bearish reversal pattern.
It usually comes up after an uptrend, and what it tells us is pretty interesting—buyers tried to push prices higher during the week, but by the end, sellers took control and dragged it right back down near last week’s close level.
Now, before anyone jumps to conclusions—remember, just one doji candle alone doesn’t make a trend. The real story comes from the next candle—that’s when we get the follow-through confirmation. So next week, we’ll be watching closely to see if we actually get a reversal from the 26,100 level and if bulls still have some fight left.
This week, NIFTY moved up by 85 points, closing at 25,795, which is about a 0.33% gain from last Friday’s close. As we discussed last week, resistance still sits around the 26,200 to 26,300 zone—that’s the all-time high area—but a new minor resistance seems to be forming at 26,100, this week’s high. On the flip side, support is holding steady near the 25,670 level.
So, for now—NIFTY’s still range-bound, but that Doji is keeping me a bit puzzled.
Daily Timeframe
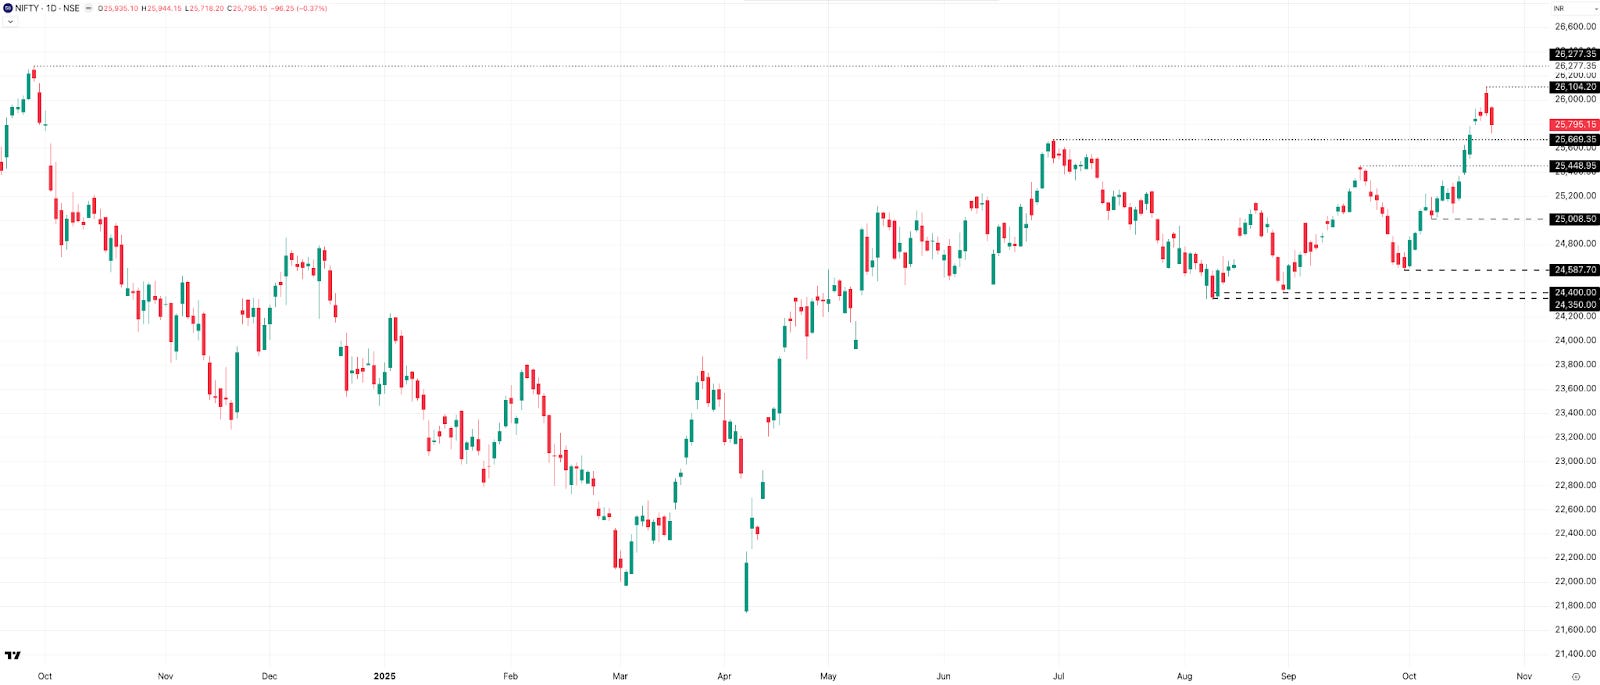
NIFTY printed three red candles this week—including the Muhurat trading day—and just one green candle on Monday. The resistance and support zones remain the same as on the weekly chart—26,100 and 26,277 on the upside, and 25,670 as support.
As we discussed last week, we were expecting a short-term pullback toward the 25,670 zone—and that’s exactly what started playing out from Thursday into Friday, with NIFTY hitting a low of 25,718. From the week’s high at 26,104, we’ve seen about a 386-point, or roughly 1.5%, drop—confirming that the market’s taking a bit of a breather here—something I had pointed out last week as well.
Hourly Timeframe
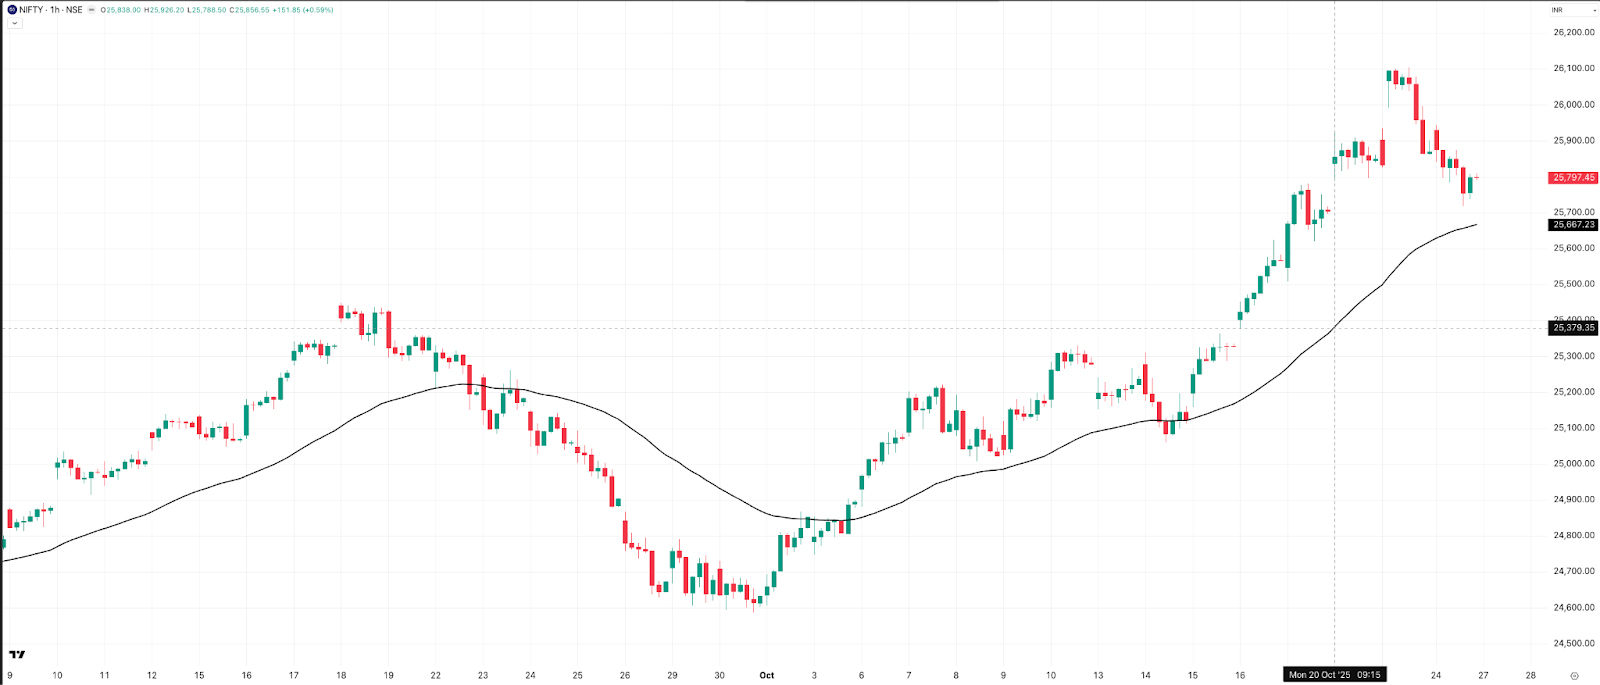
NIFTY has comfortably held above the 50 EMA throughout the week. It’s now been about 10 calendar days, or 7 trading sessions, since NIFTY last dipped below that level—and during this stretch, the index has added roughly 600 points.
However, with this recent pullback, the price is now catching up to the EMA, which itself has been gradually rising. Right now, the gap between the price and the EMA is around 125 points, or roughly 0.5%.
The big question for next week is—will the price test and possibly breach that 50 EMA, or will the EMA hold strong as support once again? Only time will tell.
Overnight vs. Intraday Moves
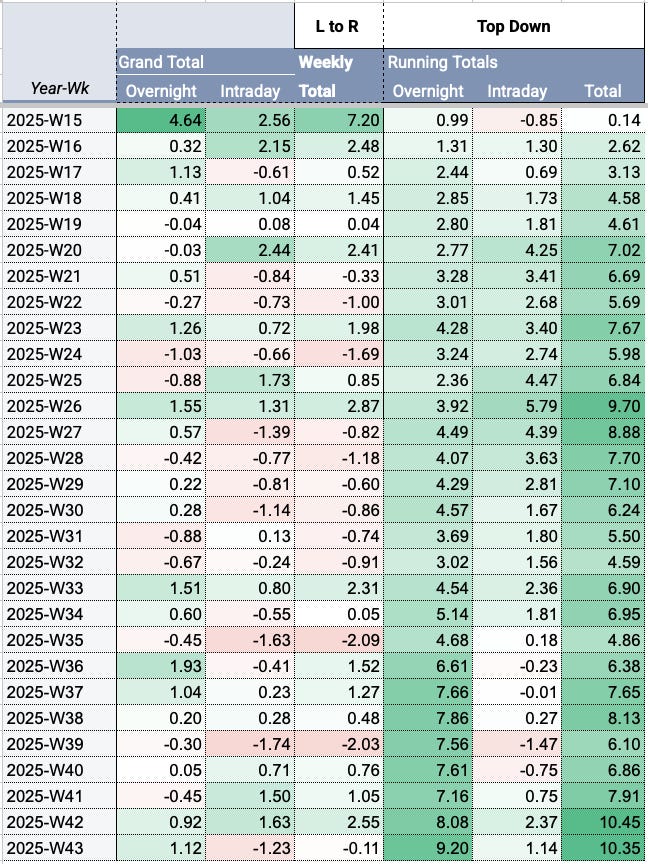
The pattern was pretty clear this week. The index moved up overnight, but then gave up nearly all those gains during intraday trading. For the week, the overnight move came in at +1.12%, while the intraday move was -1.23%.
Looking at 2025 year-to-date, NIFTY has gained about +9.2% overnight, but only +1.14% intraday—showing that most of the upside so far this year has actually come outside of regular trading hours.
BANK NIFTY - Technical Analysis
Weekly Timeframe
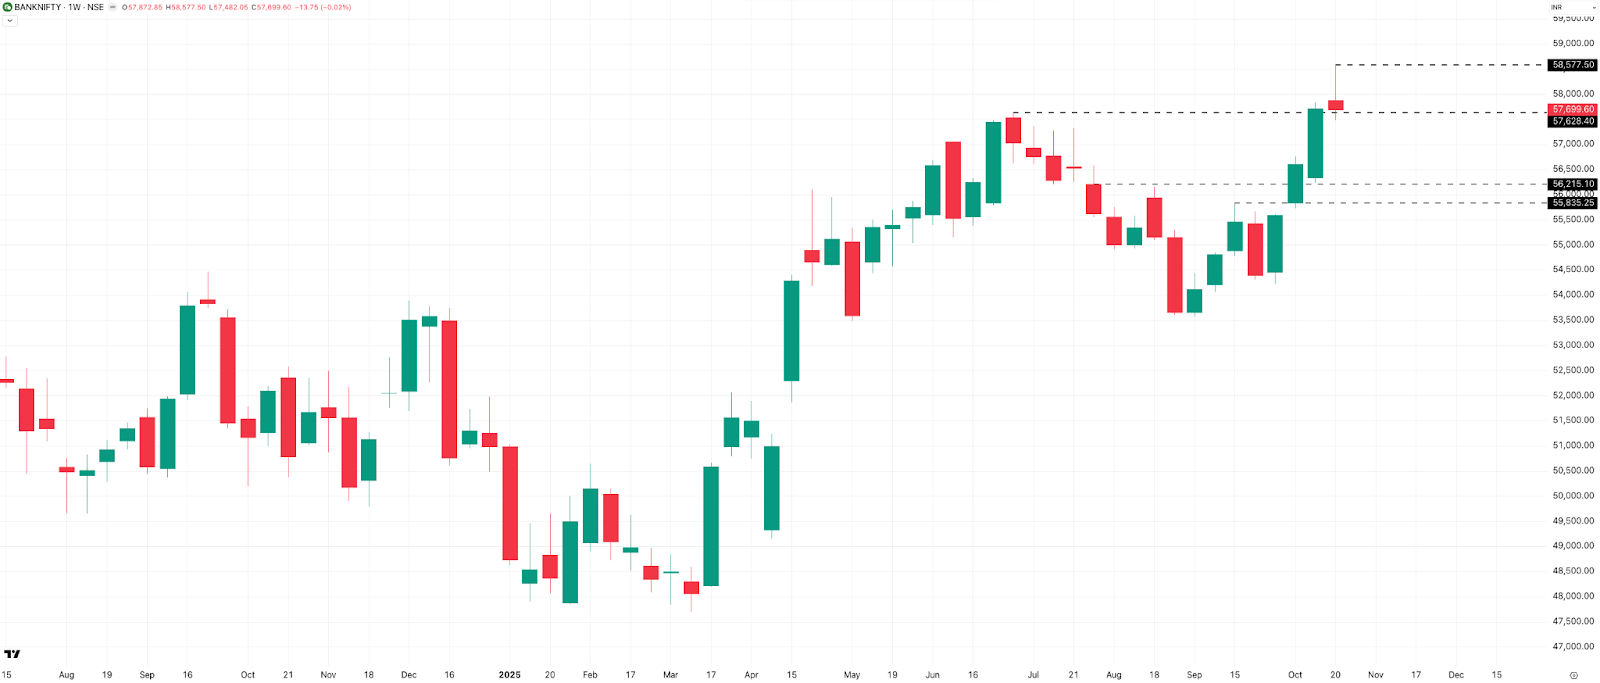
After hitting a new all-time high last week, Bank Nifty also formed a Shooting Star candle, hinting at possible reversal or consolidation in the coming sessions. It could be a sign of some profit booking at higher levels before the index decides whether to continue its rally on the upside.
For the week, Bank Nifty closed almost flat, down just 14 points from last Friday’s close. On the levels front, resistance is now at this week’s high near 58,600, while support sits around the 57,600 zone.
Daily Timeframe
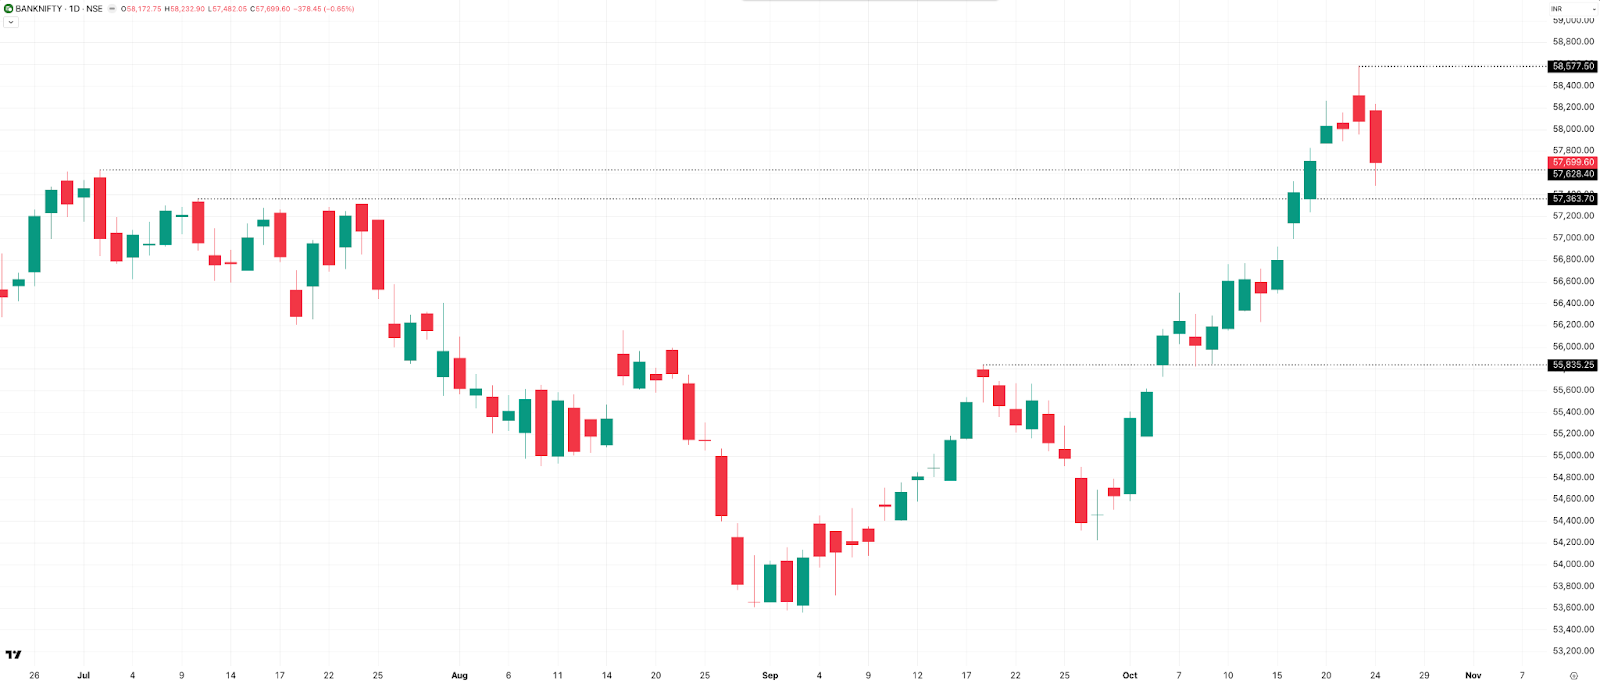
The resistance and support zones remain largely the same as on the weekly chart, with resistance around 58,600 and support between 57,600 and 57,400. Just like NIFTY, Bank Nifty also printed one green candle and three red candles this week, including the Muhurat trading day.
This looks more like a healthy pullback or retest phase rather than a full-blown reversal—as long as those major support levels hold, the uptrend should remain intact.
Hourly Timeframe
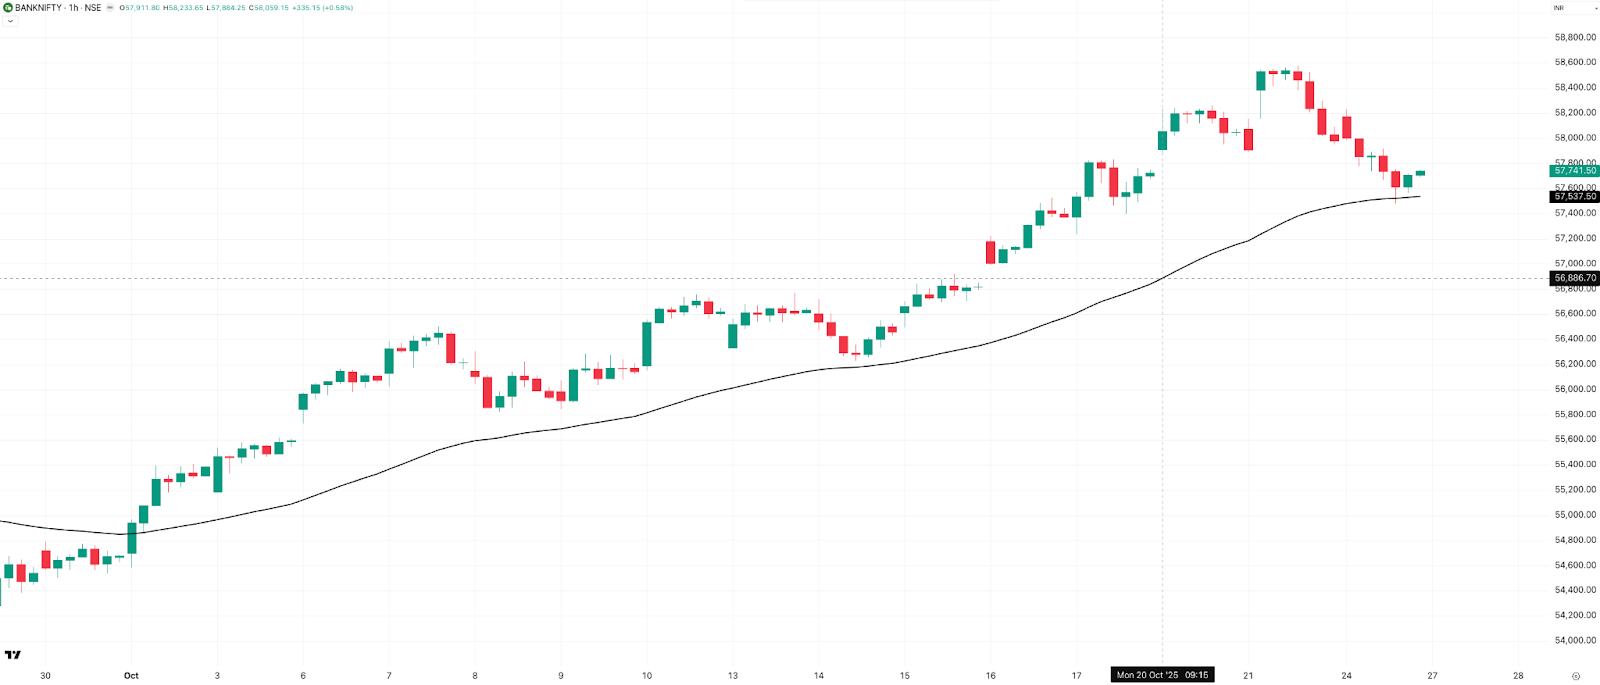
Bank Nifty is still trading above the 50 EMA. It’s now been about 23 calendar days, or 16 trading sessions, holding consistently above this level. On Friday, it briefly tested the EMA but managed to close back above it.
During this entire stretch, Bank Nifty has gained nearly 2,800 points. As of Friday’s close, it’s still holding about 162 points above the 50 EMA, which translates to roughly 0.28%—showing that the short-term trend remains bullish, at least for now.
NIFTY MIDCAP SELECT - Technical Analysis
Weekly Timeframe
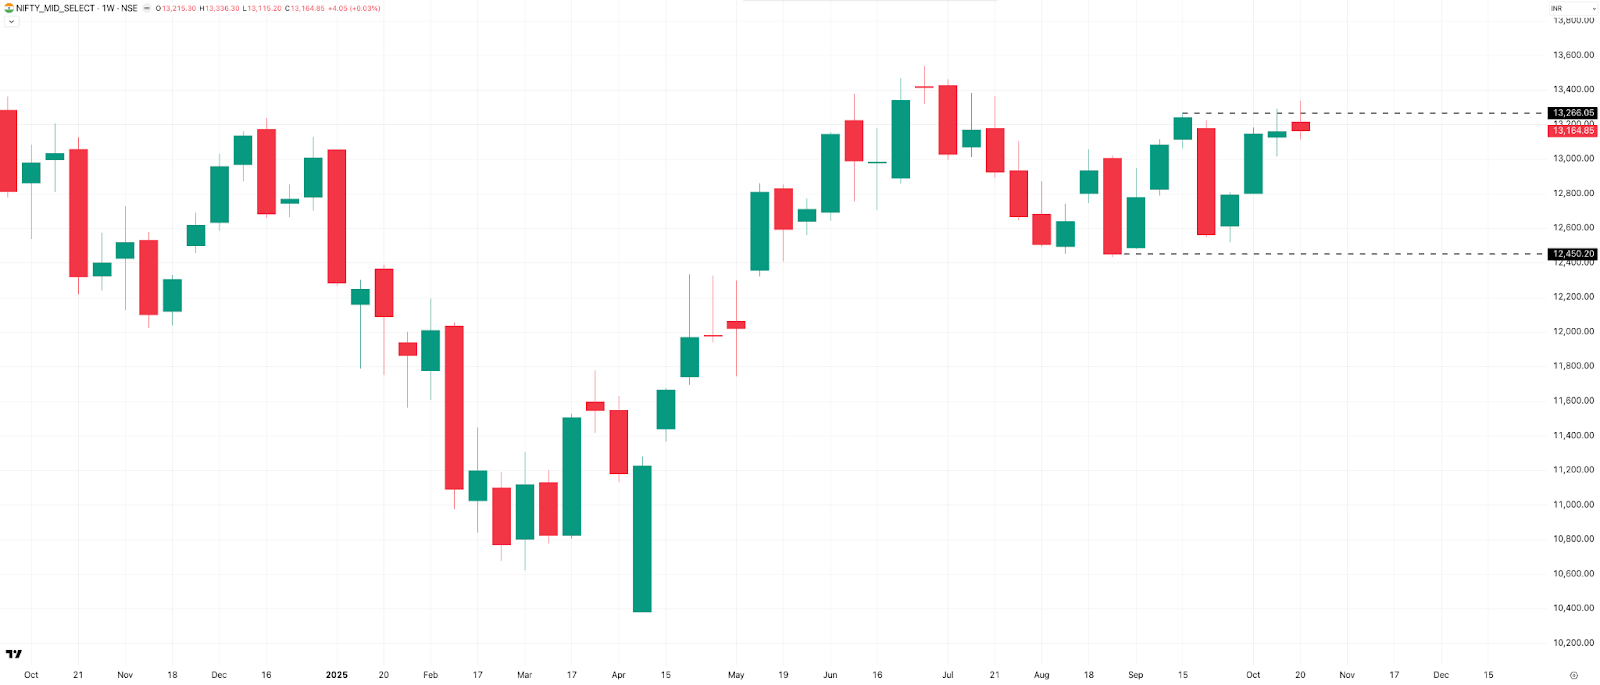
As we’ve discussed in the past couple of newsletters, Nifty Mid Select is still struggling to close above its major resistance level at 13,260. This week, the index touched a high of 13,336, but eventually closed at 13,165, which is only 4 points higher than last week’s close.
The resistance zone remains the same—13,260, along with this week’s high at 13,336—while immediate support sits near the 13,000 mark, which also happens to be a big round number and an important psychological level.
Daily Timeframe
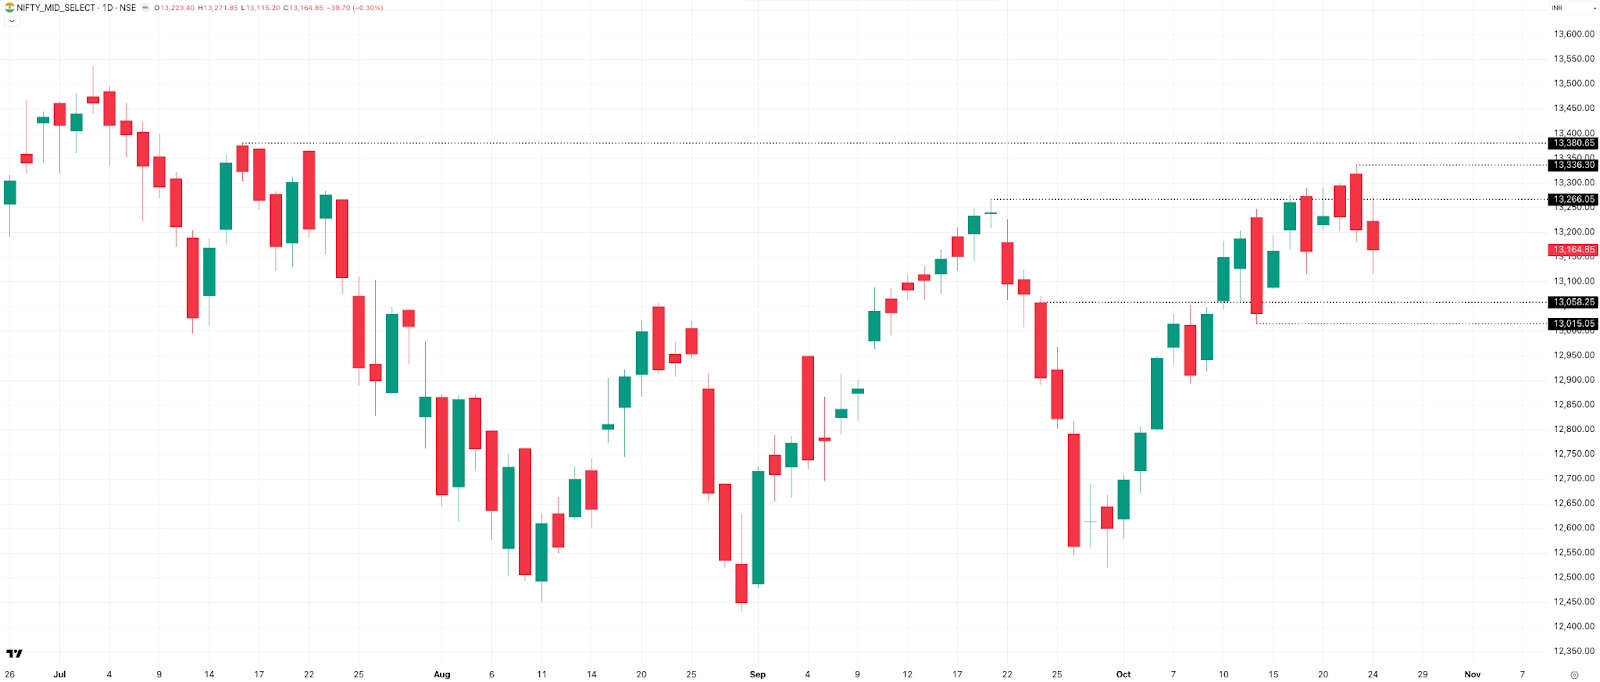
Nifty Mid Select had a tough week, with the last three sessions closing in red and only Monday managing to print a green candle. The resistance zones remain unchanged from the weekly chart—the first one around 13,266, followed by 13,336, which is this week’s high, and then near 13,380. On the downside, supports are also similar to the weekly levels, in the 13,050 to 13,000 zone.
SENSEX - Technical Analysis
Weekly Timeframe
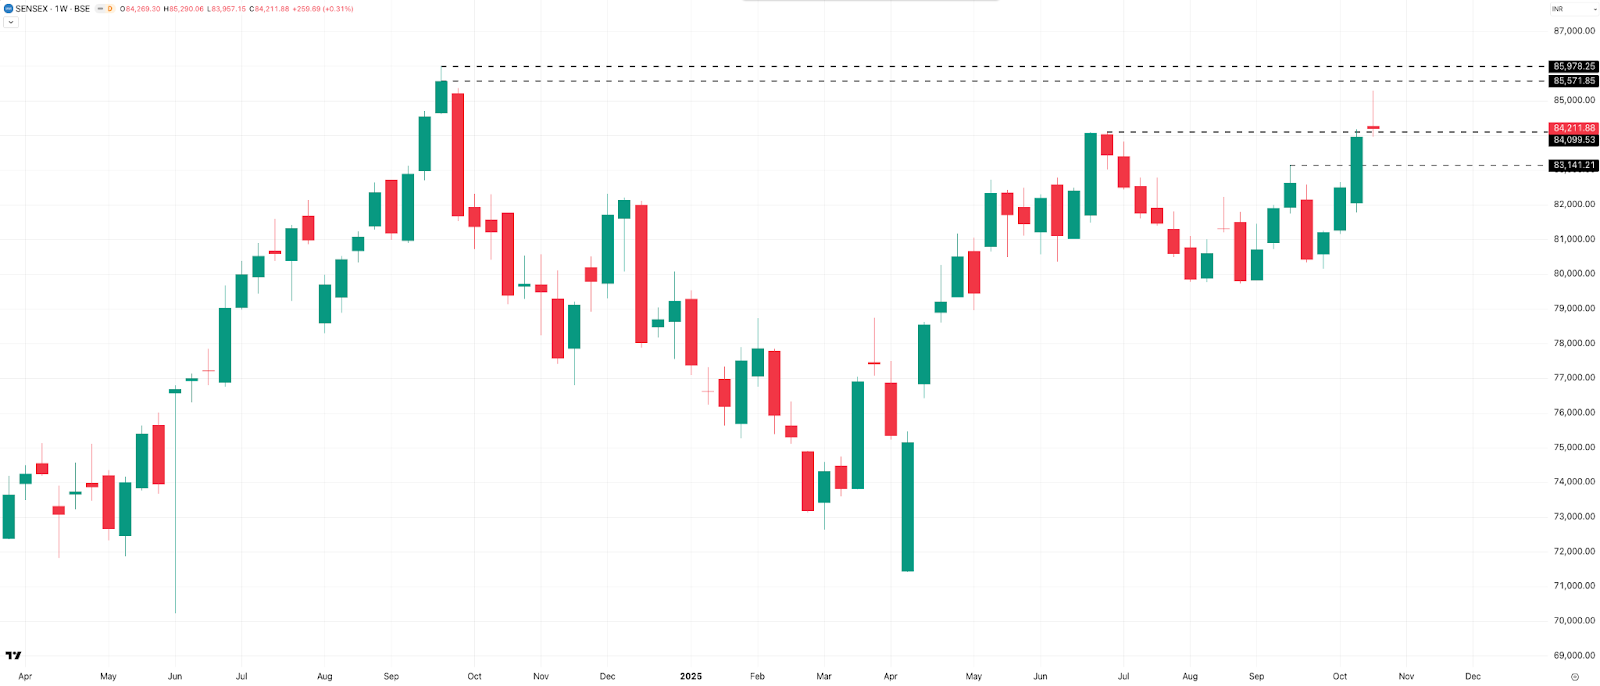
The Sensex gained 260 points, or about 0.3%, compared to last week’s close. The structure looks quite similar to NIFTY and BANK NIFTY on the weekly chart. Resistance levels are seen near the all-time high zone between 85,600 and 86,000, while support lies around the 84,100 level.
Daily Timeframe
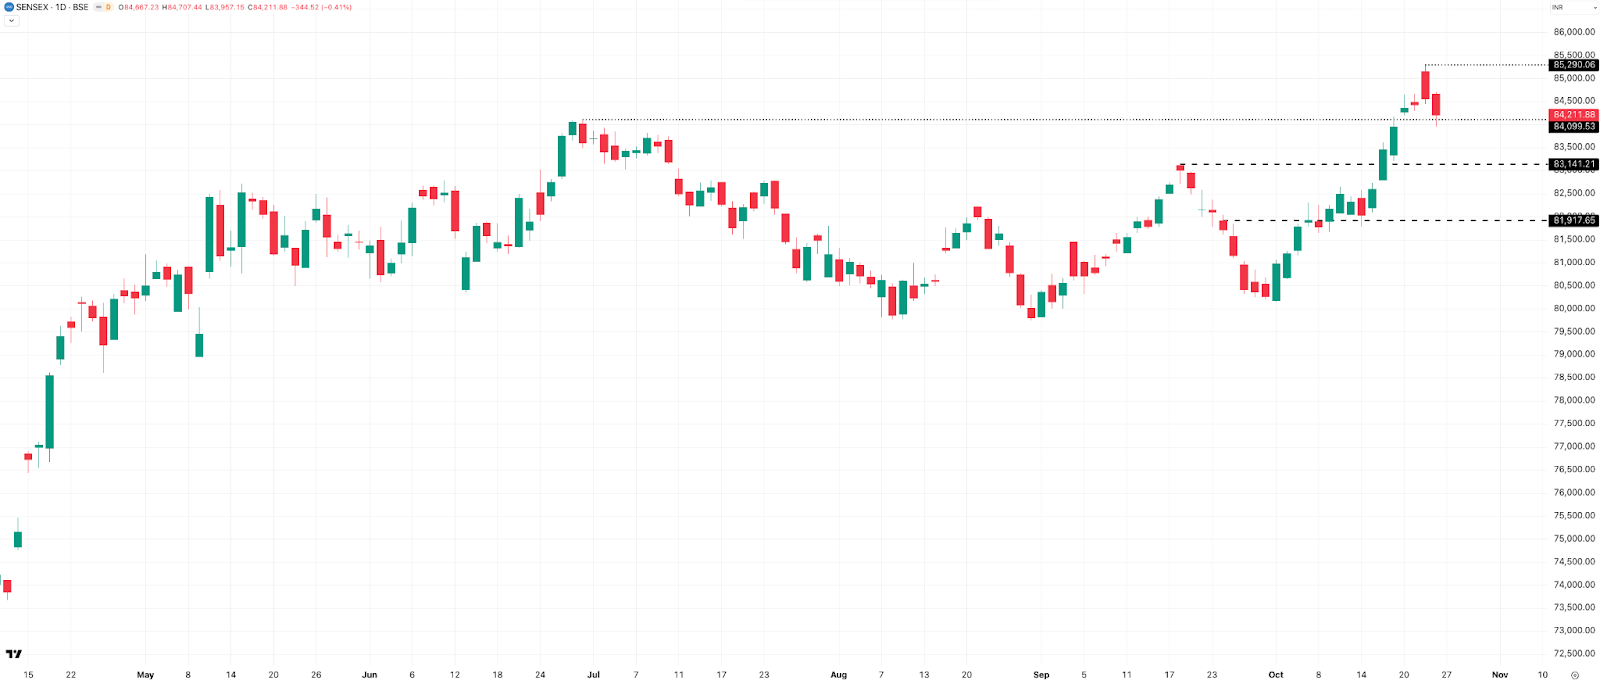
The Sensex is showing a pattern very similar to NIFTY, with the price action reflecting consolidation throughout the week. Resistance is seen near 85,300, which is this week’s high, while support remains around 84,100, in line with the weekly levels.
Market Metrics Summary
Rate of Change (To-Date Performance)

The 1-month-to-date performance across all major indices looks solid. It truly was a happy Diwali for the markets. On a week-to-date basis, the markets remained largely flat, with no major directional move. All key indices ended the week on a muted note.
Looking at the year-to-date numbers, Bank Nifty continues to lead the pack with an impressive +13.5%, followed by NIFTY at +9.1%. Meanwhile, Nifty Mid Select is still lagging behind, up only about +2% for the year. Clearly, all the momentum this year has been concentrated in the large-cap indices like NIFTY50, while the mid and small caps have been taking a breather.
Maybe this just isn’t the year for midcaps… who knows—we still have two more months to go. Let’s see.
Directional Bias
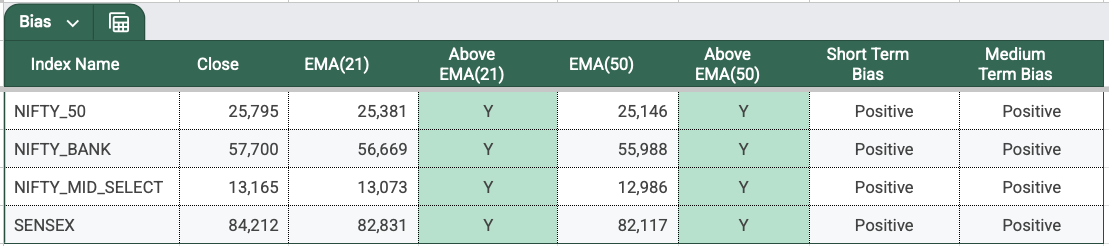
Even with the pullback we saw this week, the short- and medium-term directional bias remains positive across all major indices—all 4 indices are trading above their 21 and 50 period EMA on a daily timeframe.
Sectoral Performance

NIFTY IT clearly stood out, leading the pack with a 3% gain, showing up at the top after a week’s break, followed by PSU Bank at 2.3%, METAL at 1.45%, MEDIA at 1.35% and CPSE at 0.9%. All five sectors were new entrants to the top performers’ list this week.
Volatility & Derivatives
Range and Expiries

With the holiday on Wednesday, we only need to focus on the shorter trading week. On Monday, which was an expiry day, NIFTY recorded the lowest range of the week at 138 points, followed by Friday at 226 points.
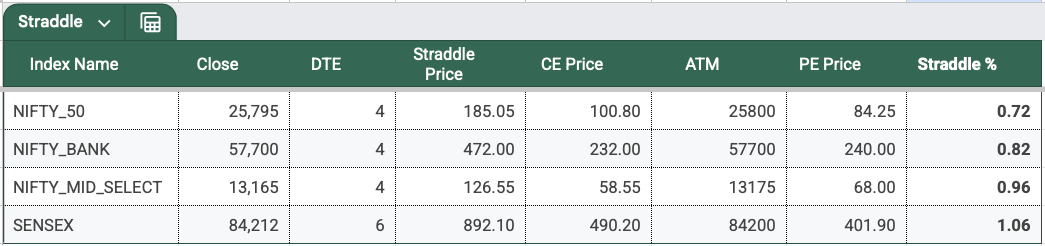
Sensex, on the other hand, showed much wider movement, with the highest range coming on Thursday’s expiry at 845 points, followed by 750 points on Friday. Overall, the range stayed pretty much in line with the average—around 180 to 200 points—which also matches NIFTY’s 2DTE EOD ATM straddle price, hovering near 185 points.
Now, talking about the NIFTY expiry, it was relatively calm except for some volatility in the opening hour—the index dropped about half a percent from the high till 9:50 AM, and later fell another 113 points from the 1 PM high, before finally closing 133 points or half a percent above Friday’s close.
Sensex expiry, however, was a completely different story—anything but calm. After an initial volatility crush that hit option premiums, the index saw a massive 1,000-point drop post 1:15 PM, with straddles pricing less than 200 points in premium. Needless to say, it was a great day for option buyers—or technically, those long on volatility or gamma—but for the short-vol players, it was a bloodbath.
India VIX
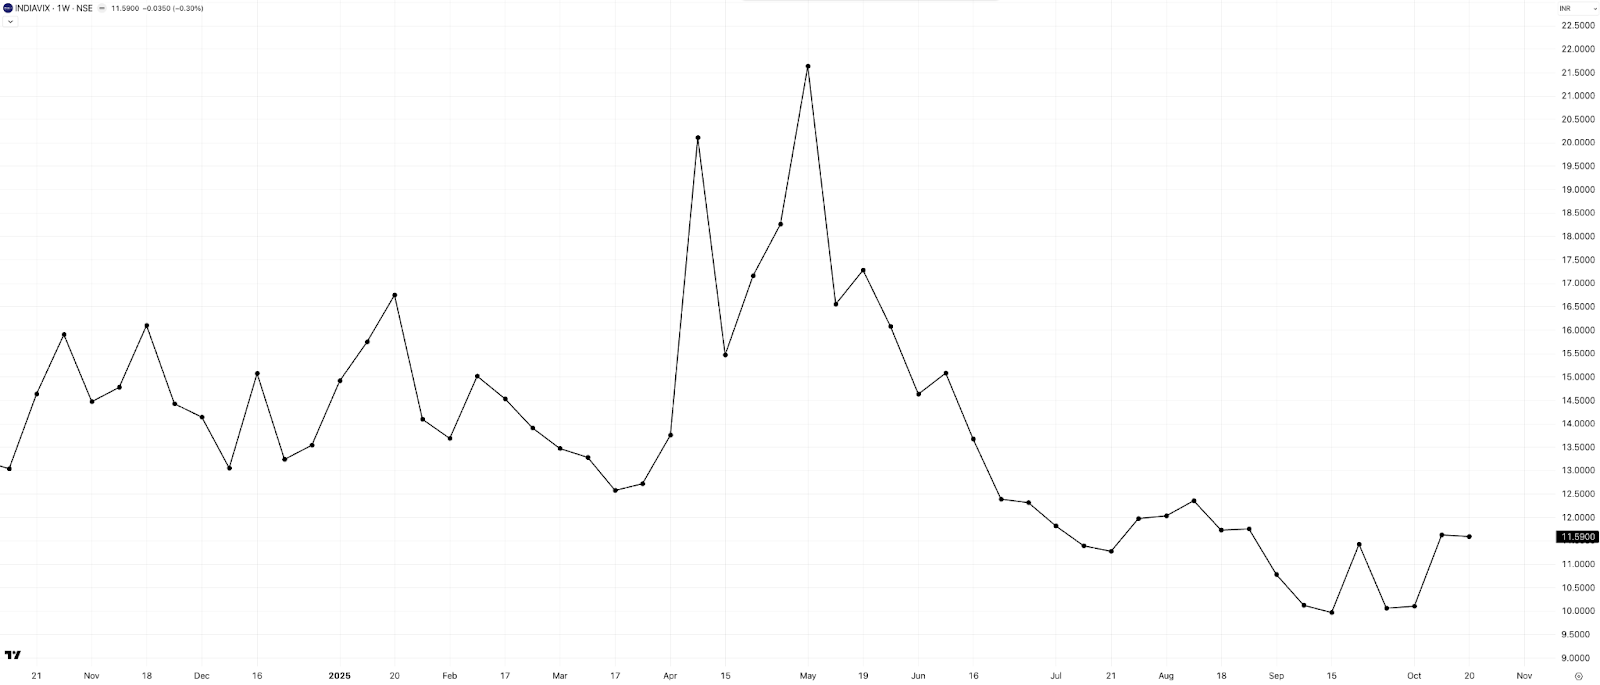
VIX stayed largely unchanged from last week, hovering around the 11.6 level, and the NIFTY 2DTE at-the-money (ATM) straddle premiums closed near 185 points—roughly pricing in a 0.72% move on either side until expiry.
Commodities Update
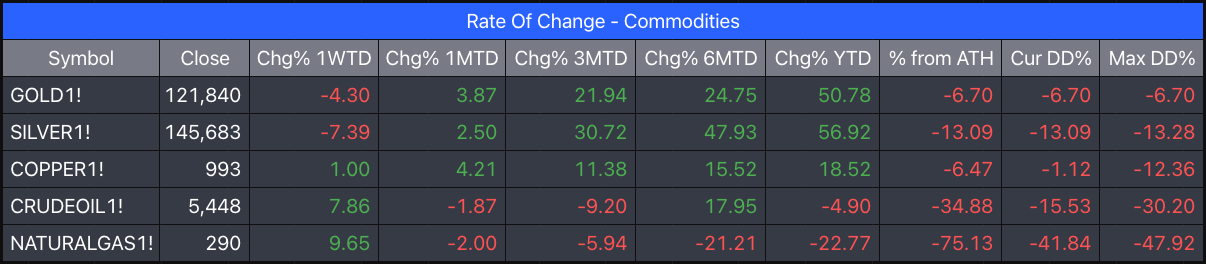
(Data: MCX Continuous Futures - Back Adjusted)
After a relentless rally in the past few weeks, both Gold and Silver finally took a breather, slipping about 4.3% and 7.4% respectively this week.
That said, the month-to-date performance for both metals still remains positive, and their year-to-date returns continue to look spectacular when compared to the equity indices.
On the energy side, after a negative week earlier, it’s making a comeback—Crude Oil jumped 8%, while Natural Gas surged nearly 10% this week, though both still remain negative year-to-date.
Summary & Looking Ahead
The market played a trick on us this week. We thought we would make a new all-time high (ATH) this week, but the Nifty just couldn’t hold those gains and failed to close strong. After two weeks in green, the nifty closed just 0.33% above last week.
There was a pullback across all major indices this week, with Bank Nifty trading close to its previous all-time high. The IT sector showed solid strength, leading the gainers. But the sell-off on Thursday and Friday raises the question—was this just a pullback, or are we setting up for a deeper move lower next week?
Let’s hope this is just a healthy pullback before the next leg up, and maybe we’ll see some fresh all-time highs soon. Fingers crossed.
What to Expect Next Week
Next week marks the monthly expiry for all NSE F&O stocks and indices—including NIFTY, BANK NIFTY, and MIDCP NIFTY—on Tuesday. So, make sure to roll over your futures and options positions in time!
For NIFTY, the key levels to watch around expiry are 26,000 and 26,100—those will be the battlegrounds between bulls and bears. Let’s see if the bulls can finally push through, or if the bears manage to keep it capped below 26,000.
Sensex monthly expiry is coming up on Thursday, the 30th of October—and with that, next week will also mark the end of the month.
We also have the U.S. Fed interest rate decision coming out on Wednesday at 11:30 PM IST, so don’t be surprised if we see a bit of volatility in Thursday’s session.
That’s pretty much this week. Have a nice weekend. And yes—don’t forget to subscribe to this channel.