Hello and welcome to Weekly Market Metrics! I’m Sandeep Rao.
We’re in week 45 of the year—just seven weeks left in 2025! I have already started looking for a new gym near my place—my goal is to distribute my wealth among different gyms over the years.
Anyway, let me get back to business—time for our weekly dose of market metrics.

Last week was a short one with just four trading days, and I expected that the markets would bounce back. Note to self—I should not expect, expectation after all is the mother of all problems.
Talking about Nifty, what I thought to be a pause, turned into pain this week—reminding me of that meme from Masaan, yes, this one.

In other news, this week continued to see layoffs across the US tech giants, affecting people in India as well. Zohran Mamdani’s win was all over the media, though that shouldn’t matter to us in any way. I also read that ahead of Warren Buffett’s anticipated exit, Berkshire Hathaway’s cash swelled to a record $381.7 billion. That’s something. To put that in perspective, that cash pile is enough to buy 3 or 4 banks from Nifty50, and you would still be left with some.
On a positive note—India’s Women’s Cricket team clinched their maiden ICC Women’s World Cup title, defeating South Africa in the final, which was historic to say the least.
Anyways, let’s get started with the charts and indexes. As always, Nifty first.
NIFTY 50 - Technical Analysis
Weekly Timeframe
After breaking below the key support zone of 25,700–25,670, NIFTY has now shifted its short-term structure. On Friday, the index tested the 25,330 level, which is also an important support area, and we did see some buying emerge from there.
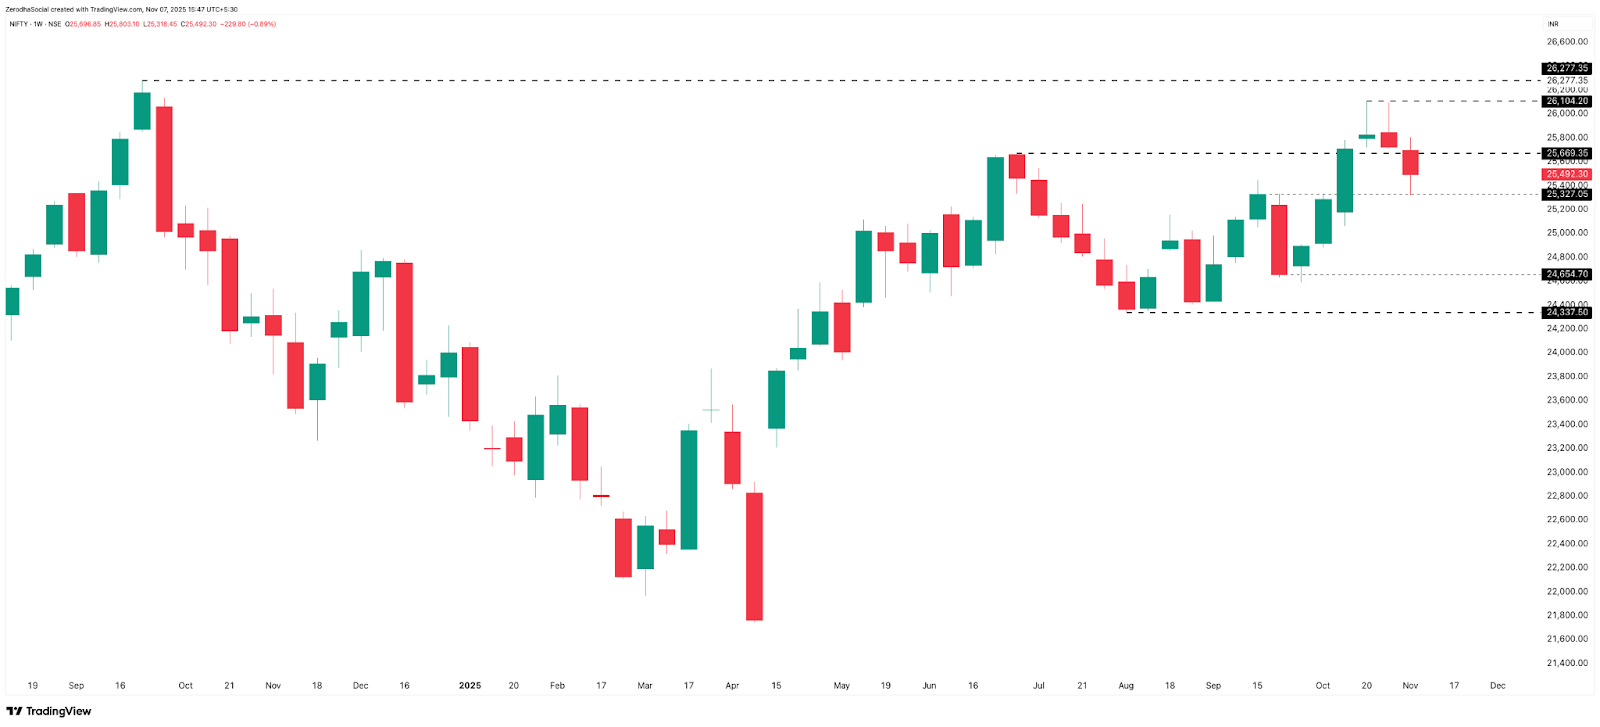
For the week, NIFTY ended 0.89% lower, slipping around 230 points, and closed at 25,492. On the charts, the previous support zone around 25,700–25,670 now turns into resistance. On the downside, immediate support lies at 25,300, and if that level breaks, the next major weekly support is seen near 24,650.
Currently, price action remains slightly negative to sideways, with resistance overhead and support levels being tested. My view—the trend remains weak for now. My bias will turn positive only if NIFTY is able to close above this week’s high near 25,800 on a weekly closing basis. Let’s see how the index behaves in the coming sessions.
Daily Timeframe
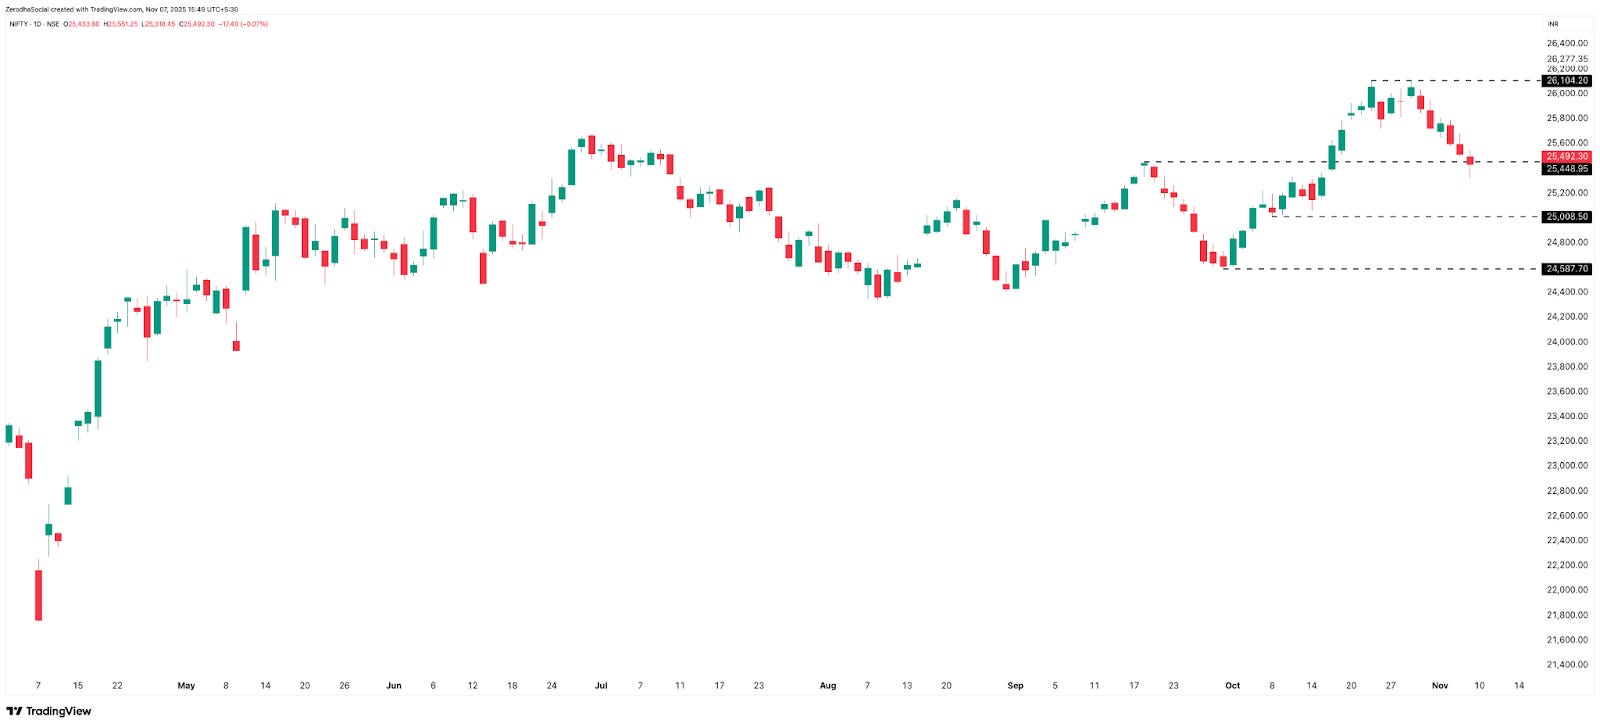
NIFTY is again hovering around the crucial support level of 25,450. Out of the four trading sessions this week, NIFTY has closed three days in the red, with only Monday closing positive.
Going forward, the immediate support to watch is 25,450 and then around 25,000, while the resistance is at 25,700 and then at 26,100. So for now, the index remains range-bound between these levels.
If we look at the higher high, higher low structure on the chart, it is still intact. Now the key point to watch is whether the current move forms a new higher low or not. This week, NIFTY made a high of 25,803 on Monday, then slipped about 485 points to a low of 25,318, and eventually closed near 25,500.
Hourly Timeframe
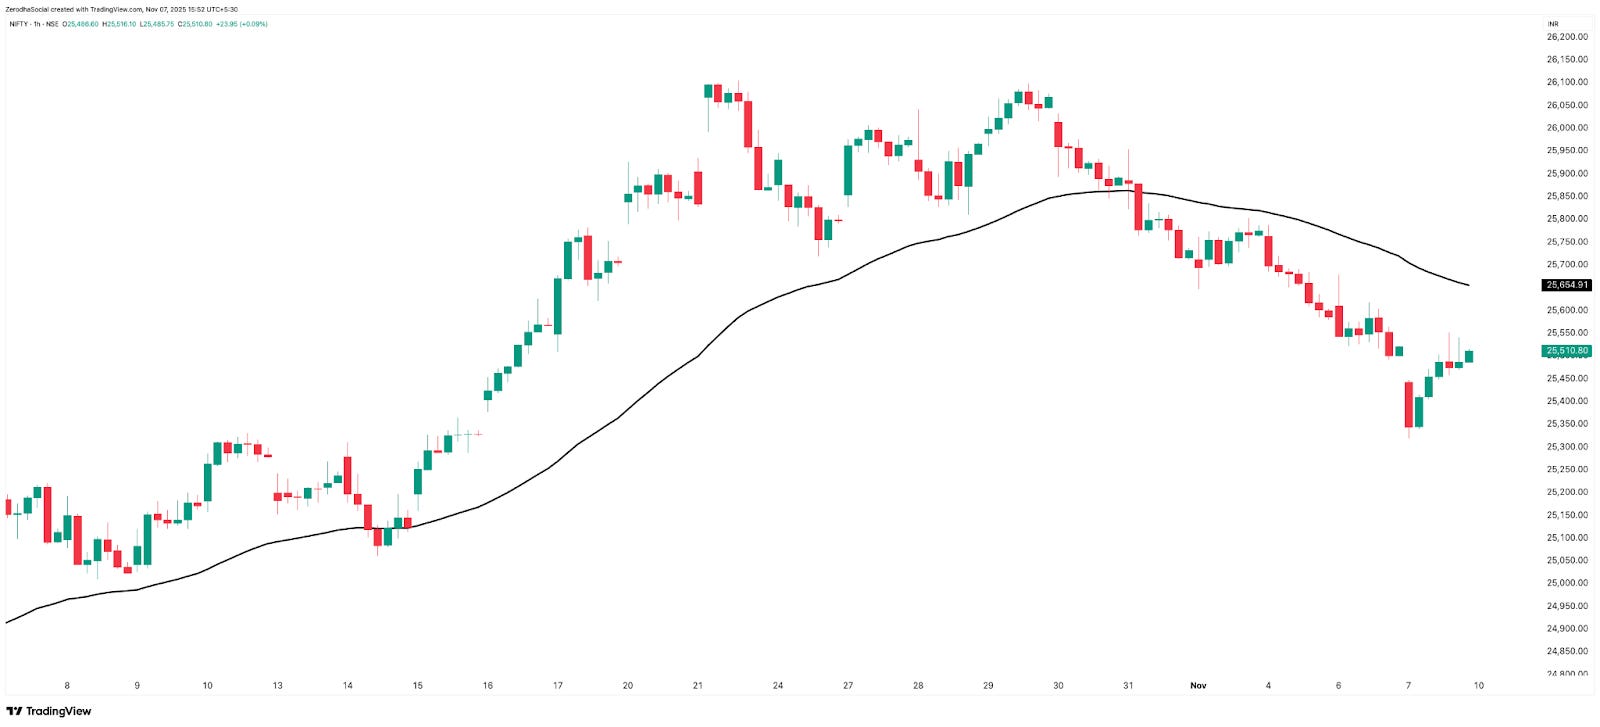
NIFTY broke below the 50-EMA last Friday and has remained below it throughout this week. However, on Friday, we did see a decent recovery from the lows of 25,318, with the index closing around 25,492.
So to conclude, the bias on the 1-hour chart remains negative for now. Let’s see whether the short positions follow through, or if the market once again traps shorts—as it often does.
Overnight vs. Intraday Moves
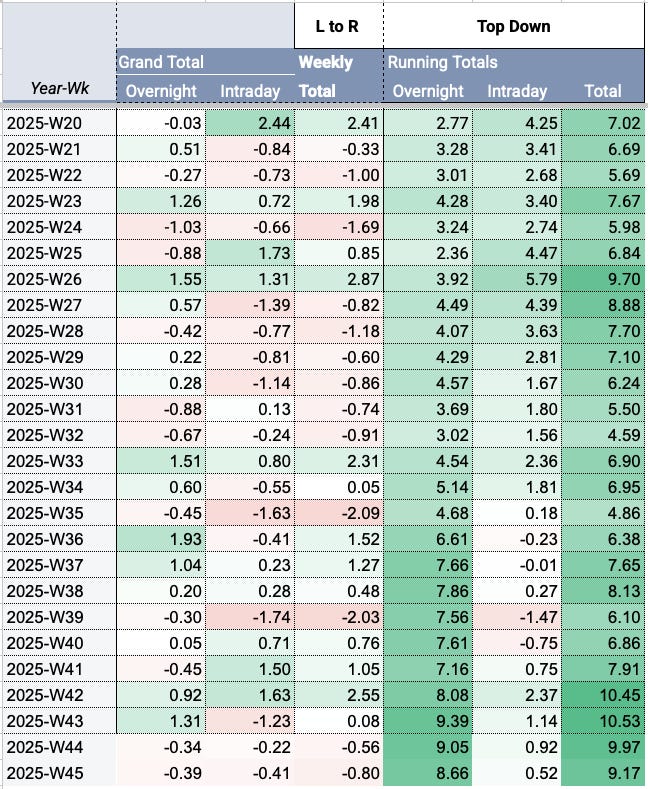
Similar to Week 44, both segments were negative this week as well. NIFTY opened with a positive gap only on Monday. For the remaining three sessions, it opened lower with negative gaps. On an intraday basis, NIFTY slipped around -0.41% this week.
Looking at 2025 year-to-date, NIFTY has gained roughly +8.66% from overnight moves, but only +0.52% from intraday moves.
BANK NIFTY - Technical Analysis
Weekly Timeframe
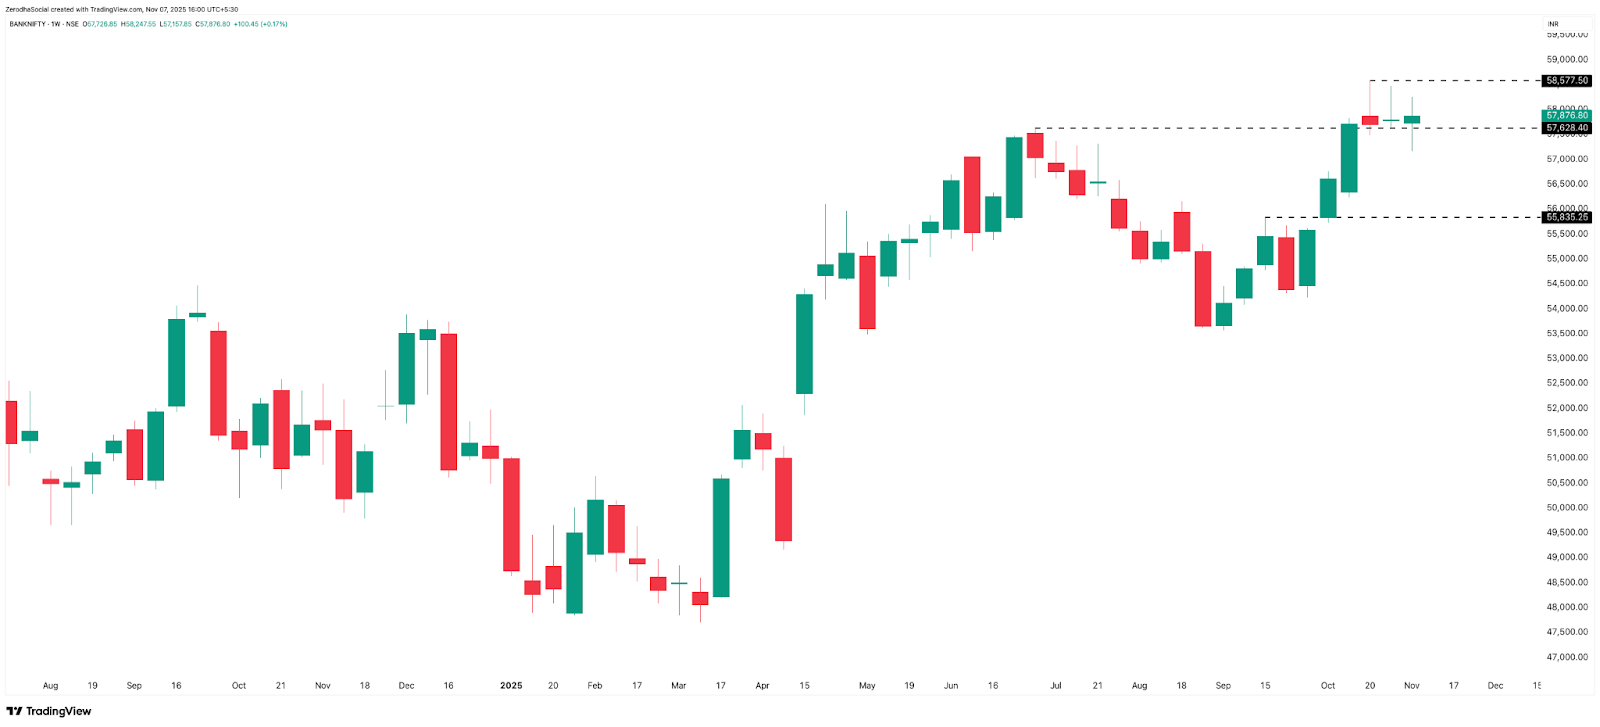
BANKNIFTY is still trying to hold above the breakout zone of 57,600–57,650. However, the index hasn’t made any meaningful move in the last three weeks, gaining only about 163 points, or roughly 0.28% over that period.
For this week specifically, BANKNIFTY added around 100 points, or +0.17%, and closed at 57,877. During the week, it made a low of 57,157, but on Friday, we saw a decent recovery—the index moved about 844 points higher from the low, roughly a 1.5% bounce.
Support and resistance zones remain unchanged from last week: support at 57,600 and resistance at 58,600.
Daily Timeframe
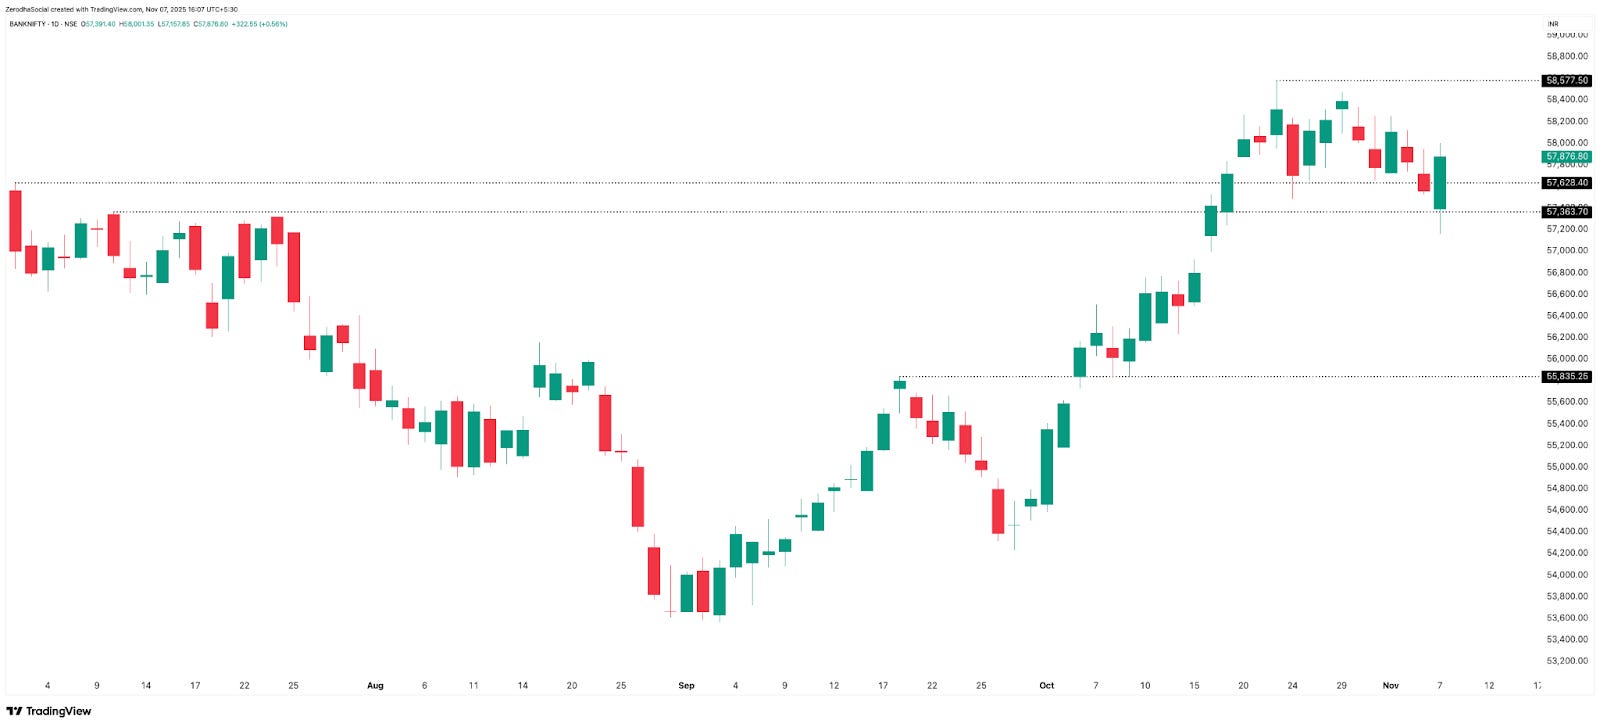
The key levels are still the same as the weekly chart—resistance near 58,600 and support in the 57,600–57,400 zone. This week, BANKNIFTY formed two green candles and two red candles. The green candles came on the first and the last trading day, with the two red candles in between. Friday saw good buying strength, with the index moving +0.56% higher.
The higher high, higher low structure is also intact on BANKNIFTY, just like we observed in NIFTY. Overall, BANKNIFTY continues to look stronger than NIFTY across multiple timeframes. It’s possible that non-financial stocks within NIFTY are dragging the index down, while banking stocks are holding relatively firm.
Hourly Timeframe
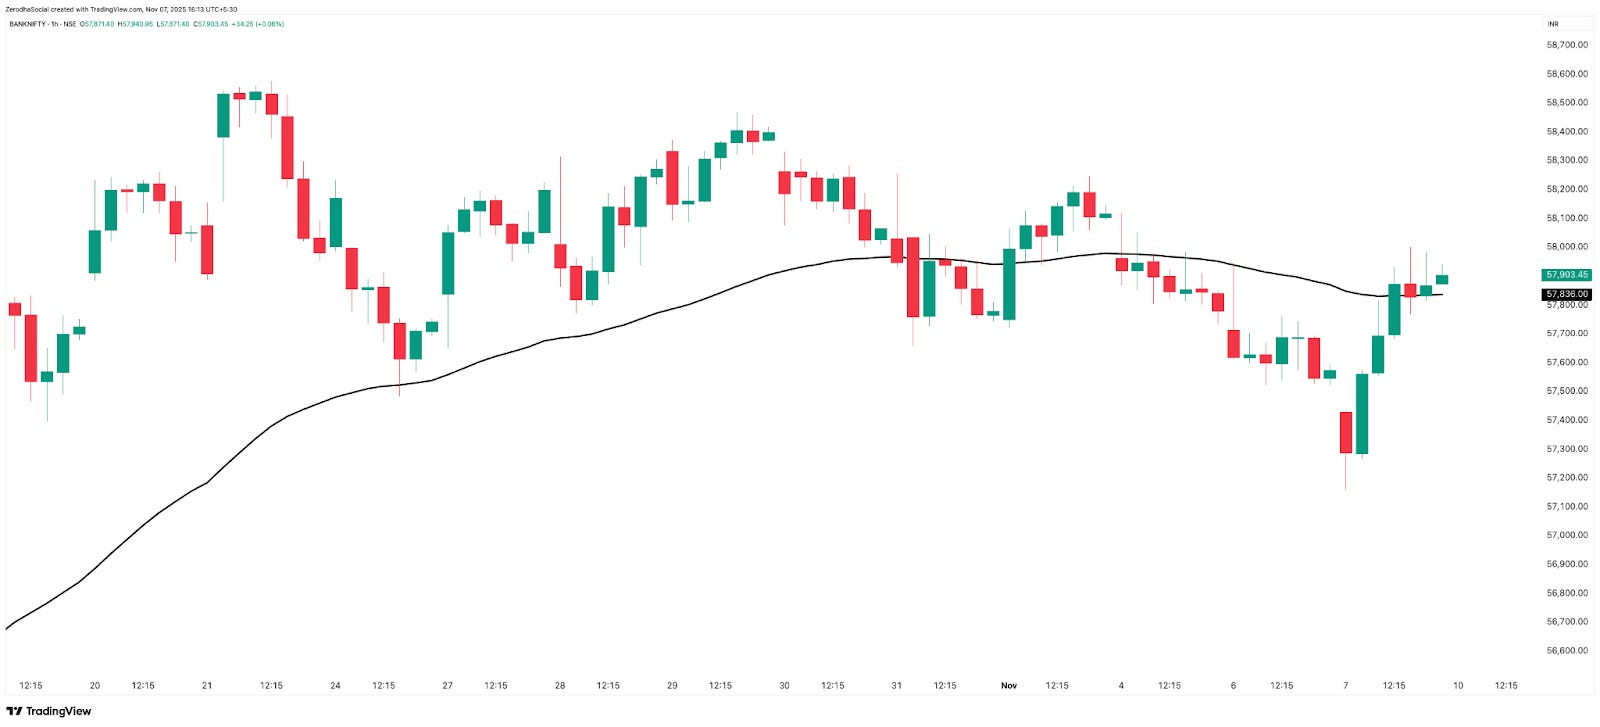
BANKNIFTY is currently chopping around the 50-EMA, with no clear directional move. So while the weekly and daily bias remains bullish, the 1-hour timeframe is still indecisive at the moment.
NIFTY MIDCAP SELECT - Technical Analysis
Weekly Timeframe
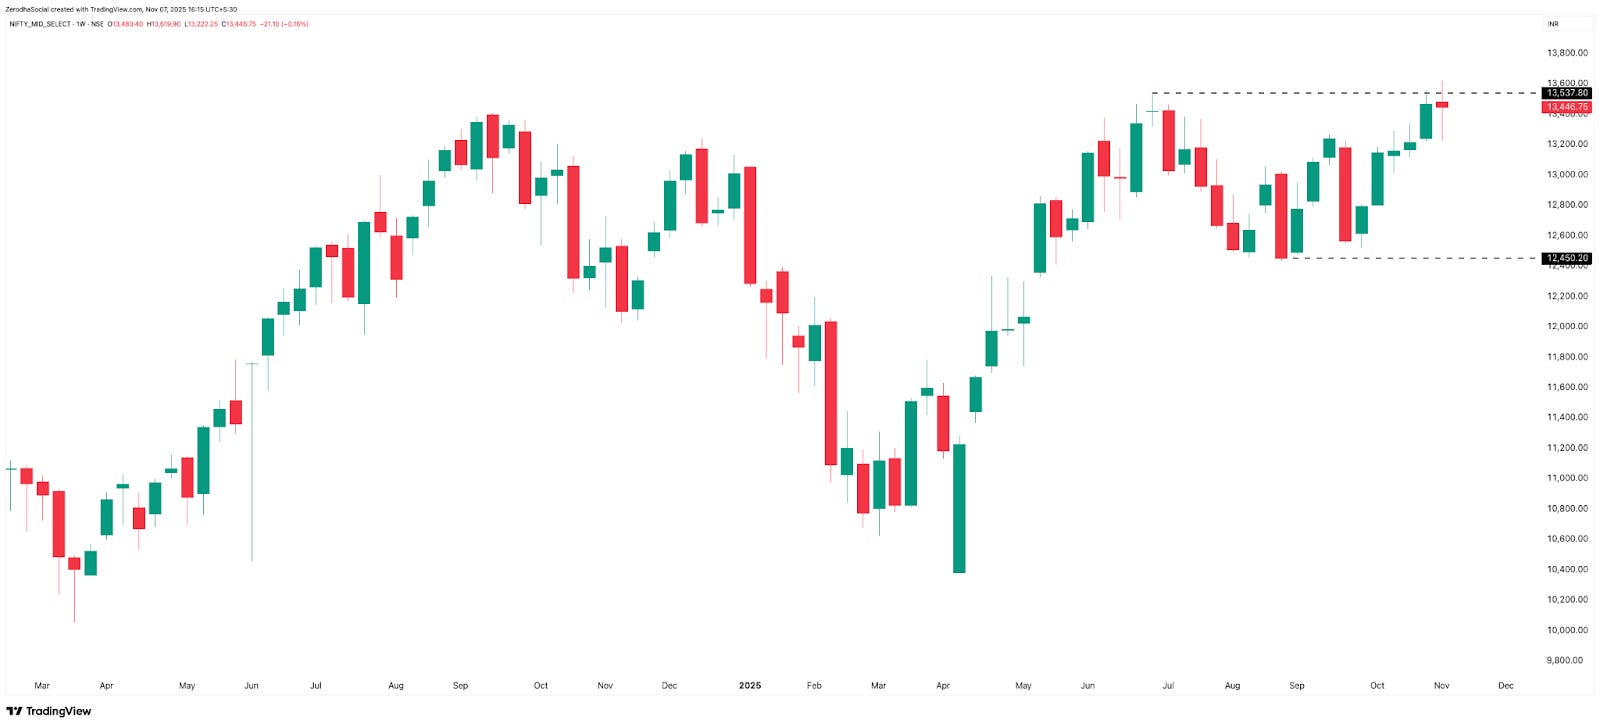
The story remains similar to last week, with the index still unable to clear the resistance around 13,550. For the week, it slipped about 21 points, or 0.16%, and closed at 13,447, making it another flat week after the strong +2% move previously.
Unless the index decisively closes above the 13,550–13,620 zone on a weekly timeframe, the bias stays sideways to mildly bullish.
Daily Timeframe
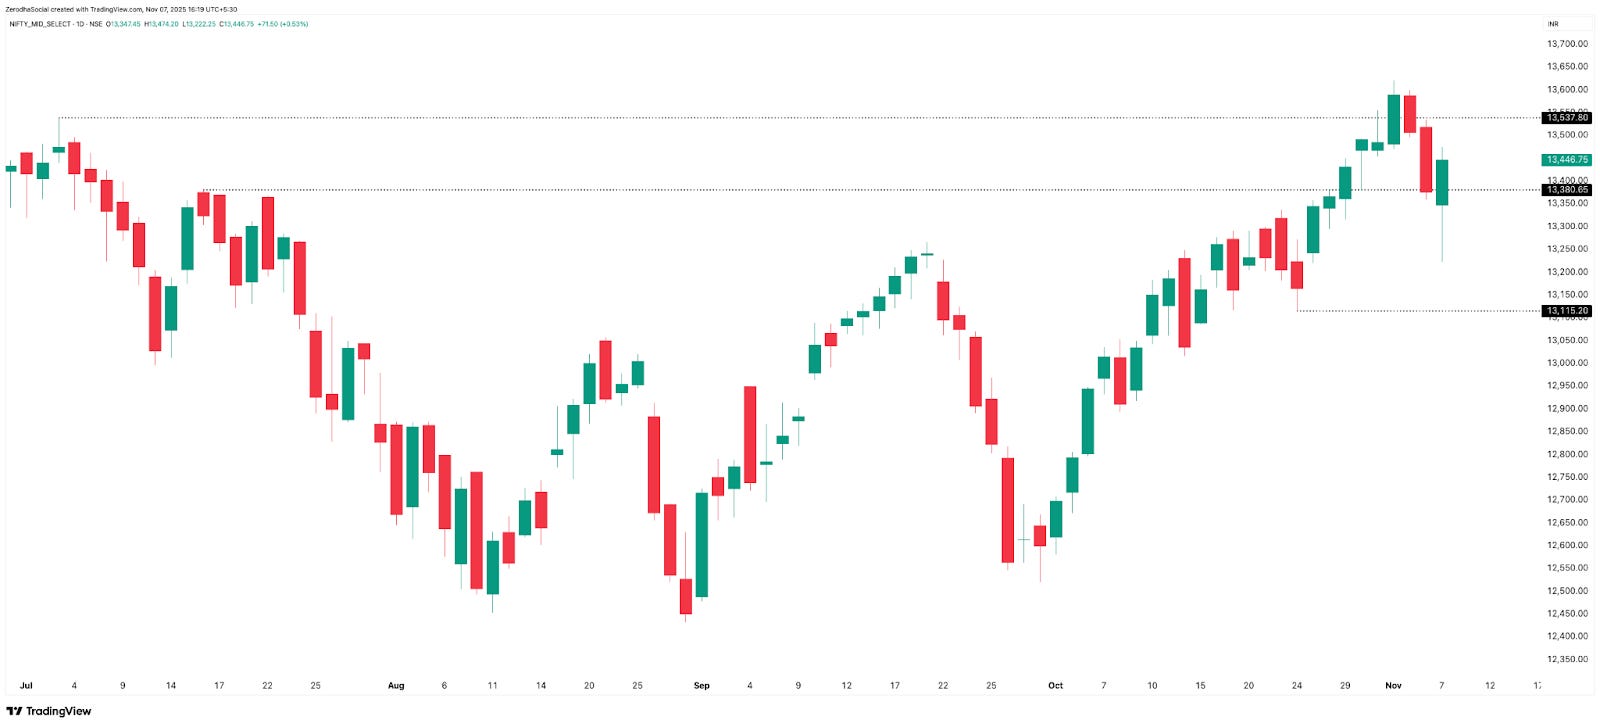
Just like BANKNIFTY, the two red candles of Tuesday and Thursday were sandwiched between the green candles of Monday and Friday, with Friday showing some signs of recovery. Whether Friday’s upmove carries forward or fades out—we’ll know in the coming week.
Resistance remains at 13,550–13,620, while support is near 13,100.
SENSEX - Technical Analysis
Weekly Timeframe
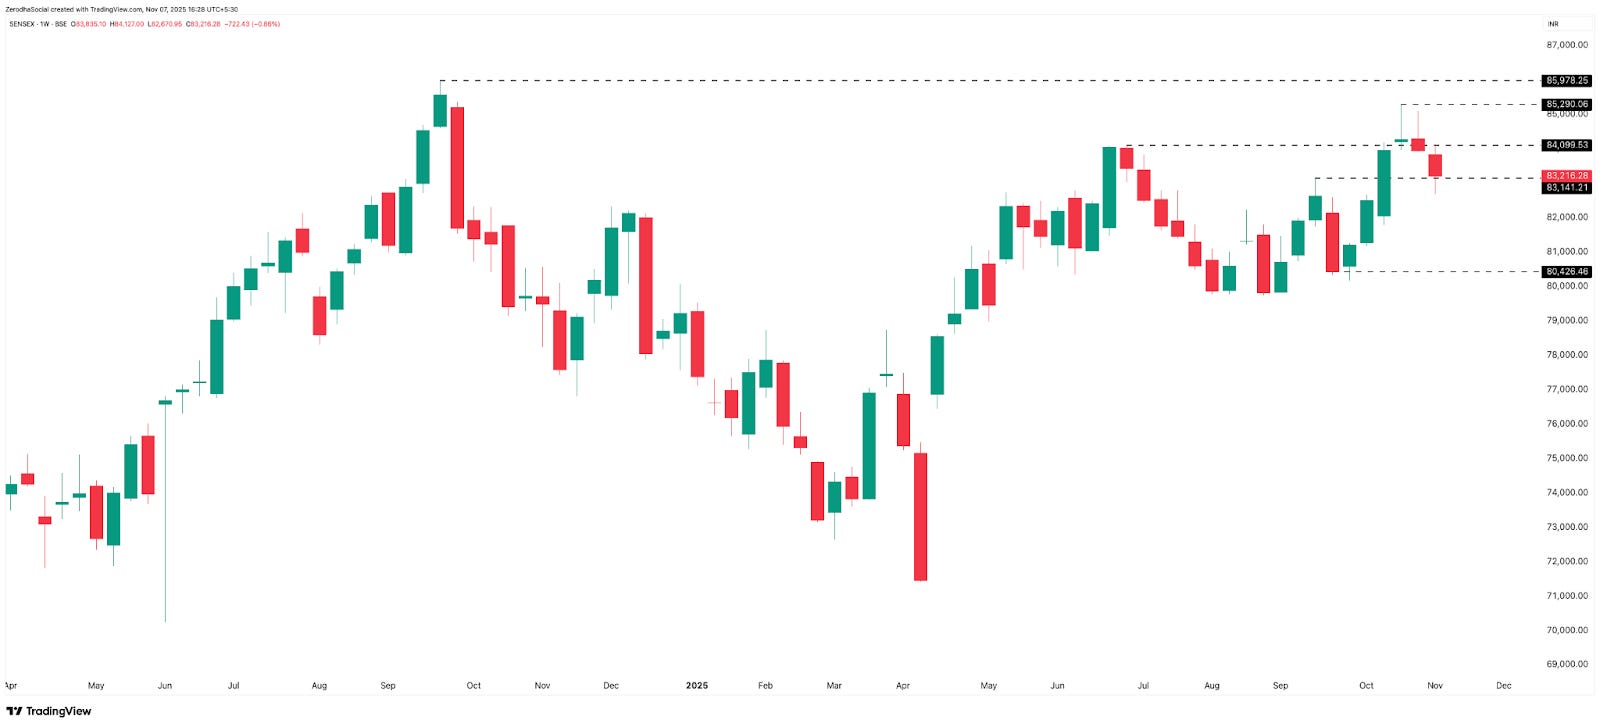
With two back-to-back red weekly candles, the index lost 722 points, or about 0.86%, to close at 83,216 compared to last week’s close. It tested and briefly breached the support around 83,150, but managed to close back above it.
For now, resistance remains at 84,100 and 85,300, while support is seen at 83,150 and 80,400.
Daily Timeframe
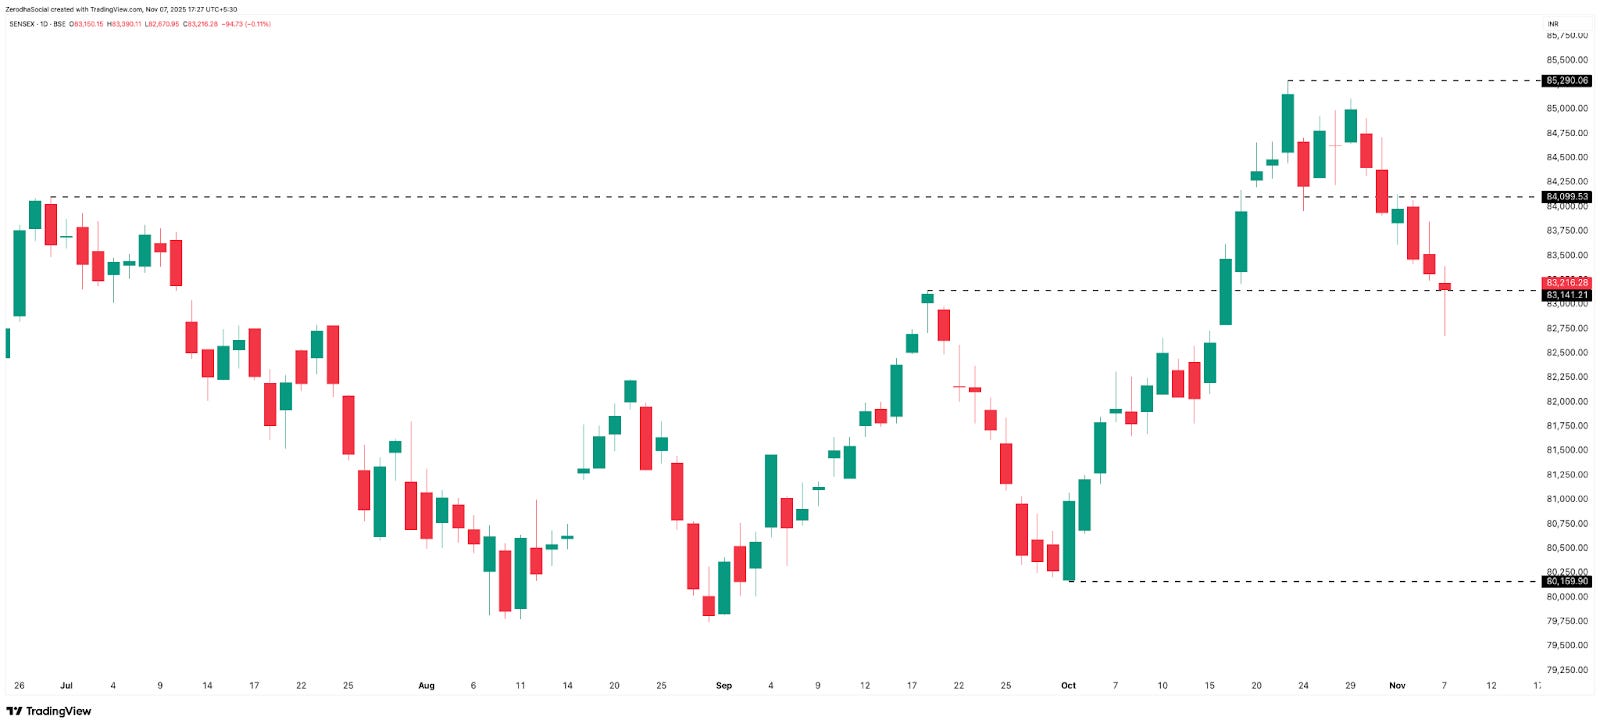
A similar story can be seen on the Sensex daily chart as well. With three red candles, the support and resistance zones remain largely the same as on the weekly chart.
The only silver lining was Friday’s candle, which showed some buying interest and managed to close above the important support level of 83,150. The bias here remains mildly bearish to sideways for now.
Market Metrics Summary
Rate of Change (Weekly Performance)
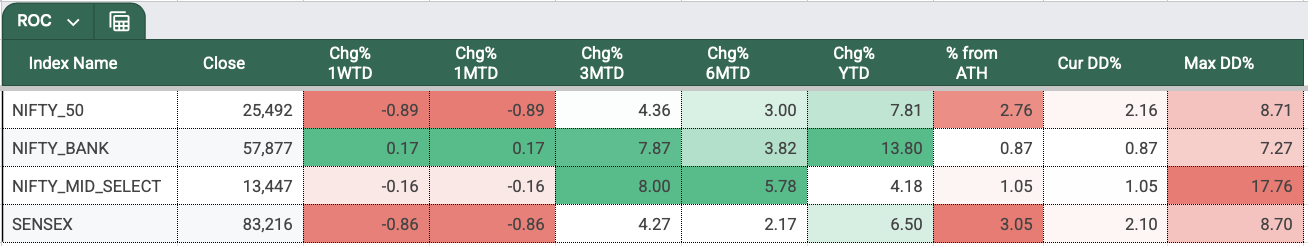
In the first week of November, we saw red across most indices, except for BANKNIFTY, which managed to close +0.17% higher, while NIFTY and SENSEX both slipped close to -1%.
Year-to-date (YTD), BANKNIFTY remains the strongest performer with +13.8% gains, followed by NIFTY at +7.81%, and SENSEX at +6.5%.
In terms of proximity to their all-time highs (ATH)—BANKNIFTY is the closest, just 0.87% away, followed by MIDCPNIFTY, which is about 1% away, while NIFTY and SENSEX are roughly 3% below their respective ATH.
Directional Bias
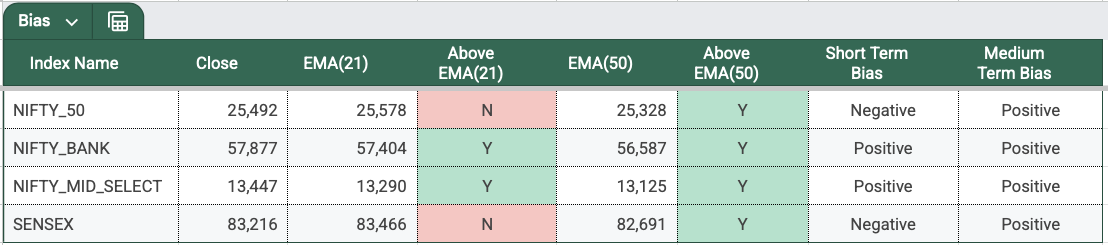
This week, NIFTY and SENSEX have seen their short-term bias turn negative, as both indices dropped below the 21 EMA on the daily timeframe. However, the medium-term bias—based on price relative to the 50 EMA—still remains positive.
On the other hand, BANKNIFTY and MIDCPNIFTY continue to hold a positive bias on both short-term and medium-term timeframes.
Are these early signs of weakness ahead, or just a bout of short-term turbulence? I’m hoping it’s the latter—let’s see how things unfold.
Sectoral Performance
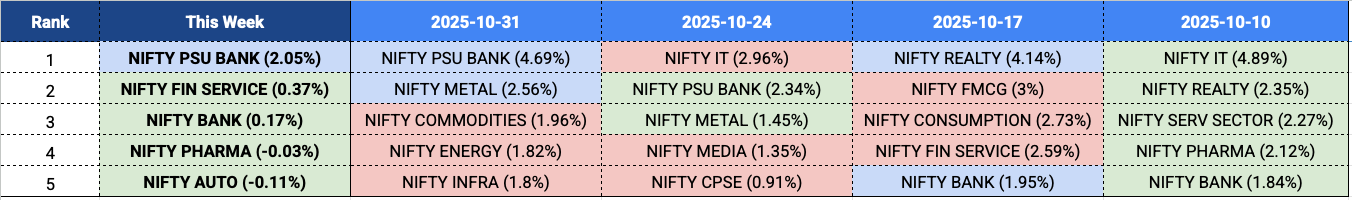
PSU Banks have remained in the top five sectors for three consecutive weeks, securing the top spot both this week and the previous one. PSU bank stocks rallied, following reports that the government is preparing a new plan to merge certain public sector banks and privatise smaller lenders.
Financial Services, Banking, Pharma, and Auto were the four new entrants among the top-performing sectors this week—which also explains BANKNIFTY’s relative strength compared to the other indices.
Volatility & Derivatives
Range, Straddle & Expiries
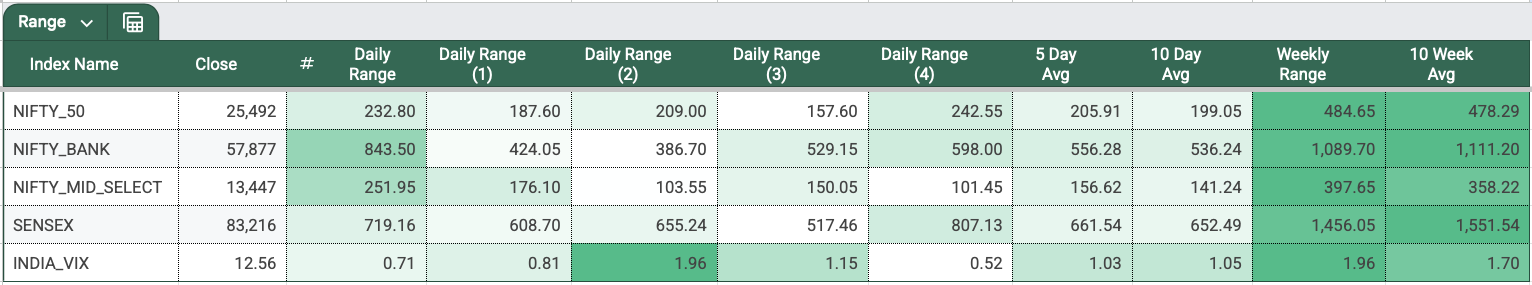
NIFTY’s 5-day average range continues to hover around 200 points, which is similar to last week and also matches the 10-day average range. Interestingly, all major indices had their highest range day on Friday—just like last week.
Now the question is—is there really something about Fridays that makes them the highest range days? Or is it just my recency bias kicking in? Do let me know what you think in the comments below.
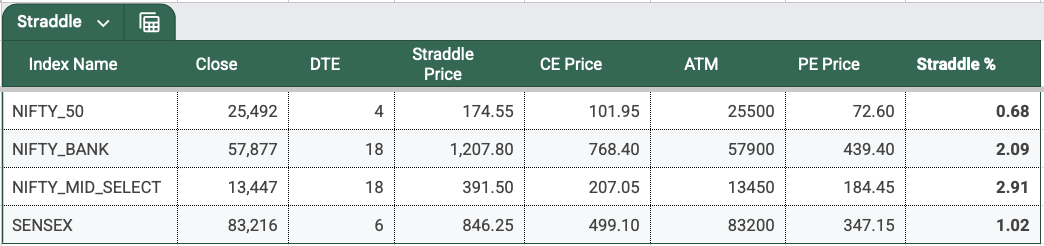
The NIFTY 2DTE straddle premium is around 175, which is just 0.68% of the spot. That’s quite low, considering the index has been showing a daily average range of about 200 points.
Now, talking about the NIFTY expiry—last week, NIFTY expiry was tricky while SENSEX expiry was relatively smooth—and this week, it was the other way around.
NIFTY weekly expiry on Tuesday saw a downtrending day with a 209-point range, and there were no major pullbacks or spikes. It turned out to be a fairly easy session for directional sellers and even option buyers.
On the other hand, the SENSEX expiry was far more volatile, with a 609-point range. The straddle lost most of its premium within the first couple of hours, followed by the usual post-2 PM swings.
Selling straddles or strangles after 2 PM used to be quite rewarding in the past—but it’s getting increasingly tougher now. Maybe it’s time to experiment with a long gamma trade post-2 PM instead? Just a thought.
India VIX
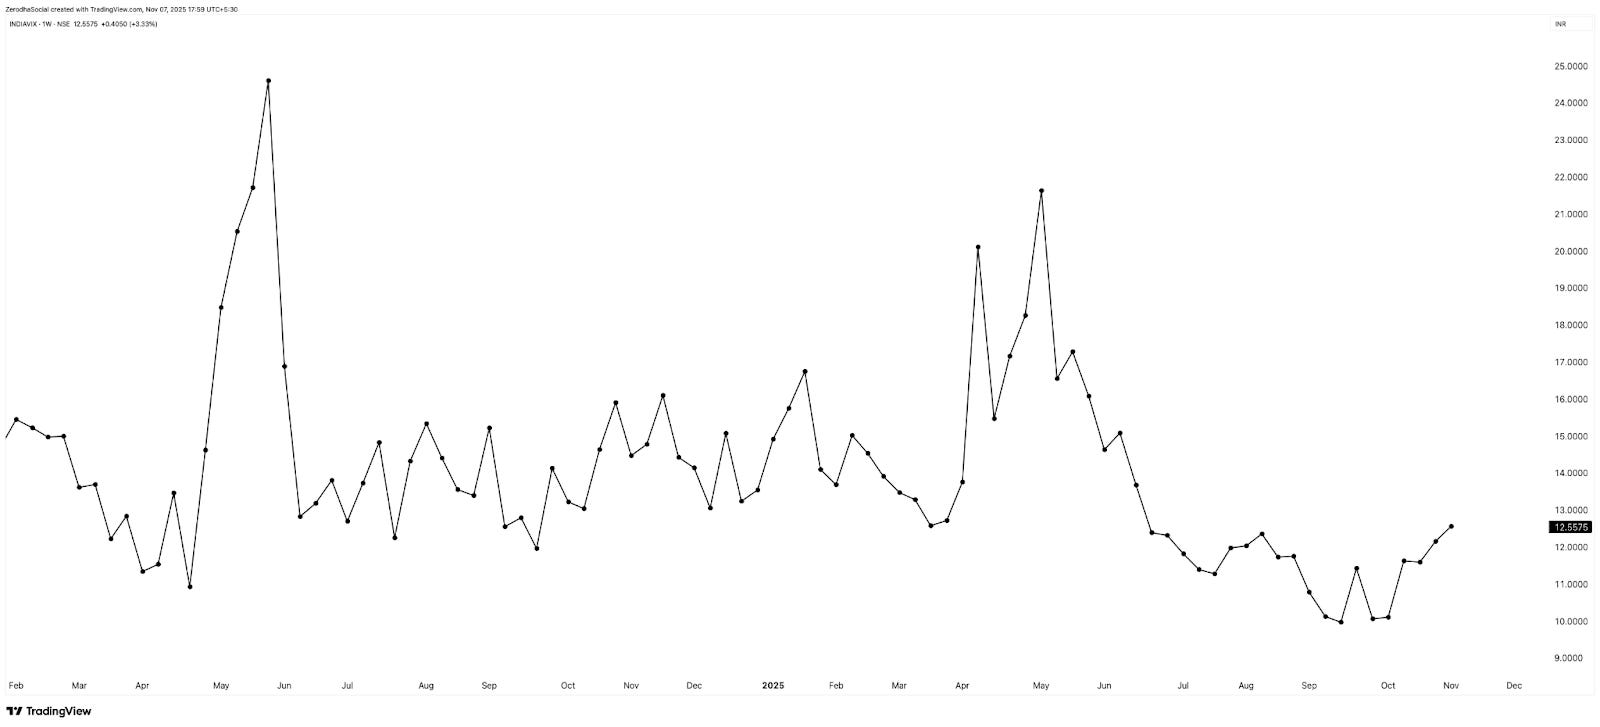
INDIAVIX continued to inch higher, rising 3.33% this week to close at 12.56. It has been steadily moving up since the start of October, climbing from 10.06 to 12.56—that’s nearly a 25% increase.
Whether this is just mean reversion or a sign that something else is brewing, I don’t have a clear answer yet.
Commodities Update
(Data: MCX Continuous Futures - Back Adjusted)
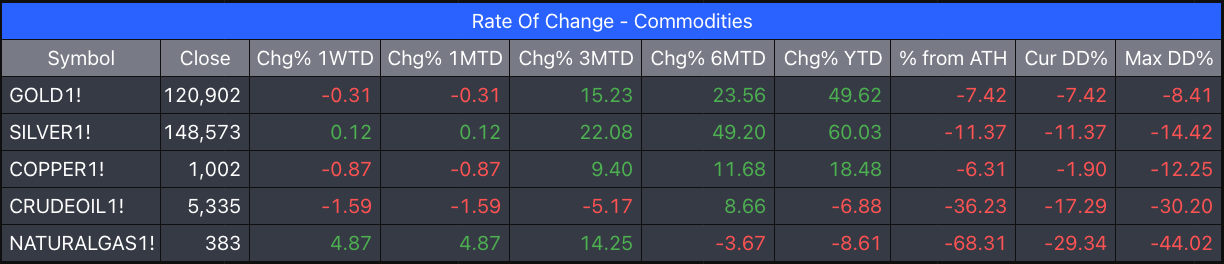
After a quiet week across most commodities, Natural Gas stood out with a strong 5% gain, reclaiming some of the ground lost in recent months. Could this be the seasonality effect starting to play out?
Gold and Silver were largely range-bound, slipping 0.31% and gaining 0.12% respectively, after their sharp rallies in recent quarters. Both remain solid performers on a year-to-date basis, with Gold up nearly 50% and Silver up nearly 60%, continuing to outperform most asset classes.
Copper eased 0.87%, showing mild consolidation after its recent climb, while Crude Oil stayed under pressure, losing 1.59% for the week and remaining well below its highs.
Overall, precious metals continue to hold strength, base metals are steady, and energy remains mixed, with Natural Gas leading the commodity space this week.
Summary & Looking Ahead
The market took a breather this week again. NIFTY broke below the 25,700–25,670 support zone, tested 25,330, and closed 1% lower at 25,492. The structure looks slightly negative to sideways, unless it reclaims 25,800 on a weekly close.
BANKNIFTY held its ground better, ending 0.17% higher at 57,877, still above its breakout zone. Sensex slipped 0.86% to 83,216, but managed to close above key support at 83,150.
Sector-wise, PSU Banks stayed on top for the third straight week, joined by Financials, Pharma, and Auto, which explains BANKNIFTY’s relative strength.
India VIX climbed to 12.56, up 3.3% for the week and nearly 25% higher since October—volatility is quietly creeping back.
In commodities, Gold and Silver stayed flat, while Natural Gas jumped 5%, likely on seasonal tailwinds.
Overall, a sideways-to-slightly-weak week for equities, but no sign of panic yet.
What to Expect Next Week
We have the Bihar Legislative Assembly Election results coming up on Friday, 14th November. Will that have any impact on the stock market? I have my doubts—but many do believe that state elections can influence sentiment. So, let’s see how that plays out.
Apart from that, on Wednesday, 12th November, we have the Inflation Rate (YoY) for October—but I don’t see it as a major market-moving event.
It’s a full five-trading-day week ahead. The thing to watch next week is—can NIFTY hold 25,300 and bounce back?
Until then—stay curious, stay steady, and have a great weekend!
That’s pretty much it for this week. And yes—don’t forget to subscribe to the channel.
See you soon!