Hello and welcome to Weekly Market Metrics!
We’re in week 47 of the year—just five weeks left in 2025. At this point, no more reminders of New Year’s resolutions or New Year’s plans. I am giving up on everything, people, except for markets.
Anyway, let me get back to business—it’s time for our weekly dose of market metrics.

This week, we saw Indian corporate earnings staging their strongest recovery in over a year, with brokerages turning upbeat on profit growth in the second half, thanks to a broader consumption rebound.
NIFTY and SENSEX were just an inch shy of hitting a new all-time high after 14 months, while BANKNIFTY and MIDCPNIFTY did break into fresh ATHs this week.
Overall, the positive sentiment is still intact—the charts agree—but with the US markets sneezing on Thursday, the big question is whether India will catch any of those ripple effects.
Anyways, let’s get started with the charts and indexes. As always, Nifty first.
NIFTY 50 - Technical Analysis
Weekly Timeframe
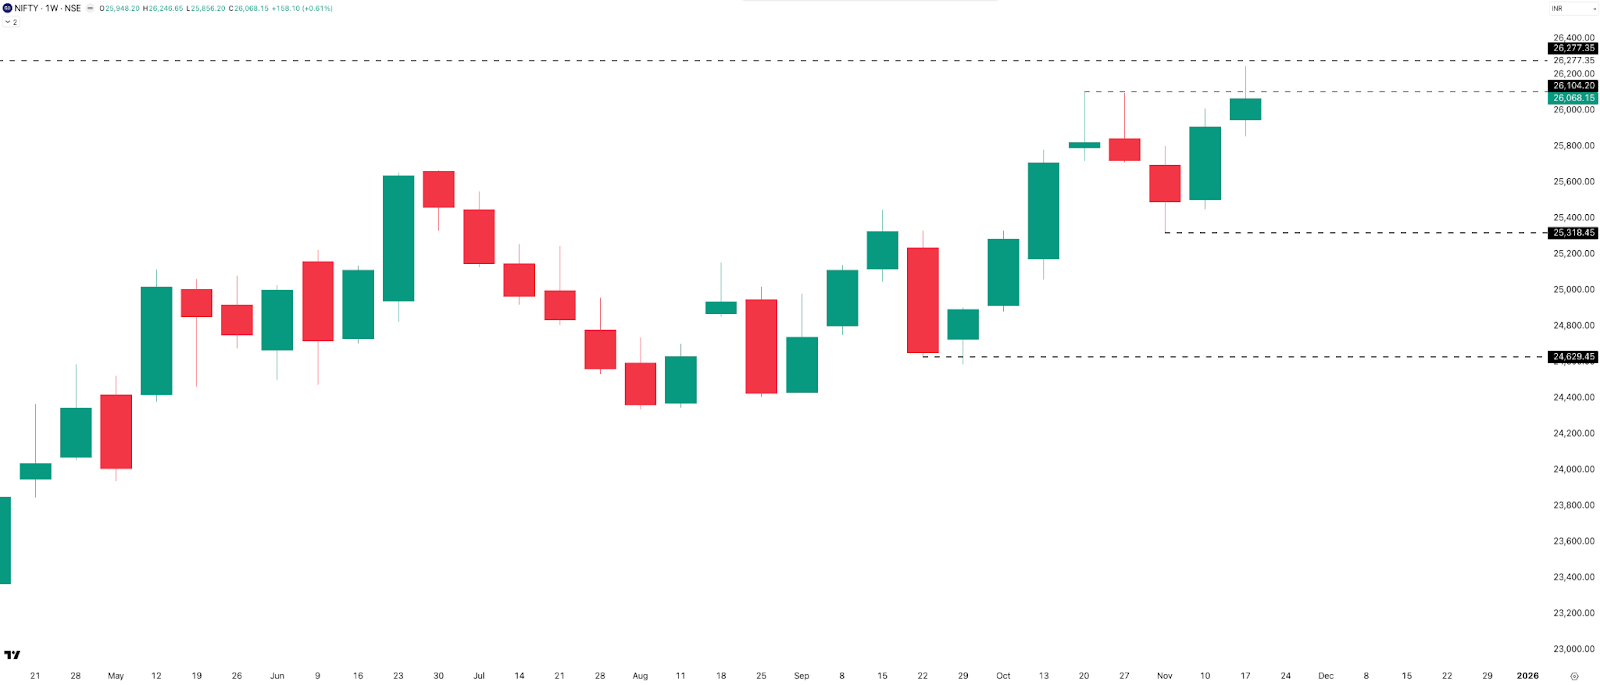
NIFTY gained 158 points or +0.61%, marking two straight green weekly candles, closing at 26,068. Resistance levels remain the same as last week: 26,100, followed by the all-time high at 26,277. Support sits at 25,500.
The index didn’t close above the 26,100 resistance, but it did hit a high of 26,247 during the week—just 31 points shy of the ATH. It managed to close above the 26,000 mark, a big round number and a strong psychological barrier.
Maybe we’ll finally see that new NIFTY ATH in the coming weeks. Fingers crossed.
Daily Timeframe
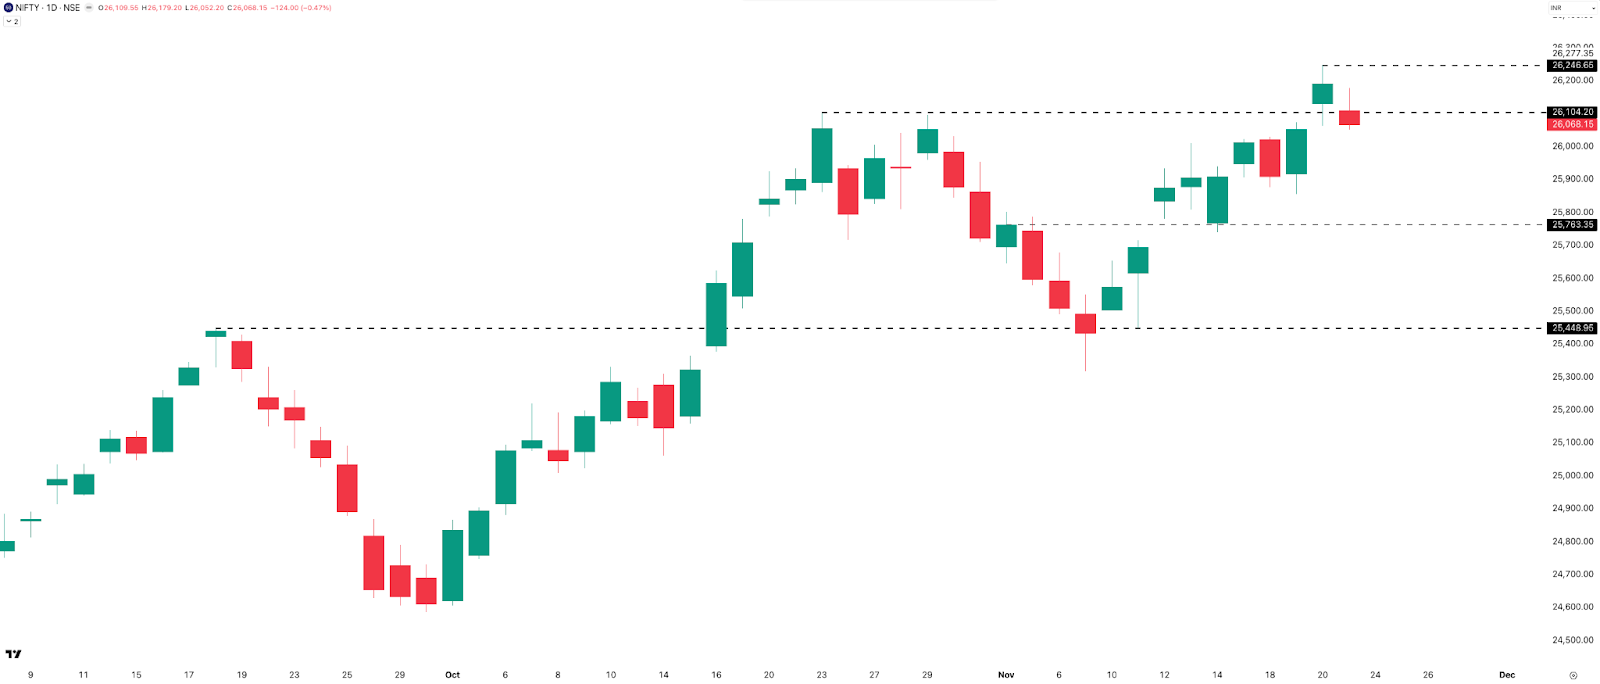
NIFTY printed three green candles and two red candles this week. Thursday’s gap-up and strong early momentum had everyone thinking a new ATH was finally coming… but the post-2:30 PM sell-off—followed by Friday’s dip—pushed that moment a little further out.
Resistance levels are the same as the weekly: 26,100, and the 26,250–26,277 zone from this week’s high to the previous ATH. Support sits at 26,000 and 25,750. On the daily chart, NIFTY remains in an uptrend as long as it holds above 25,750.
Hourly Timeframe
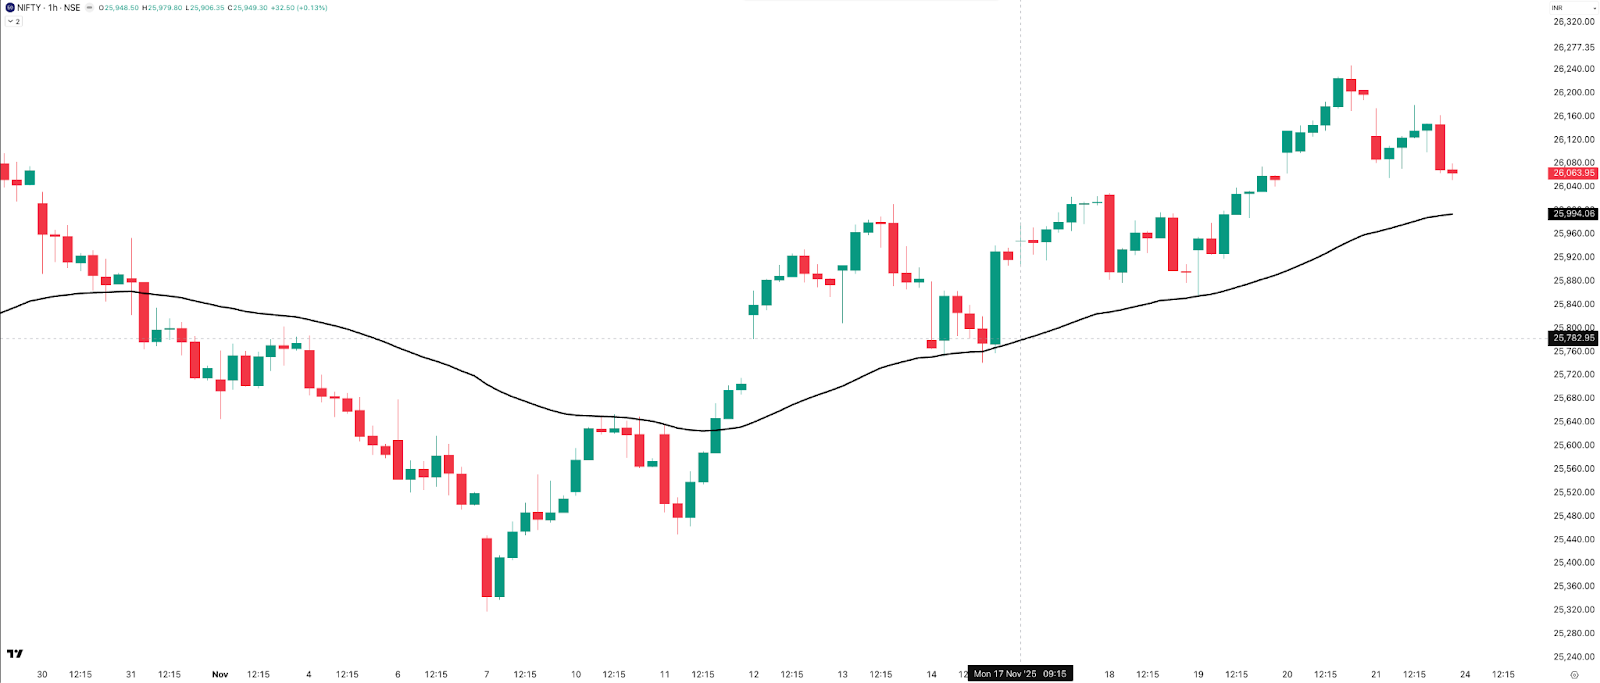
NIFTY stayed above the 50 EMA for the entire week. It briefly tested the EMA on Wednesday during the opening hour but bounced back quickly. On Friday, the last-hour candle brought the price close to the EMA, but it still sits about 74 points, or roughly 0.3%, above it.
In fact, NIFTY has been holding above the 50 EMA since 11th November—that’s 11 straight calendar days of strength. The hourly bias remains positive, and hopefully, the price continues to push higher.
Overnight vs. Intraday Moves
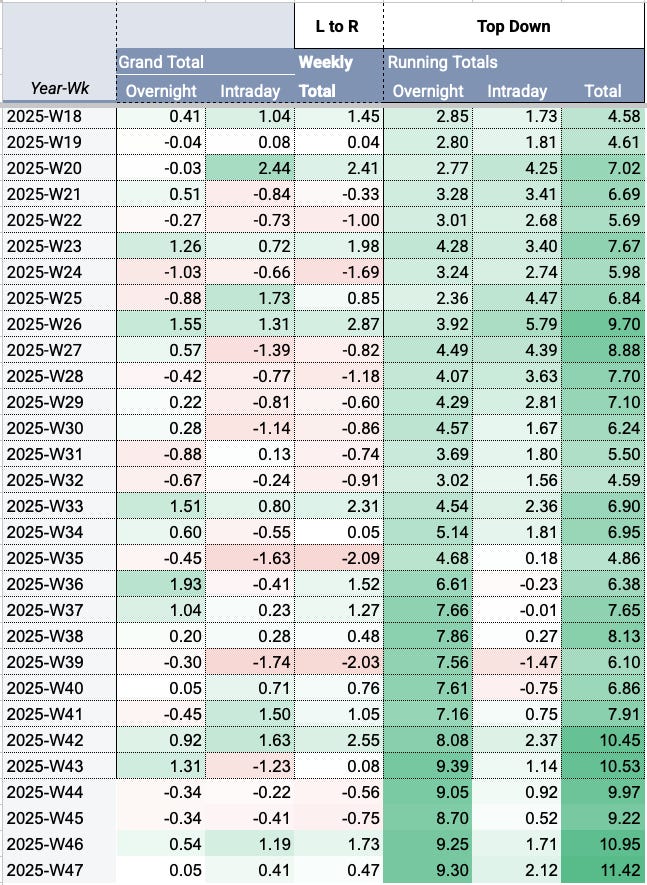
There wasn’t much happening overnight. Even with Monday and Thursday’s gap-up opens, the index ended with almost flat overnight gains at +0.05%. Intraday action was positive, but only mildly, at +0.41%.
So far, after 47 weeks in 2025, NIFTY has gained +9.30% from overnight moves and only +2.12% from intraday moves.
BANK NIFTY - Technical Analysis
Weekly Timeframe
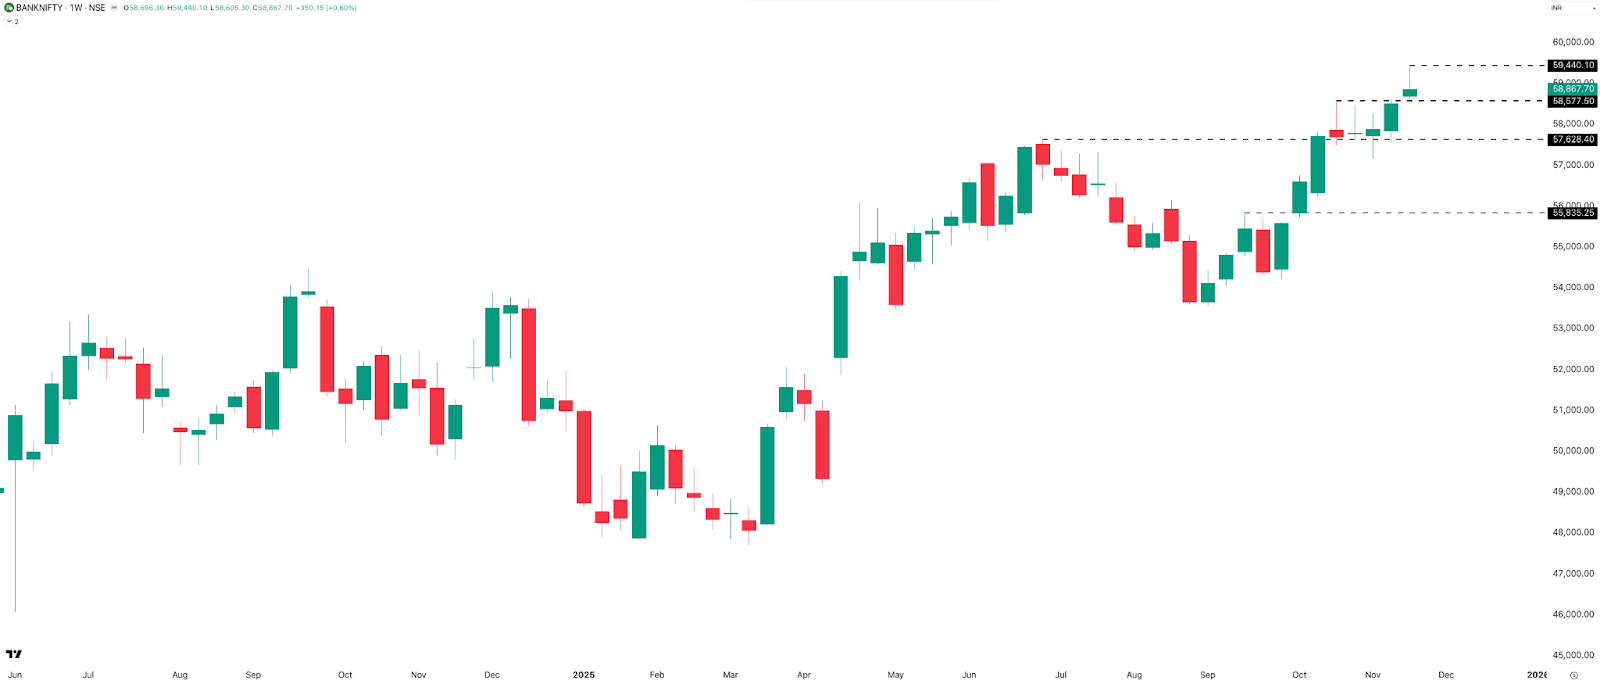
BANKNIFTY added 350 points, or +0.6%. It hit a new all-time high at 59,440 before pulling back to close at 58,867, almost 1% off the top. Support sits at the previous resistance of 58,600, with resistance at the weekly high of 59,440.
At an ATH, a strong marubozu-style candle is usually a bullish sign—but this week’s BANKNIFTY candle looks more like a shooting star, which isn’t ideal. Hopefully, it doesn’t signal a reversal. We’ll know more once we see next week’s follow-up candle.
Daily Timeframe
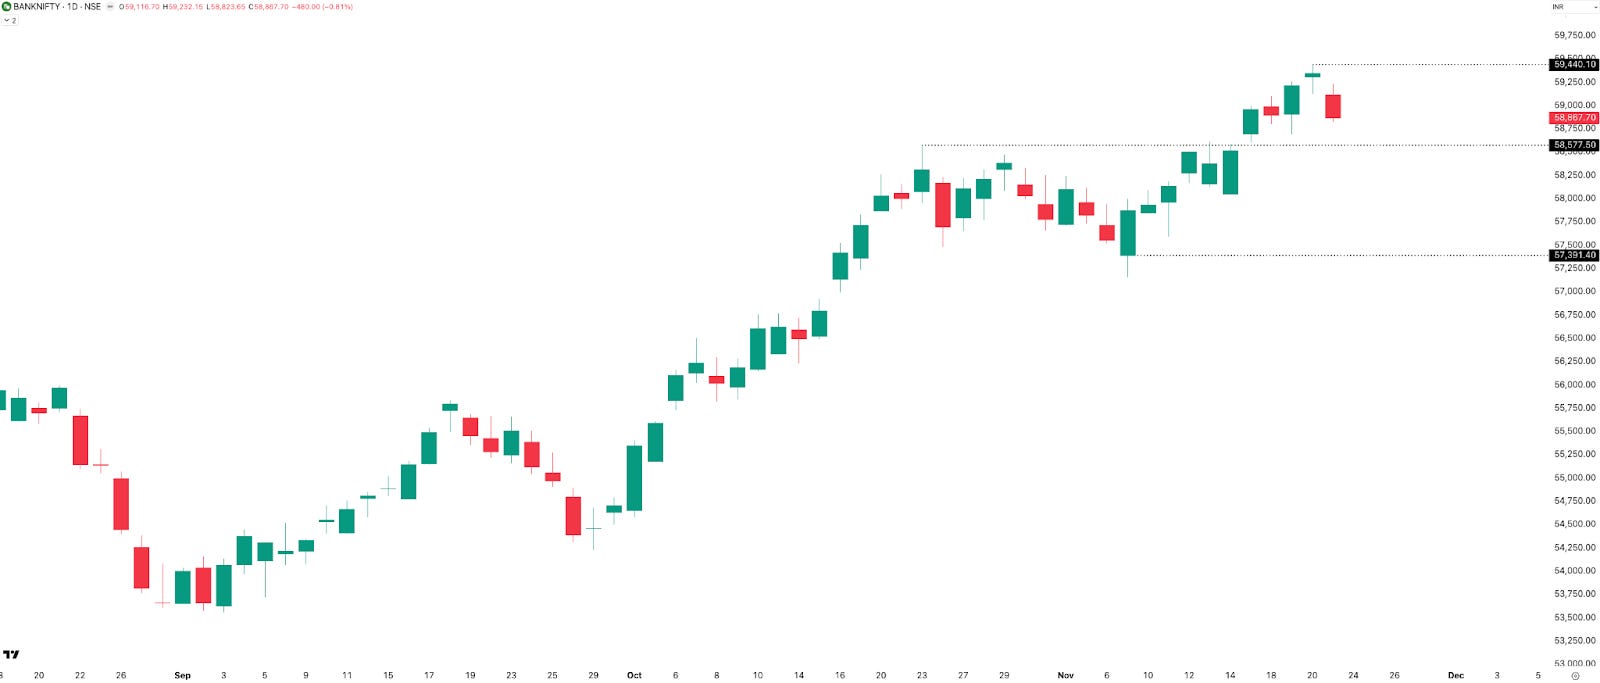
BANKNIFTY printed three green candles and two red candles, similar to NIFTY. Up until Thursday, the momentum was strongly bullish, but Friday’s gap-down and sell-off cooled things off. On Friday, both heavyweights—HDFC Bank and ICICI Bank—dropped over 1%, pulling the index down –0.81% for the day.
Key levels remain the same as the weekly chart: support near 58,600 and resistance at 59,440. Just like last week, BANKNIFTY hit a new ATH on Thursday, only for Friday to drag it back down. But unlike last week, Friday’s last-hour price action wasn’t very encouraging this time.
Let’s see what Monday—and the coming week—has in store.
Hourly Timeframe
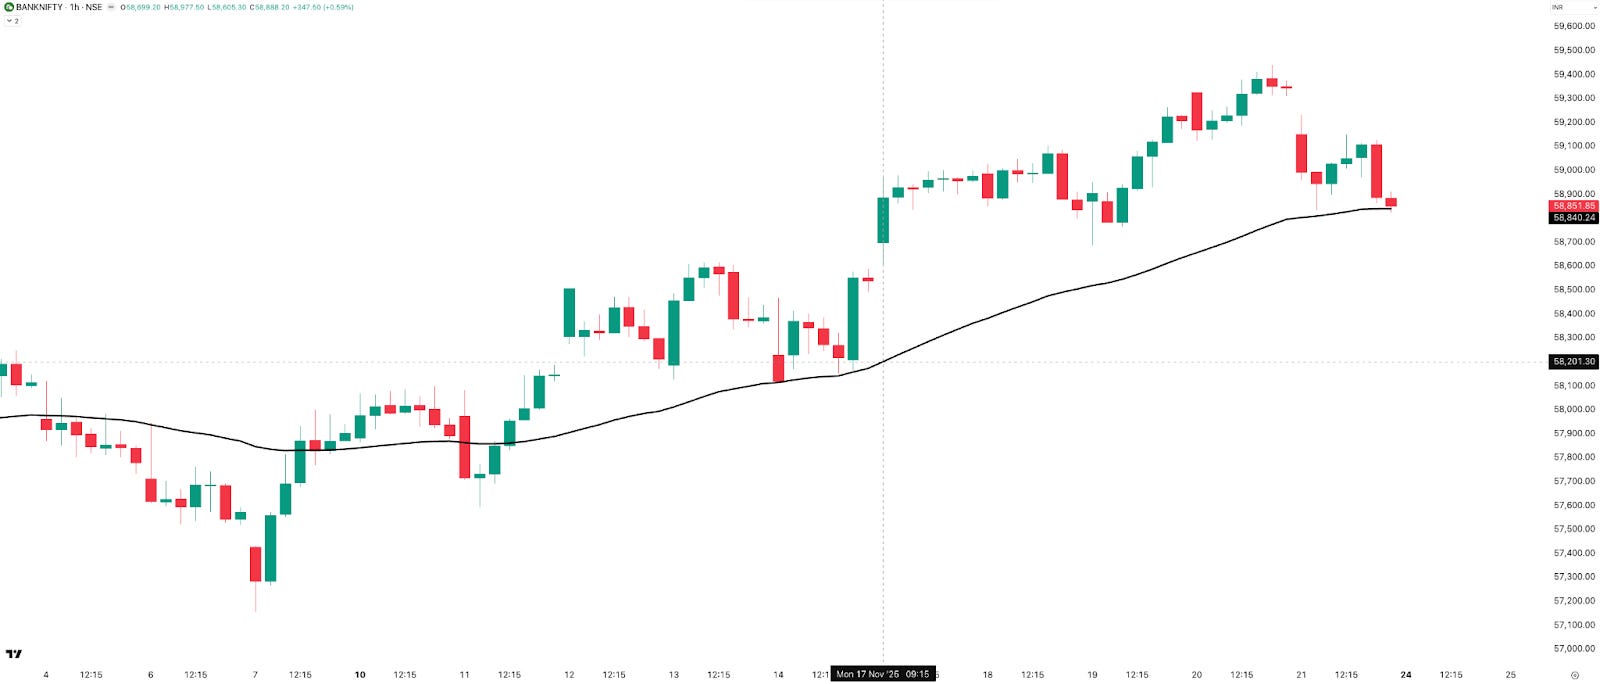
BANKNIFTY stayed comfortably above the 50 EMA all week, and on Friday, it finally tested the EMA. Right now, it’s sitting right on it. Is this just a pullback or the start of a full-blown reversal? My bet is on the pullback, because historically, shorts rarely work when BANKNIFTY is at an ATH—the momentum is usually bullish.
But hey… let me not start making “predictions,” because you all already know how bad I am at that.
NIFTY MIDCAP SELECT - Technical Analysis
Weekly Timeframe
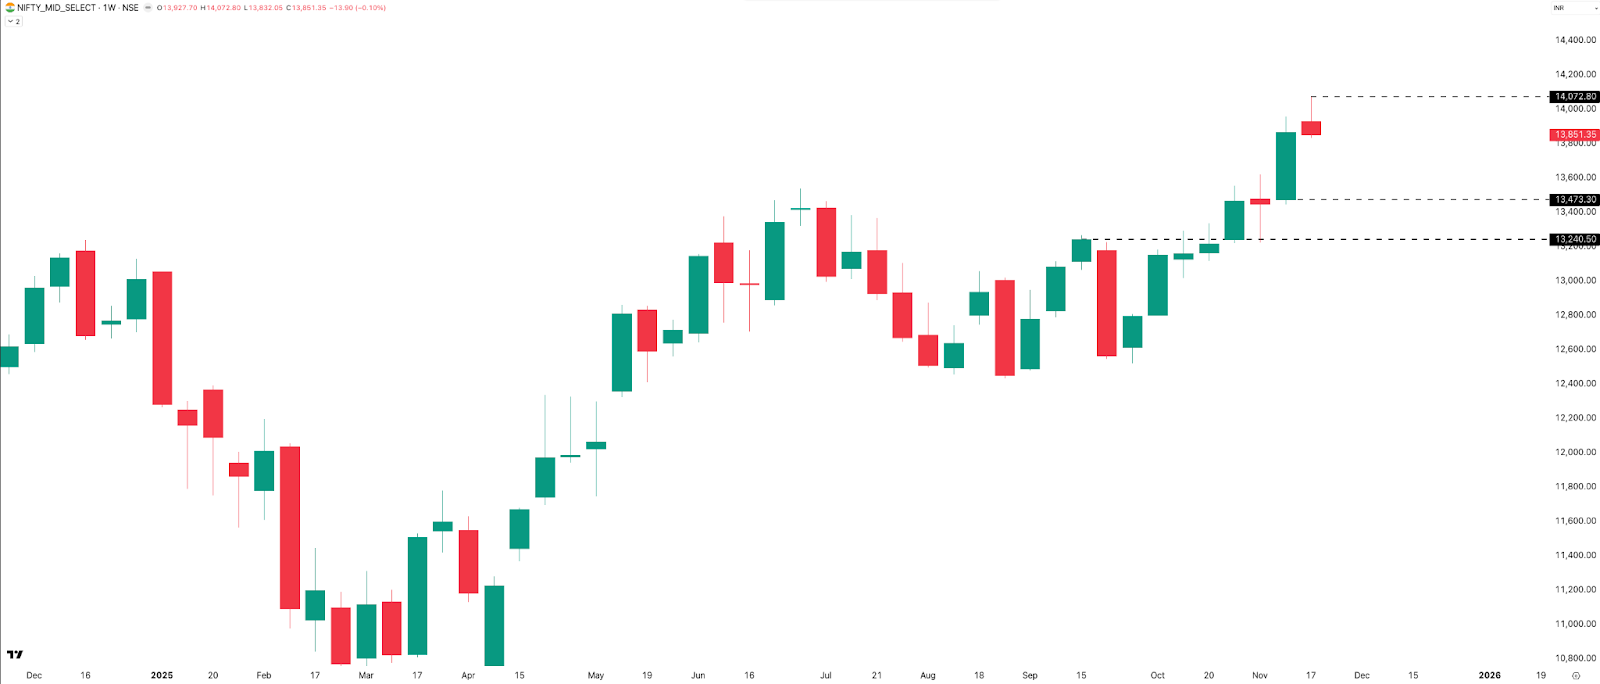
MIDCPNIFTY hit a new all-time high this week—just like BANKNIFTY—marking two weeks in a row of ATHs. But it couldn’t sustain the momentum, closing the week with –14 points, or –0.10%, at 13,851.
And similar to BANKNIFTY, it formed a shooting star on the weekly timeframe, setting up an interesting bull-versus-bear battle for next week. Support sits at 13,450 and 13,250, with resistance at the new ATH of 14,073.
The outlook is still bullish, but that weekly candle does make me a little concerned. Let’s see how next week unfolds.
Daily Timeframe
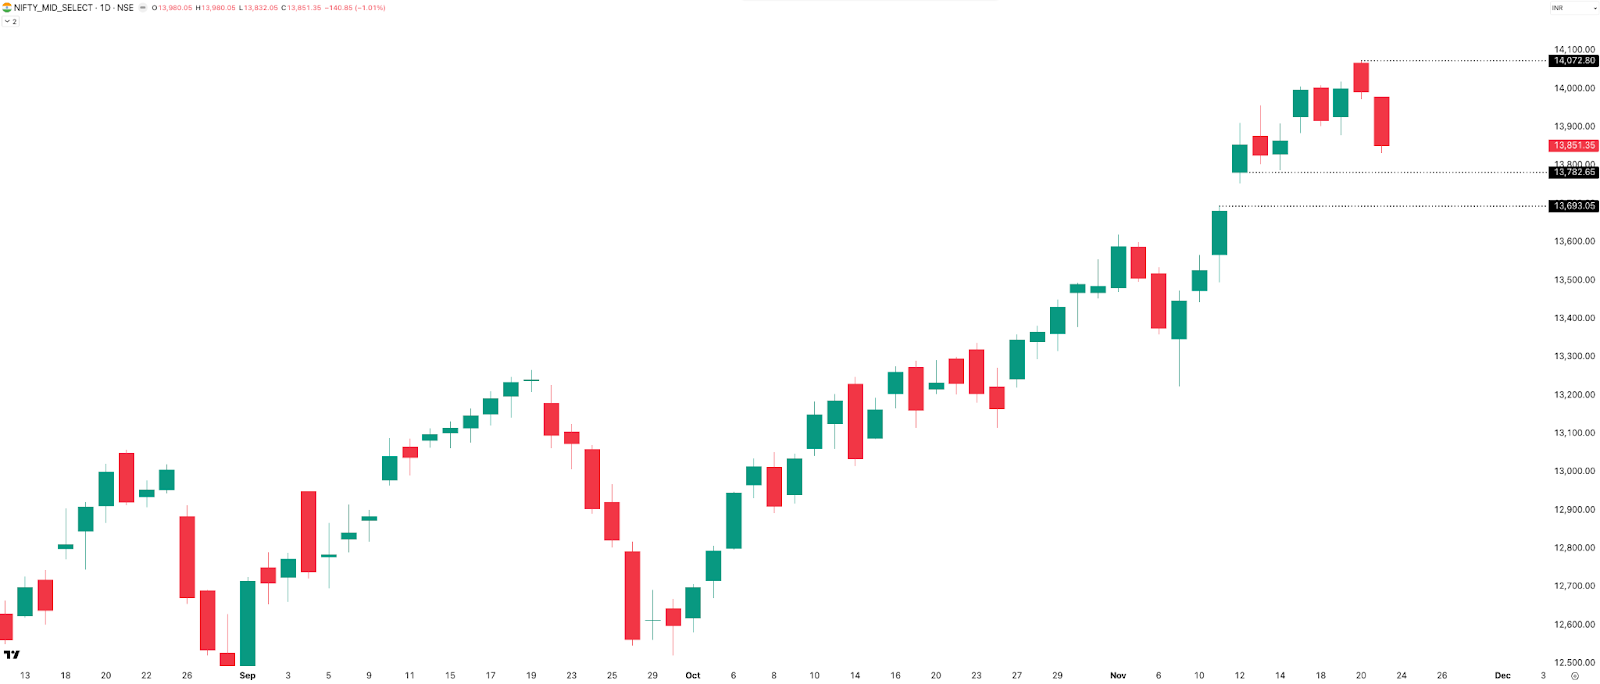
MIDCPNIFTY printed two back-to-back red candles to end the week, which did shift the momentum a bit after hitting its ATH on Thursday. But as long as the gap zone at 13,750–13,700 holds, the outlook remains positive. This is also the support area.
Immediate resistance is this week’s high at 14,073—the current all-time high.
SENSEX - Technical Analysis
Weekly Timeframe
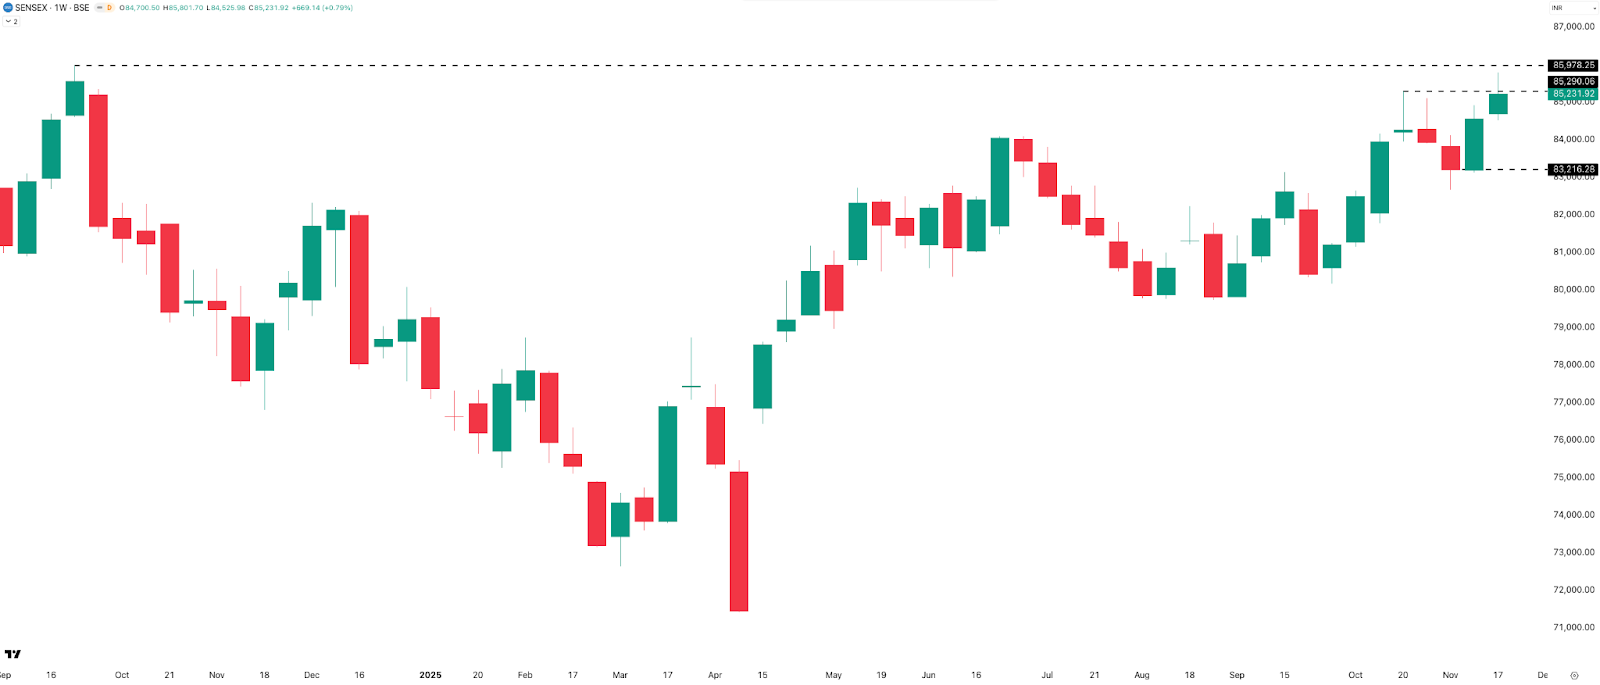
The chart looks very similar to NIFTY. It missed a new ATH by just 176 points, or 0.21%, after hitting a weekly high of 85,802. Sensex added 669 points this week, up 0.79%, to close at 85,231—its highest weekly close since September 2024. That also makes it two straight green weekly candles.
Immediate resistance is at 85,300, followed by the 85,800–86,000 zone, with support down at 83,200. Whenever we finally see an ATH on NIFTY, we’ll see one on SENSEX too. Pretty easy to guess… right?
Daily Timeframe
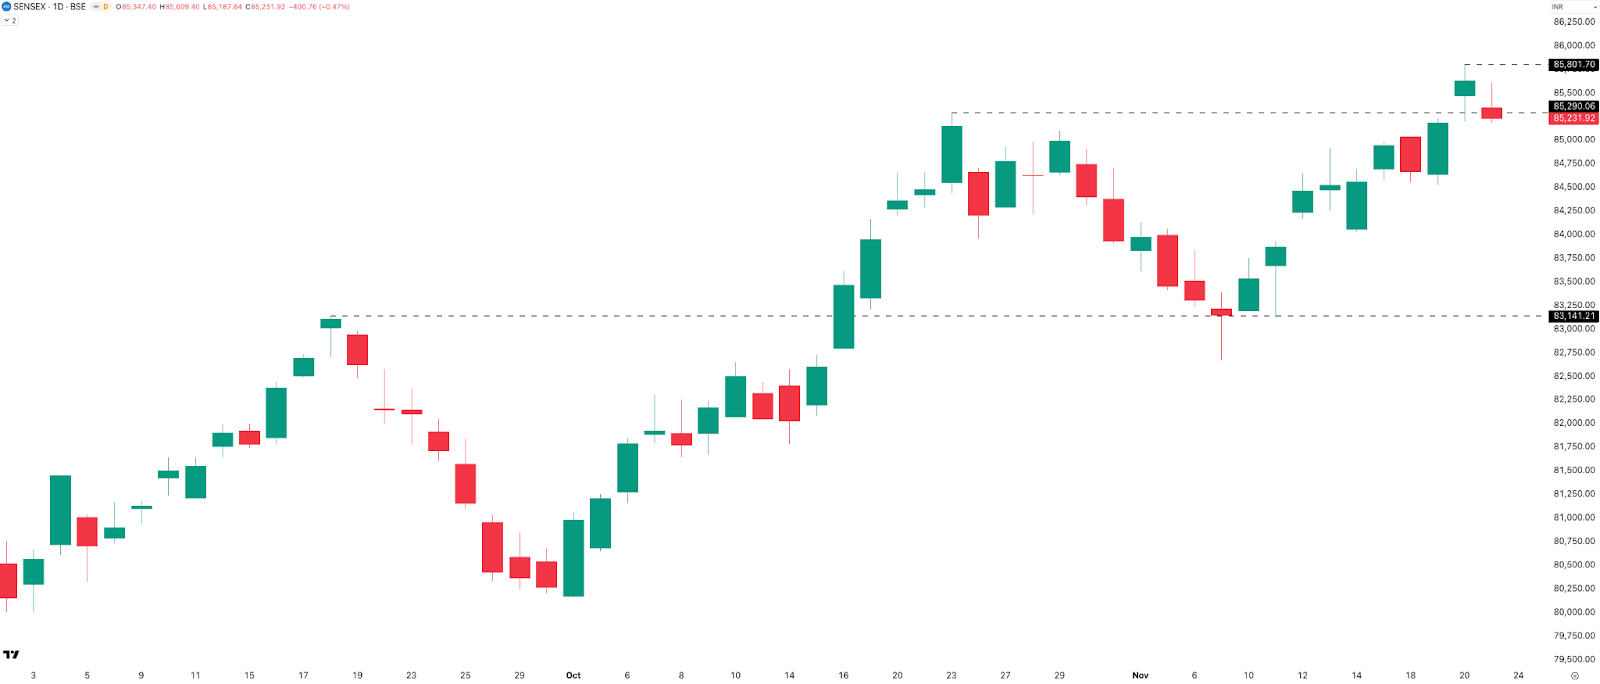
The story is similar to NIFTY. Resistance sits at 85,300 and 85,800, with support at 83,150. I wouldn’t judge Friday’s candle until we see the follow-up next week.
The bias is still bullish, but we’ll need a strong push to break 85,800, and then the ATH zone around 86,000.
Market Metrics Summary
Rate of Change (Weekly Performance)
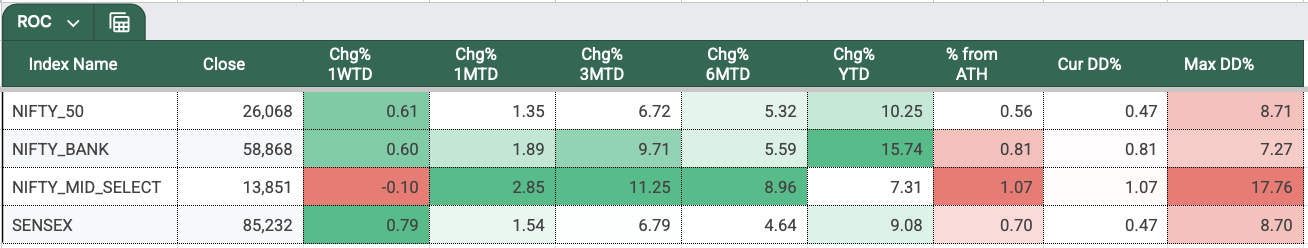
In Week 47 of 2025, all indices except MIDCPNIFTY gained around 0.6% to 0.8%, while MIDCPNIFTY slipped –0.1%. For November 2025, all indices are comfortably in the green.
All four indices are now just 1% away from their all-time highs. Year-to-date, NIFTY has finally hit double-digit returns at +10.25%, while BANKNIFTY remains the top performer with a solid +15.74%. SENSEX is up 9%, and MIDCPNIFTY lags at +7.31%—making it clear that 2025 wasn’t a mid-cap year.
Will the story change in 2026, or will large caps continue to dominate? Let me know your thoughts in the comments.
Directional Bias
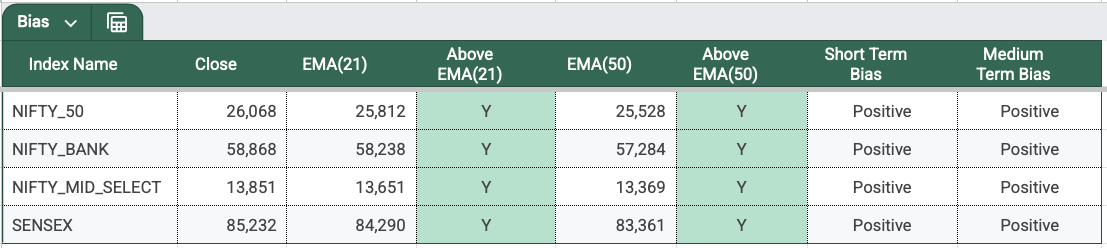
Just like last week, all four indices continue to hold a positive short-term and medium-term bias, with price staying above the 21 EMA and 50 EMA on the daily timeframe. The overall sentiment remains positive, but now we wait for price action to confirm whether this bullish phase continues with a proper continuation pattern—or not.
Sectoral Performance
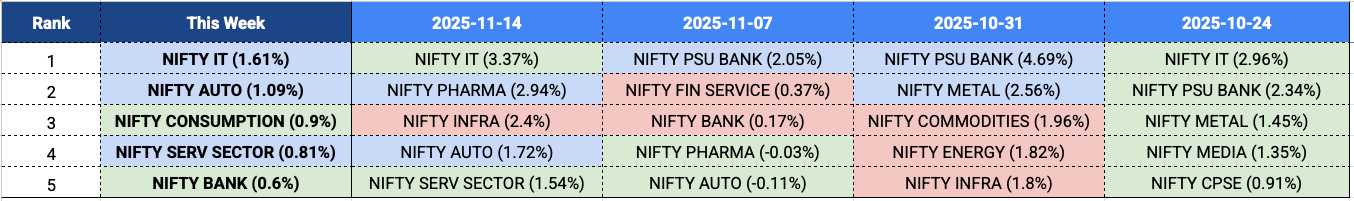
IT continues to lead for the second week in a row, with AUTO and SERVICES also carrying forward their strength from last week. Two new entrants are CONSUMPTION and BANK.
And with all the talk about an “AI bubble” brewing globally, our IT sector doesn’t seem to be showing any signs of weakness. Maybe Indian IT really has nothing to do with AI… just kidding.
Volatility & Derivatives
Range, Straddle Prices & Expiries
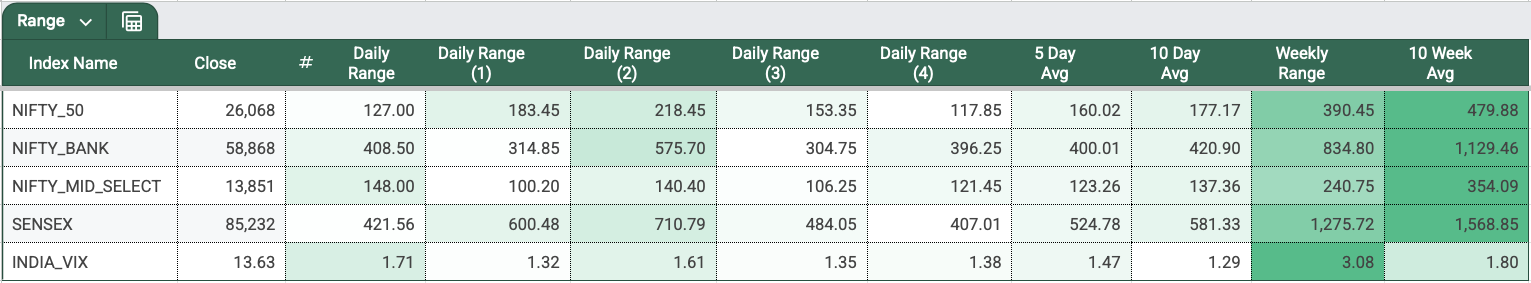
On Wednesday, NIFTY, BANKNIFTY, and SENSEX recorded their highest range day of the week. For MIDCPNIFTY, Friday was its highest range day.
NIFTY’s 5-day average range dropped from 200 to 160 this week. What does this range contraction mean? Likely a period of consolidation before the next big move. Even the 10-day average range has cooled off from 200 to 177.
Meanwhile, the NIFTY 2DTE straddle premium is at 209, up from 204 last week. Looks like the US markets really spooked Indian markets heading into the weekend—because even with a low 5-day average range of 160, the 2DTE straddle is still sitting at 209.
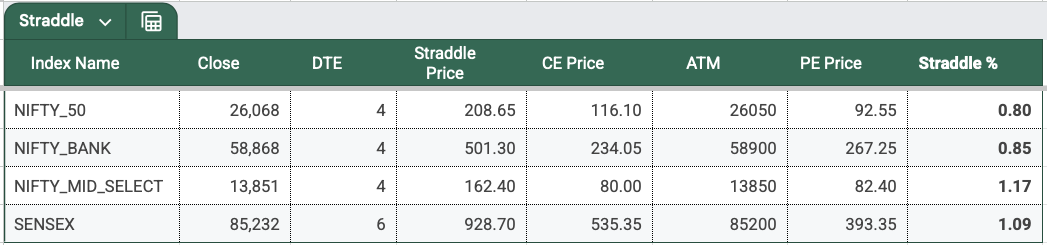
Now, talking about the NIFTY expiry—after last week’s tough expiry, this one was easier. With a 153-point range and a 117-point straddle premium at the open, there wasn’t much to complain about.
That said, NIFTY still gave us a full roller-coaster: 150 points down, then 120 points up, and then another 120-point drop, finally closing –0.40%, or 103 points down. So, fixed SL strategies would’ve struggled, while combined-premium SL strategies had a much better chance of surviving the swings.
SENSEX expiry this week was much tougher. With a 600-point range and a 335-point straddle premium at the open, it managed to trap both buyers and sellers—first dropping 270 points, then shooting 600 points straight up, and finally falling another 270 points.
After 2 PM, there was no gamma spike at all. In fact, short options actually made money post-2 PM. It’s a good reminder that we can never predict which setup will work on which day—and it’s always better to stick to a consistent approach, let the law of large numbers do its job, and keep our risk tightly controlled.
India VIX
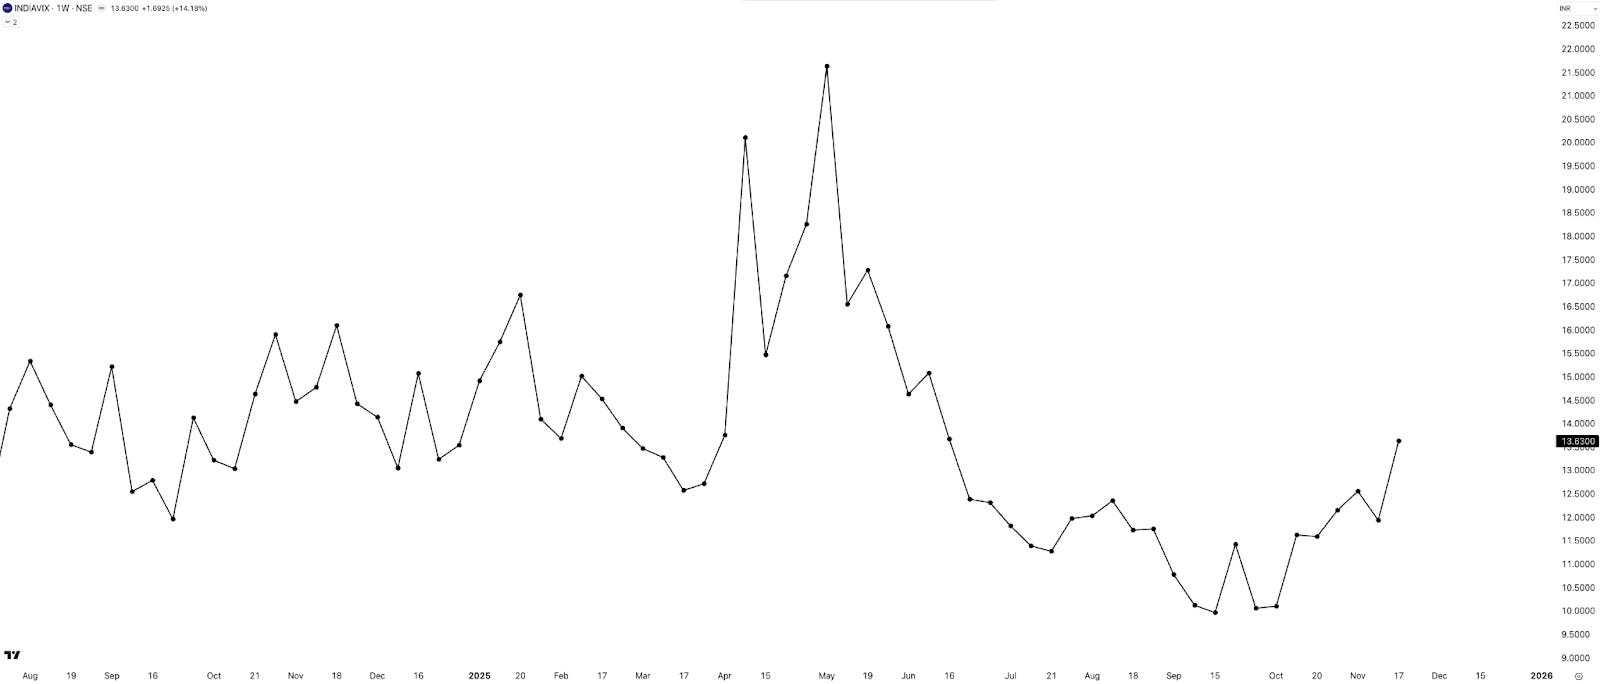
INDIAVIX jumped 14% this week, closing at 13.63—and the rising NIFTY straddle premium heading into the monthly expiry reflects the same tension. From the bottom of 9.96 in September 2025, VIX has now risen 37% in just two months.
Is this purely the impact of the US markets… or is something else brewing beneath the surface?
Commodities Update
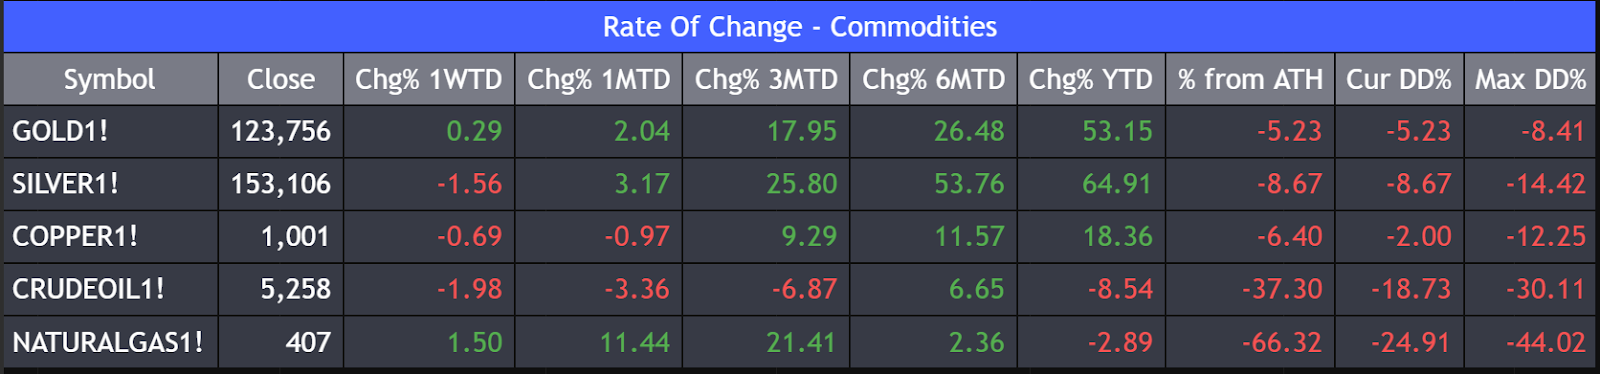
(Data: MCX Continuous Futures - Back Adjusted)
Gold was stable this week with a small gain, continuing its strong momentum across all longer periods, though still about 5% below its ATH.
Silver dipped slightly but remains the strongest performer this year, with major gains over the last six months and nearly 65% YTD, despite being 9% off its peak.
Copper was quiet with a mild weekly decline, but holds a healthy medium-term trend and stays less than 7% below its ATH.
Crude Oil stayed weak with another negative week and remains deep in a drawdown. Natural Gas gained this week and continues its short-term recovery, though it still trades far below long-term highs.
Overall, precious metals lead, base metals remain steady, and energy continues to lag.
Summary & Looking Ahead
The markets had a broadly positive and healthy week. NIFTY maintained its strongly bullish structure, closing above the 26,000 psychological level and near a new all-time high (ATH).
Both BANKNIFTY and MIDCPNIFTY hit fresh ATHs, though the appearance of shooting-star-type candles signals potential short-term hesitation, even as the overall trend remains positive.
SENSEX also delivered a solid, bullish performance, nearing its ATH. Across the board, all major indices hold a positive bias well above their key moving averages, with the IT sector leading the charge for the second consecutive week.
However, Volatility (INDIAVIX) climbed sharply, influenced by US market anxiety, which kept option premiums elevated despite NIFTY’s tight range.
In summary, while the week was marked by strong bullish momentum, minor technical warnings exist, so I will be closely monitoring market developments next week.
What to Expect Next Week
Next week marks the monthly expiry for all NSE F&O stocks and indices—including NIFTY, BANKNIFTY, and MIDCPNIFTY—on Tuesday and SENSEX on Thursday.
Next week is the final week of November, and we’ve got a full five-day trading stretch with no major events on the calendar. Let’s see whether the market uses this calm period to break into fresh all-time highs… or chooses to consolidate a bit before making its next move.
That’s pretty much it for this week. And yes—don’t forget to subscribe to the channel.
Until then—stay curious, stay steady, and have a great weekend!
See you soon!