Hello and welcome to Weekly Market Metrics!
We’re in week 48 of the year—just one month left in 2025. I am actually getting stressed thinking about resolutions? Never mind.
Let’s talk markets—it’s once again time for our weekly dose of market metrics.

After BANKNIFTY and MIDCPNIFTY hitting ATH last week, NIFTY and SENSEX also hit new all-time highs this week. It’s been 14 months since the last ATH on NIFTY. In that period, NIFTY fell 17% from the top—a reminder of how volatile equities can be. Hopefully, this breakout sustains, and the next leg up is smoother.
On the news front, the RBI’s latest report says India’s economy remains resilient, with strong growth in manufacturing and services supported by GST reforms. However, global market volatility and elevated equity valuations continue to pose risks to financial stability.
So, the markets are at ATHs, but the typical euphoria we usually see at such levels is missing this time. That could be because of weak breadth. While the index is at an ATH, many individual stock portfolios are underperforming.
One more reason to invest in indexes rather than get into stock picking? What do you think? Let me know in the comments.
Anyways, let’s get started with the charts and indexes. As always, Nifty first.
NIFTY 50 - Technical Analysis
Monthly Timeframe
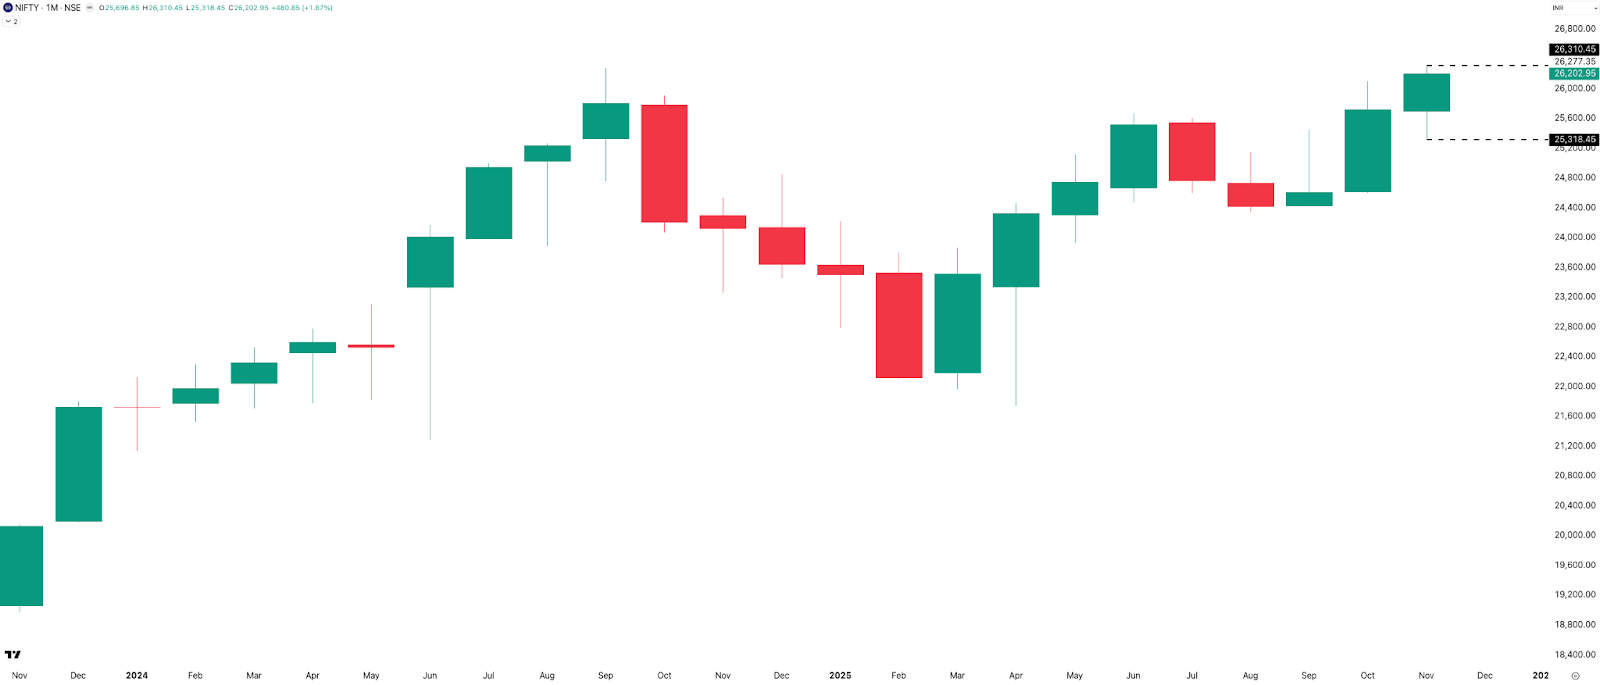
For November, Nifty gained 481 points, or 1.87% over last month’s close. This also marks three straight green monthly candles. The month’s range was 992 points—roughly 4%. The 2025 average monthly range is around 1,400 points, making November the second-lowest range month of the year after August. Every other month has seen a four-digit range.
The monthly candle indicates bullish sentiment as Nifty is sitting close to all-time highs. Support and resistance levels on the monthly timeframe aren’t always the most useful from a trading perspective, so I’ll keep it simple: November’s low at 25,300 serves as support, and the ATH at 26,300 acts as resistance.
Monthly Seasonality
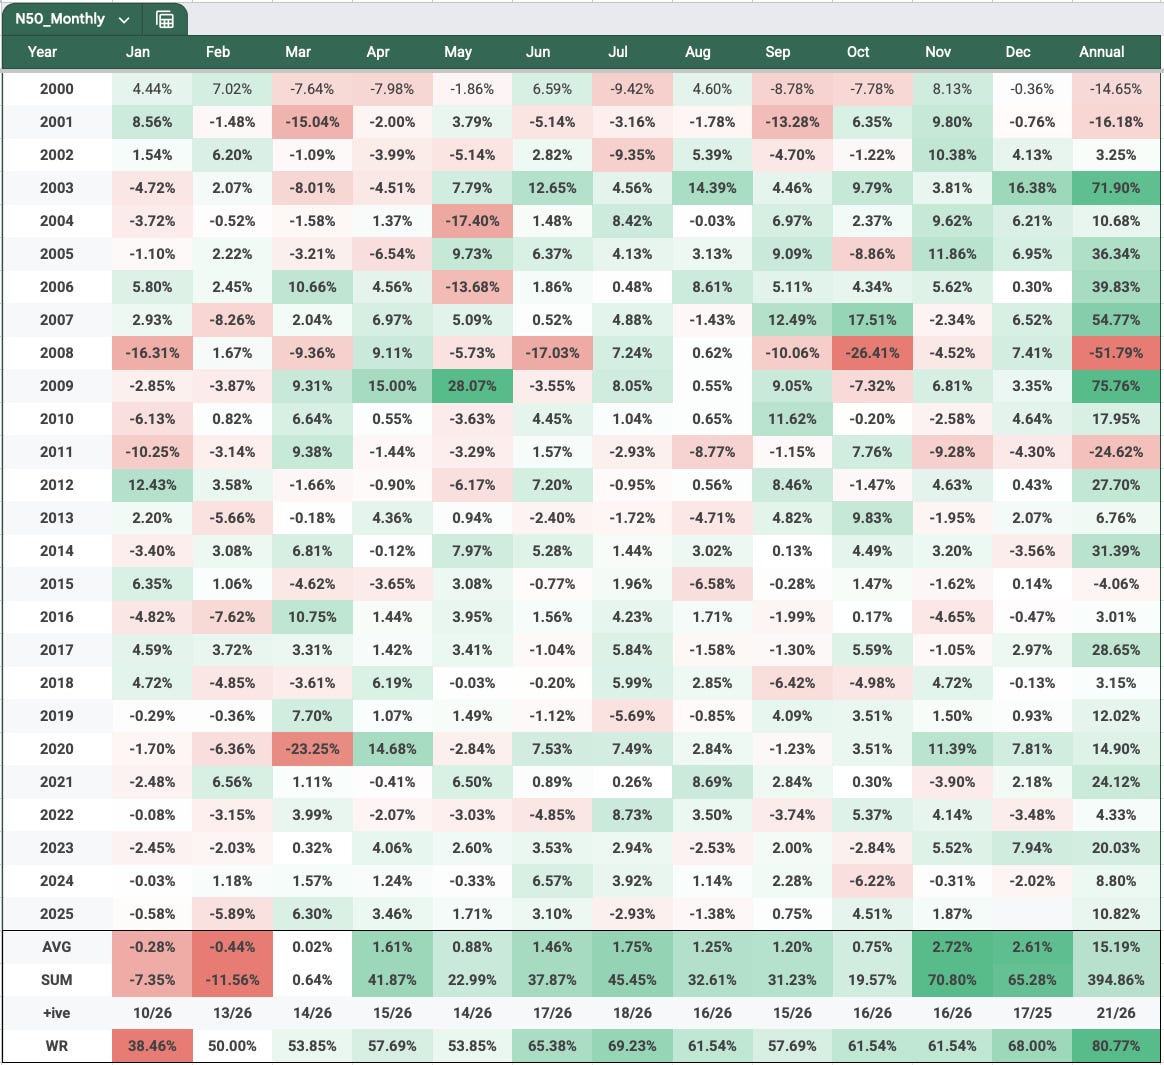
With November behind us, let’s take a look at NIFTY’s monthly seasonality. After a strong 4.5% move in October, November added another 1.87%, taking NIFTY’s 2025 year-to-date returns to 10.82%.
As we discussed last month while reviewing the October seasonality table, November historically has a higher probability of closing in the green—and that pattern played out once again.
Now we’re stepping into December, the month with the highest historical probability of delivering positive returns. Will it print a green candle this time? Let’s see.
For a bit of a contrarian perspective—and a reminder of how recency bias can cloud our judgment—in the last three years (2024, 2023, and 2022), December has closed red twice. So it’s a good data point to keep in mind.
Weekly Timeframe
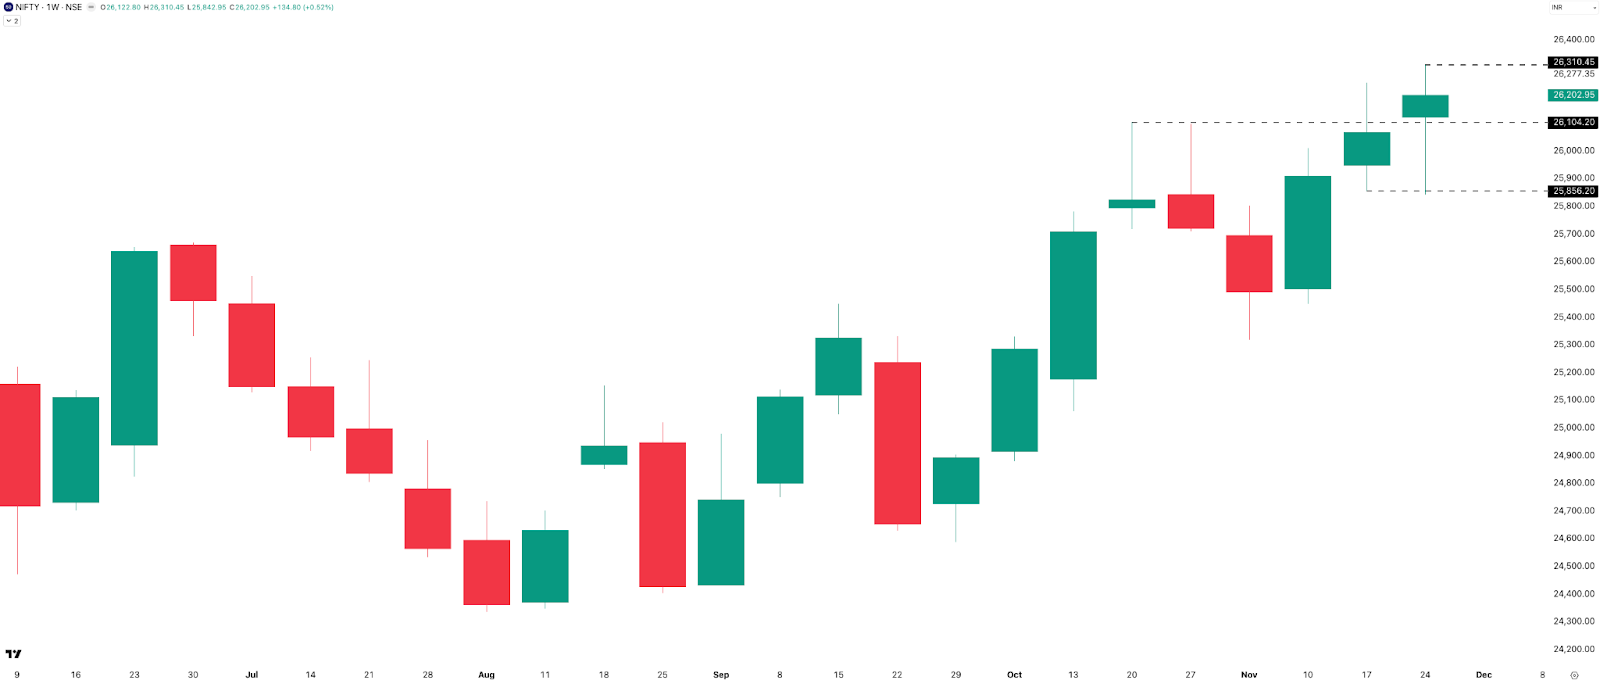
NIFTY gained 135 points or 0.52%, marking three consecutive green weekly candles and closing at 26,202. During the week, it hit a high of 26,310 before settling 108 points lower. Resistance remains at 26,310, and above that, there are no clear technical levels. Support comes in at 26,100, followed by 25,850—the low from the past two weeks.
This week’s candle breached both last week’s high and low, eventually closing 360 points (1.39%) above the current week’s low. It was an eventful week with a total range of 468 points.
The weekly structure remains bullish, and at all-time highs, long setups typically make more sense unless you’re trading contrarian. A pullback near 26,100 would still keep the uptrend healthy.
Daily Timeframe
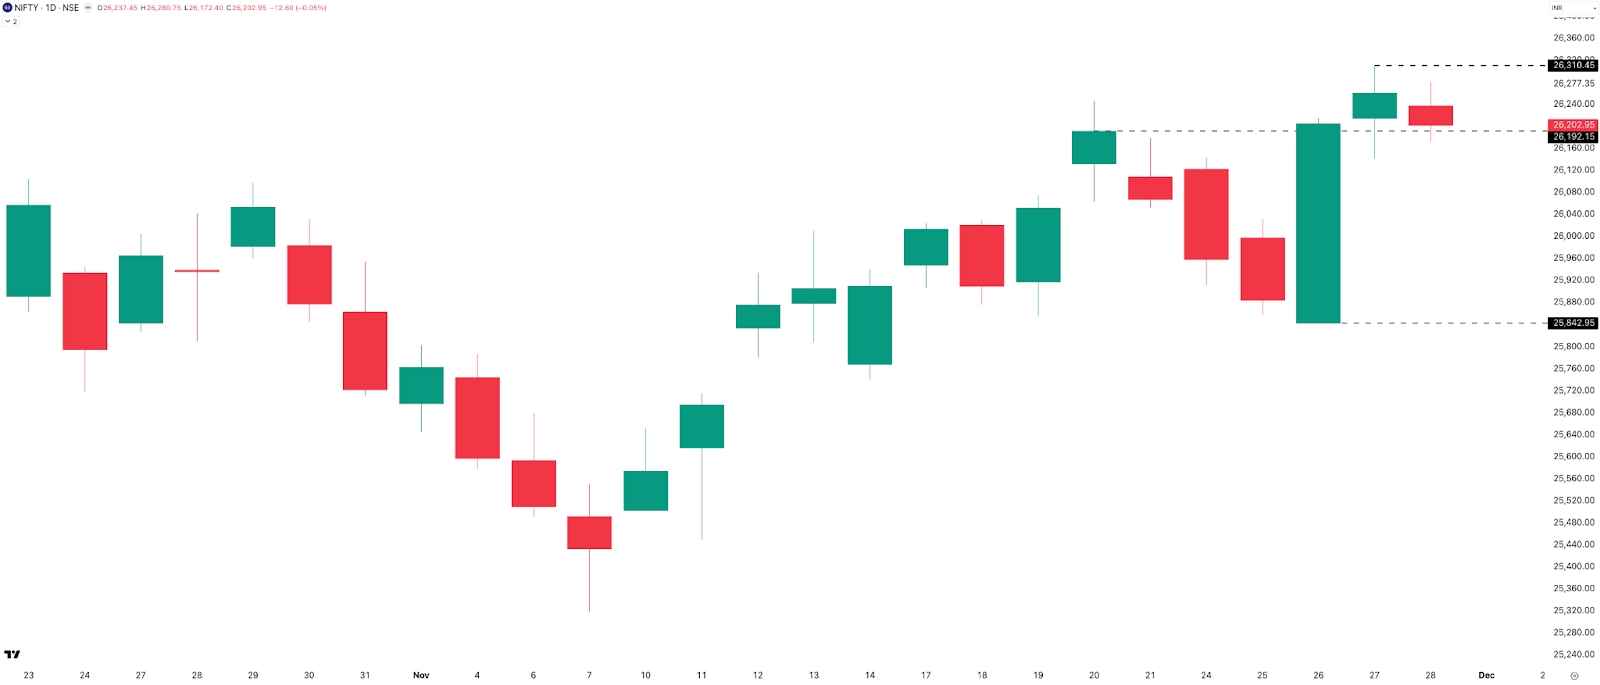
NIFTY started the week with two red candles on Monday and Tuesday, and many traders began assuming last week’s move toward 26,250 was a fakeout. But Wednesday delivered one of the cleanest trending up-days in a long time—Nifty rallied 320 points (+1.24%) and almost engulfed the previous seven daily candles.
On Thursday, Nifty hit a new all-time high at 26,310, followed by a mild pullback on Friday toward the 26,200 zone. With that, the new resistance is the ATH at 26,310. Support sits at 26,100, followed by 25,850.
Just like the weekly chart, the daily structure remains in an uptrend as long as the 26,100 level holds.
Hourly Timeframe
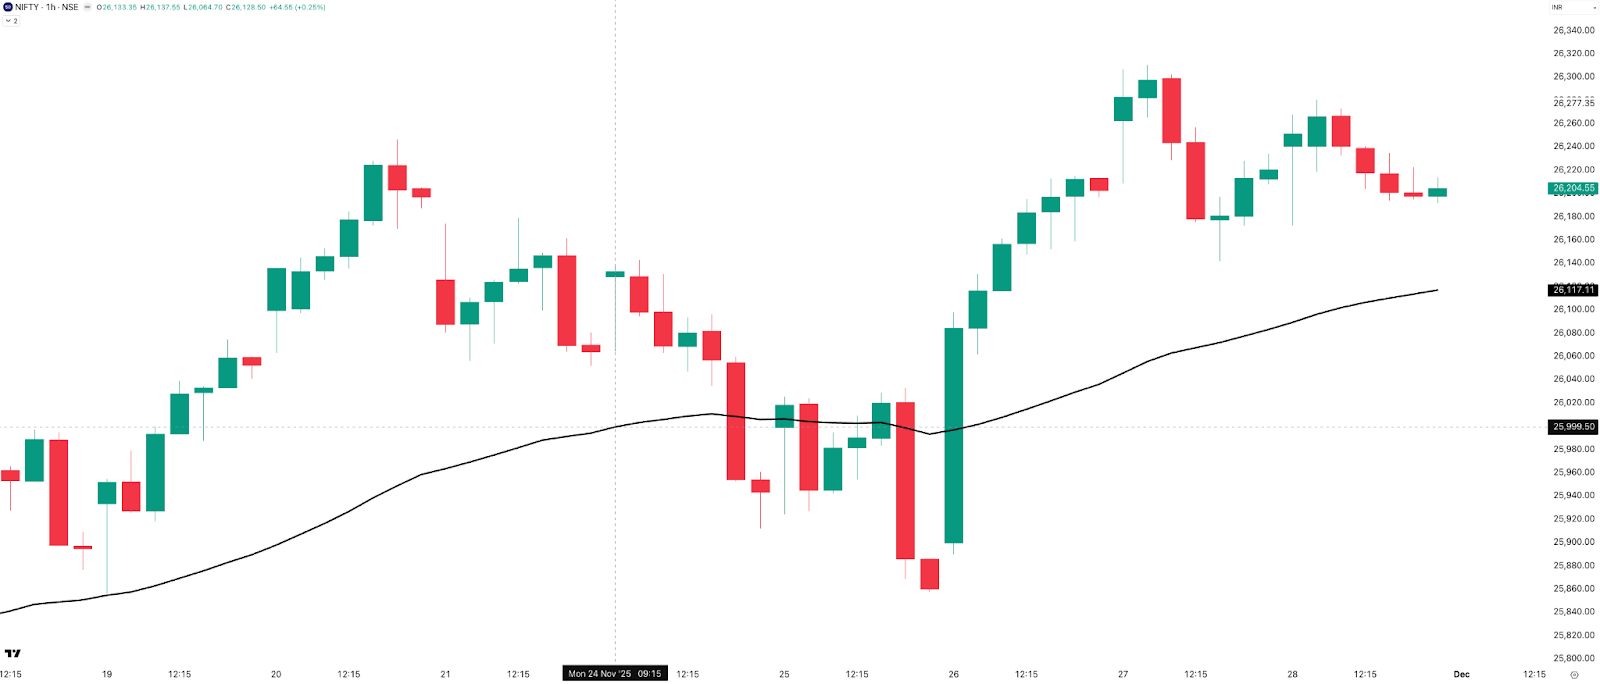
On the 1-hour chart, using the 50 EMA to gauge the trend, NIFTY dipped below the EMA on Monday and chopped around on Tuesday on the monthly expiry. As has happened many times before, there was no downside follow-through, and the index quickly reclaimed the 50 EMA on Wednesday and held above it for the rest of the week.
Interestingly, the 50 EMA on the hourly chart is also sitting near the 26,100 level—the same support highlighted on the daily and weekly timeframes. That makes 26,100 a strong confluence zone.
The hourly bias remains positive, and as long as NIFTY holds above this confluence area, the structure favors continuation to the upside.
Overnight vs. Intraday Moves
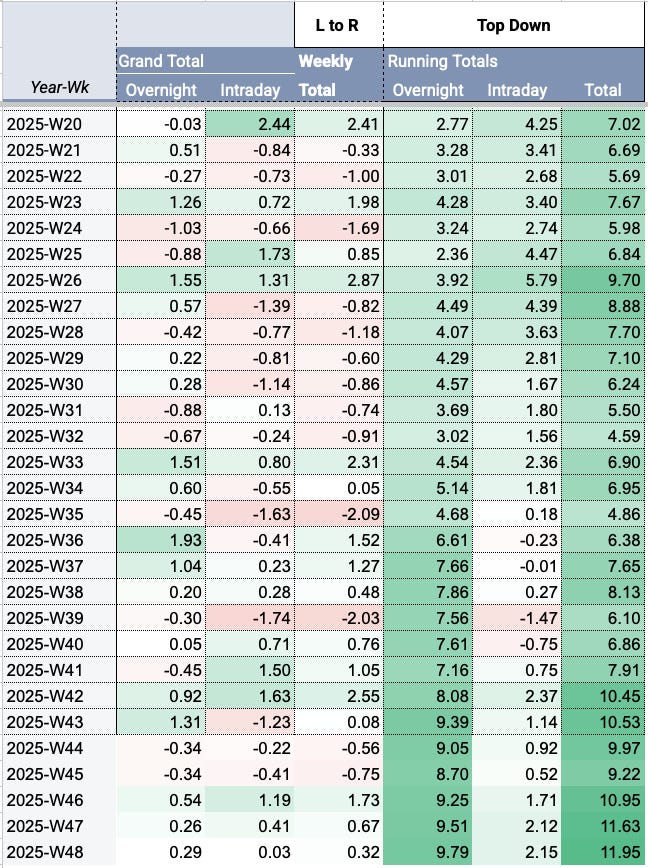
Overnight moves continue to remain muted. Once NIFTY decisively breaks above 26,300, we might start seeing stronger positive gaps, but for now, we’ll have to wait and watch.
This week, NIFTY opened with positive gaps on Monday, Tuesday, and Thursday, adding a total of 0.29% in overnight gains. Intraday moves, however, were almost flat at +0.03%.
With four weeks left in 2025, NIFTY has gained +9.79% from overnight moves and +2.15% from intraday moves.
BANK NIFTY - Technical Analysis
Monthly Timeframe
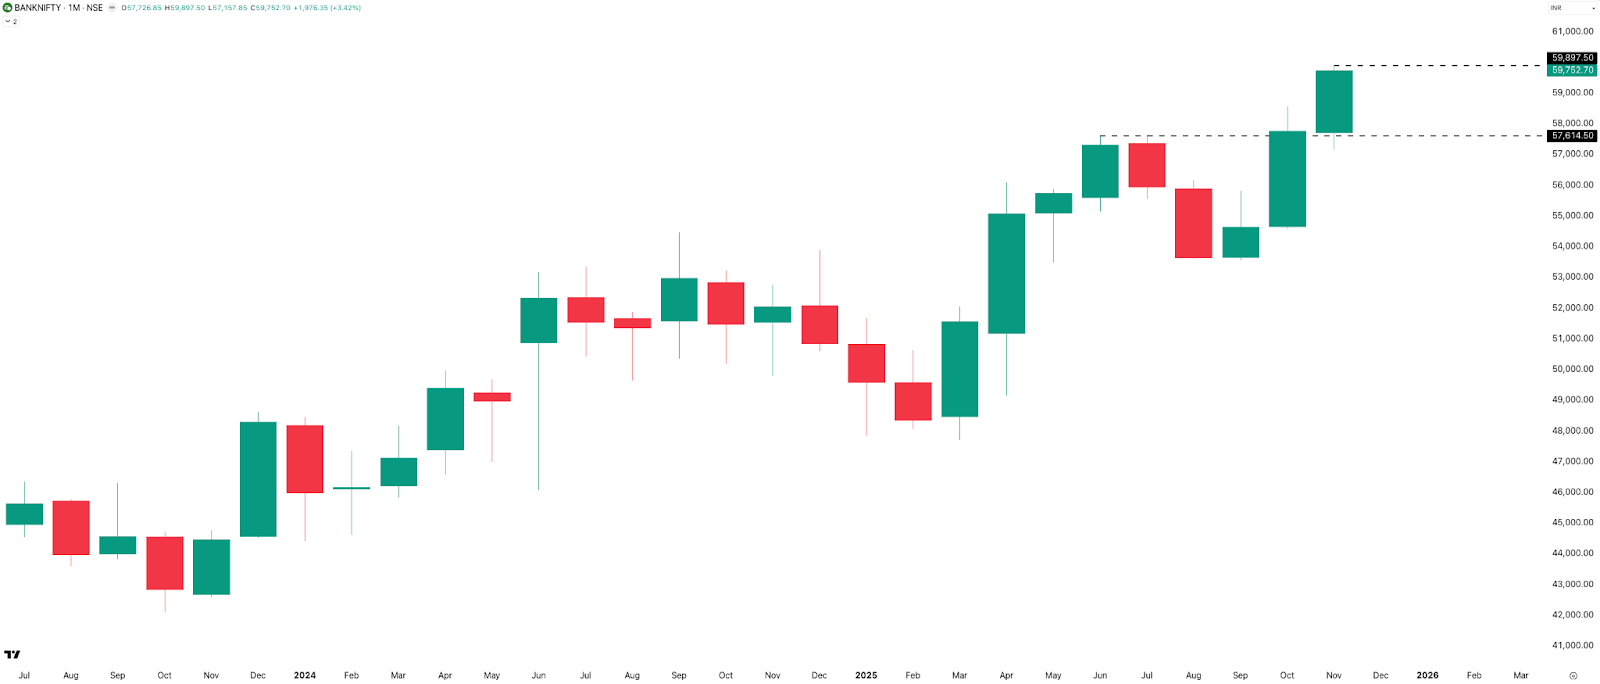
For November, BANKNIFTY gained 1,976 points, or +3.42% over last month’s close. It continues to outperform NIFTY on the monthly timeframe, with each of the last three monthly candles gaining more than NIFTY. November’s range came in at 2,740 points, which is around 4.8%.
Similar to NIFTY, BANKNIFTY is also trading near its all-time high. 57,600 will act as support, while the ATH at 59,900 serves as the immediate resistance.
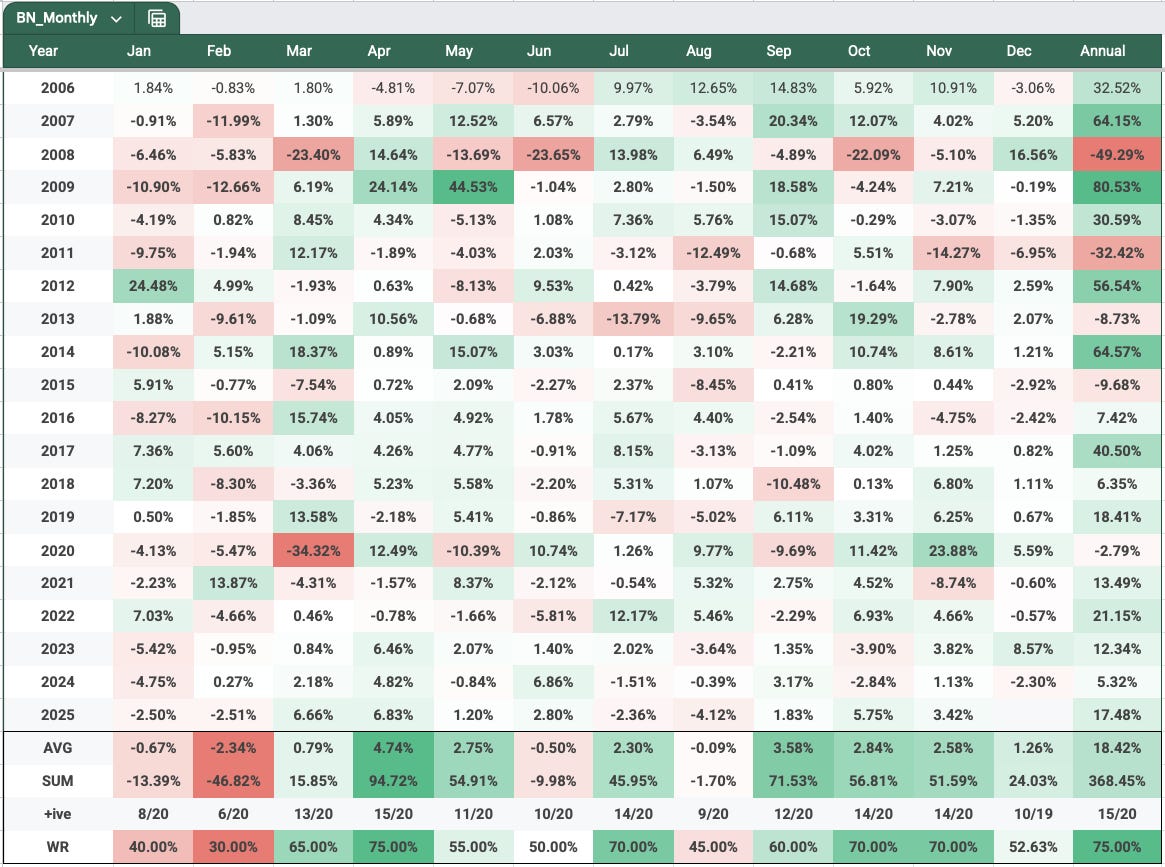
Talking about Banknifty monthly seasonality, the month ended with +3.42%. Let’s see how December fares. Unlike Nifty, for Banknifty, December is not a high win-rate month.
Weekly Timeframe
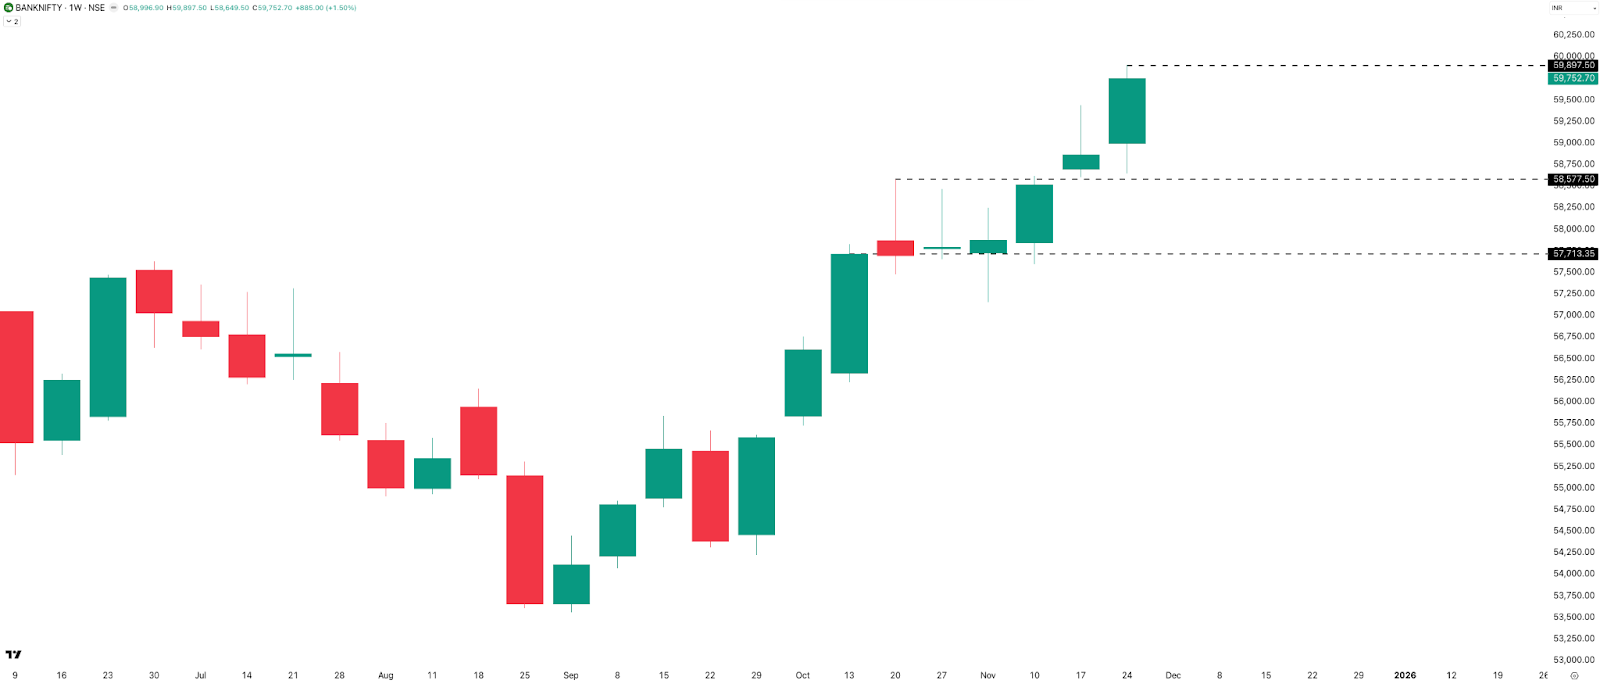
BANKNIFTY added 885 points, or +1.5%. It hit a new all-time high this week as well, touching 59,897 before closing 145 points lower at 59,753.
This week formed a strong green candle, clearing the doubts created by last week’s shooting-star-like candle. Support sits at this week’s and last week’s low around 58,600, with resistance at the ATH of 59,900.
Overall, BANKNIFTY looks relatively more bullish than NIFTY on the weekly timeframe.
Daily Timeframe
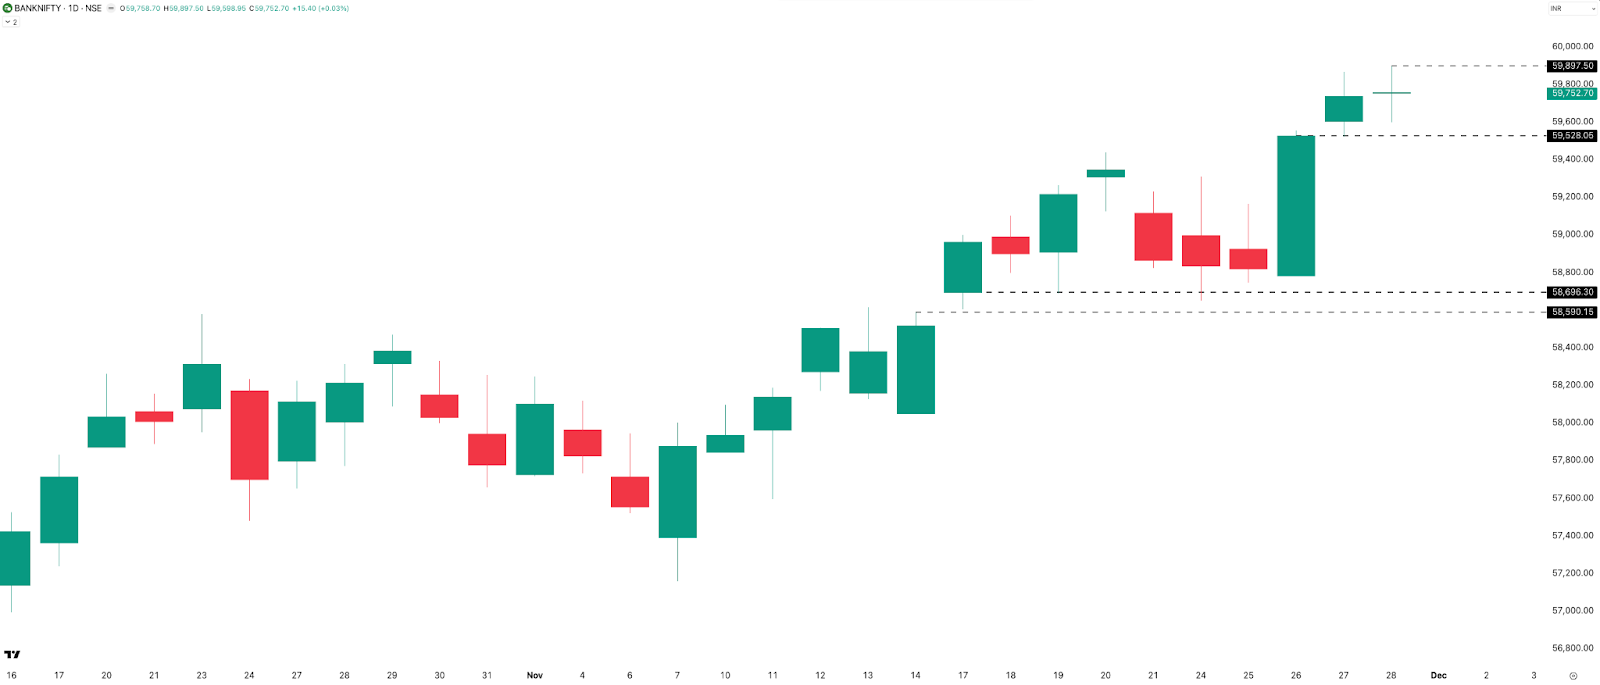
BANKNIFTY printed two red candles and three green candles. On Wednesday, Thursday, and Friday, it continued to make new all-time highs. Support lies at 59,500, followed by the 58,700–58,600 zone. Resistance remains at 59,900.
Hourly Timeframe
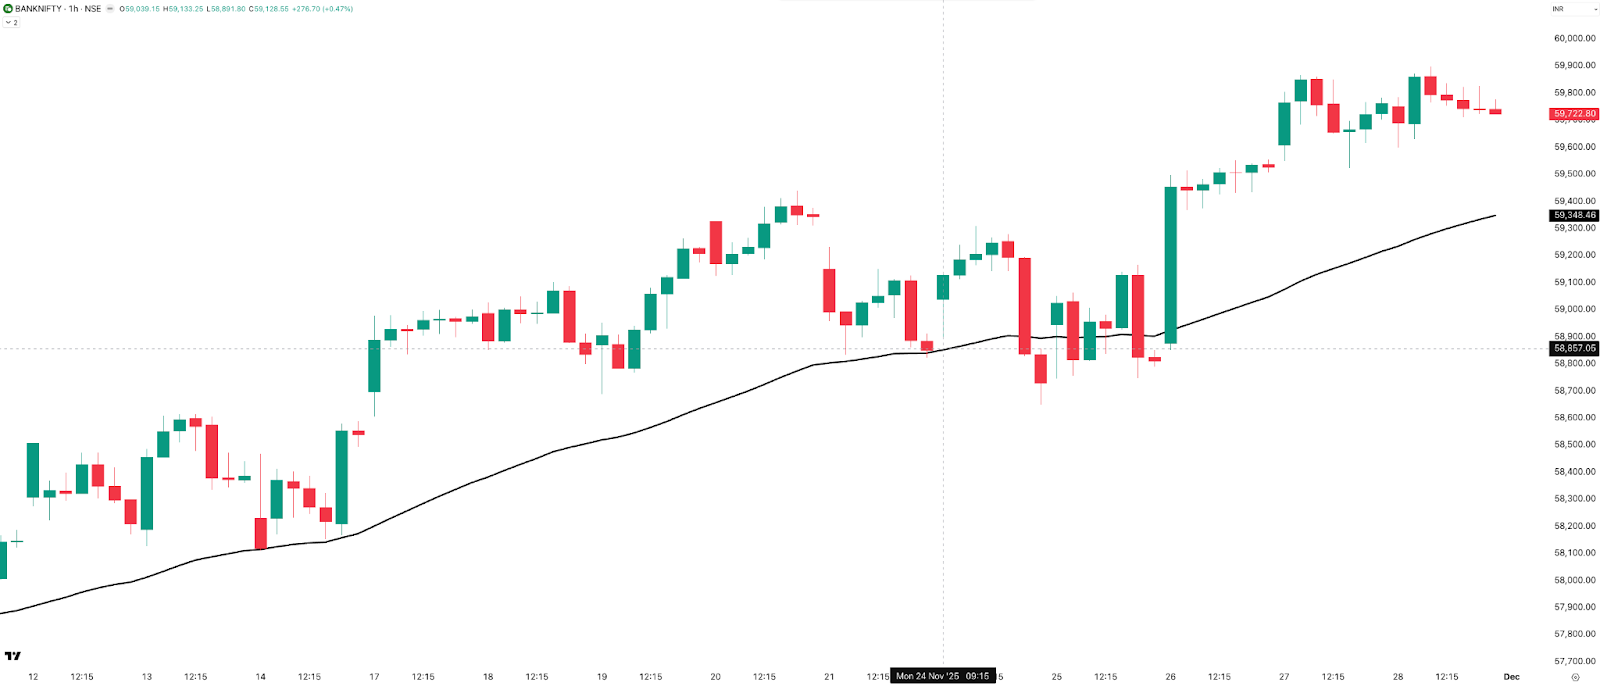
Looking at BANKNIFTY on the hourly chart, it chopped around the EMA on Monday and Tuesday, and then post the first hour on Wednesday’s it stayed above the EMA till the end of the week.
Across all timeframes, BANKNIFTY is bullish. A minor pullback is possible, but the broader trend continues to point higher.
NIFTY MIDCAP SELECT - Technical Analysis
Monthly Timeframe
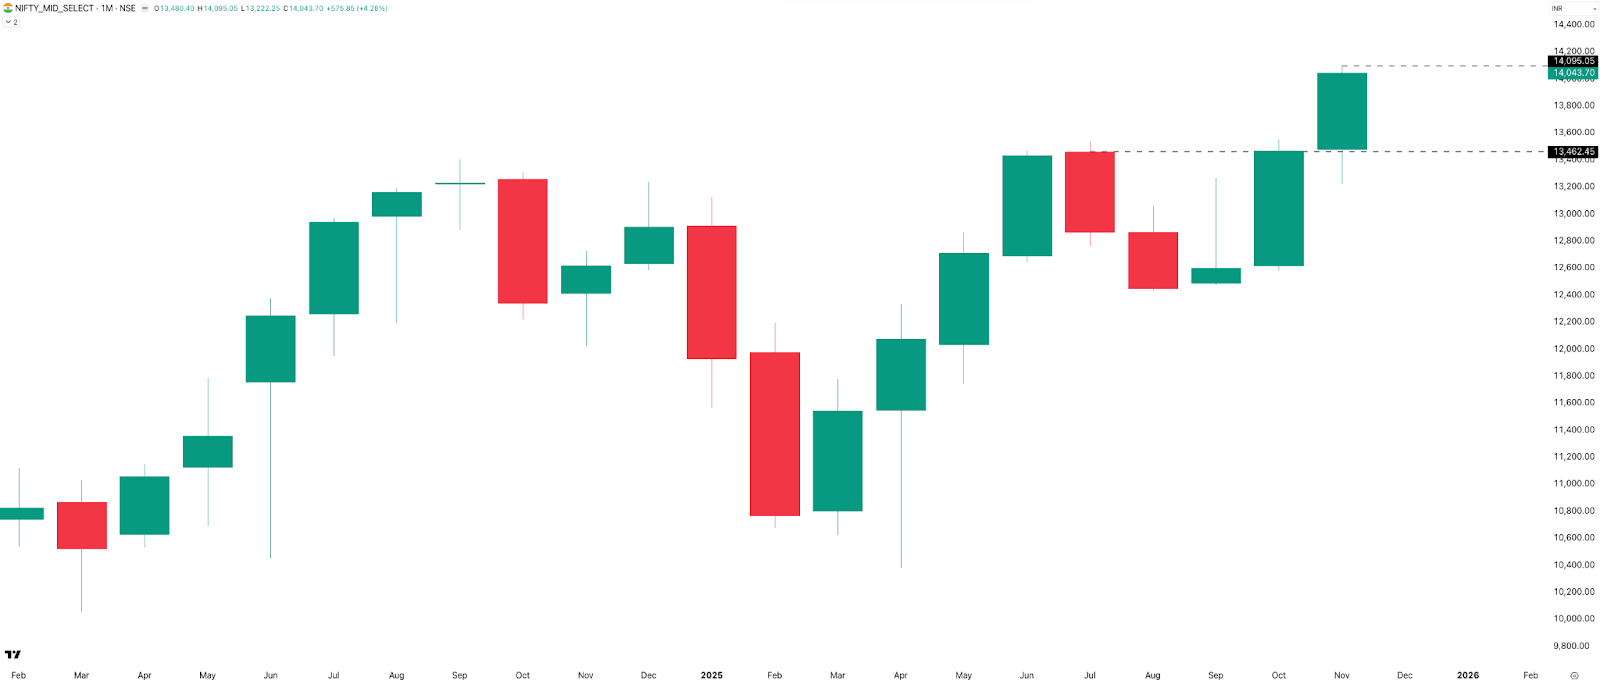
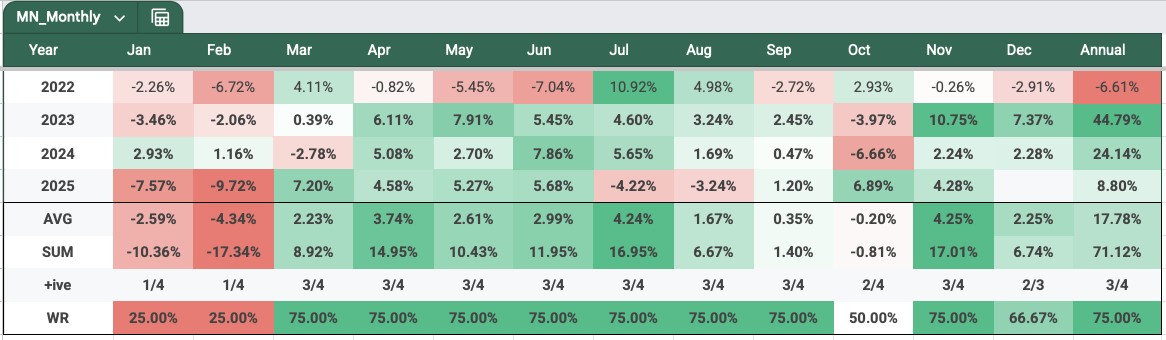
Similar to NIFTY and BANKNIFTY, MIDCPNIFTY also printed three consecutive green candles on the monthly timeframe. It gained 4.28%, or 576 points, in November to close at 14,044.
Even though MIDCPNIFTY is at an all-time high, the index doesn’t fully reflect the broader midcap space—many midcap stocks are still far from their highs. On the MIDCPNIFTY index, support is at 13,450, and resistance is at 14,095.
On the seasonality front for Midcapnifty, as shared earlier, we did 4.28% for November, which was a high win-rate month. Let’s see what’s in store for December. But we have limited data for this index, so I won’t read too much into it.
Weekly Timeframe
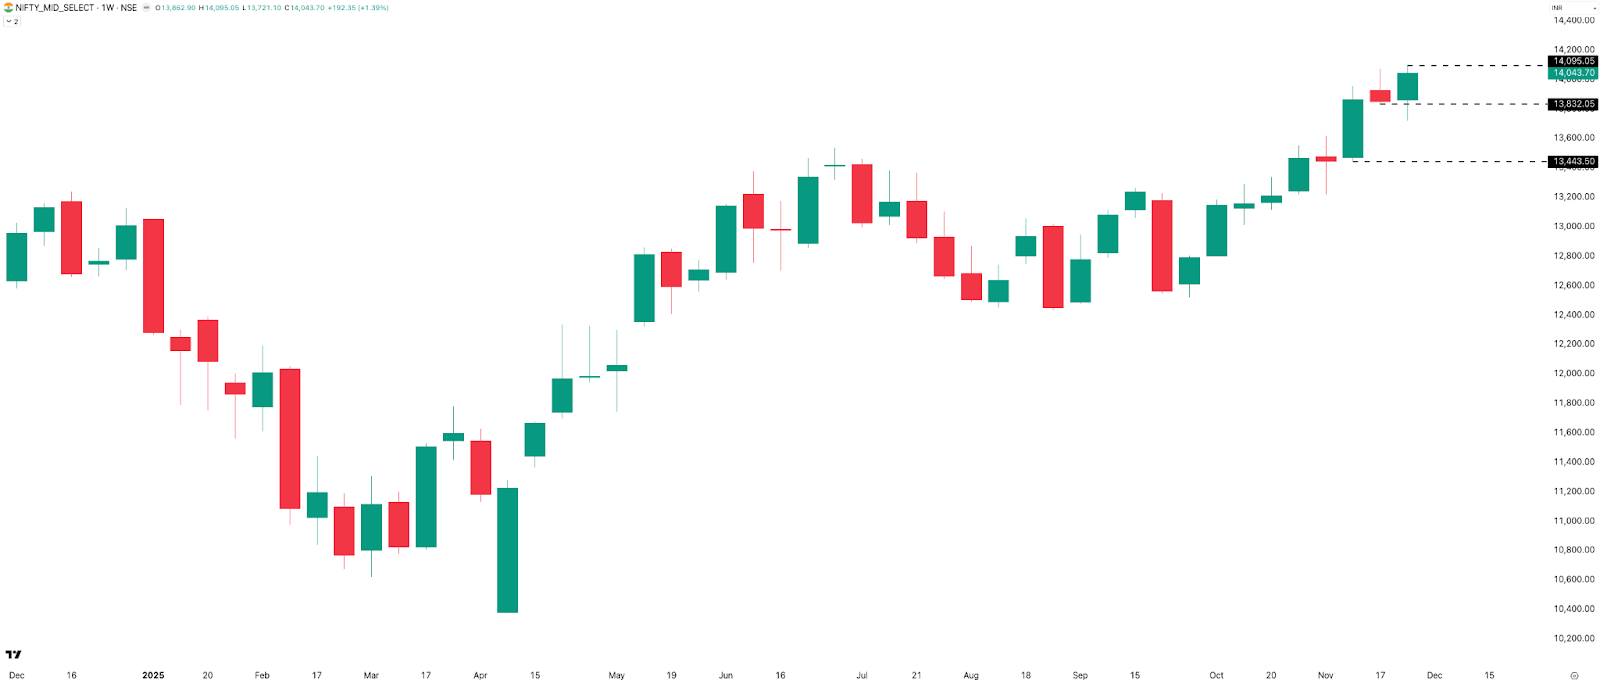
MIDCPNIFTY hit a new all-time high again this week at 14,095, which now acts as the immediate resistance. The index gained 1.39%, or 192 points, for the week and closed at 14,044.
Support sits at 13,850 and then at 13,450, with resistance at the new ATH of 14,095. The sentiment remains bullish, similar to BANKNIFTY.
Daily Timeframe
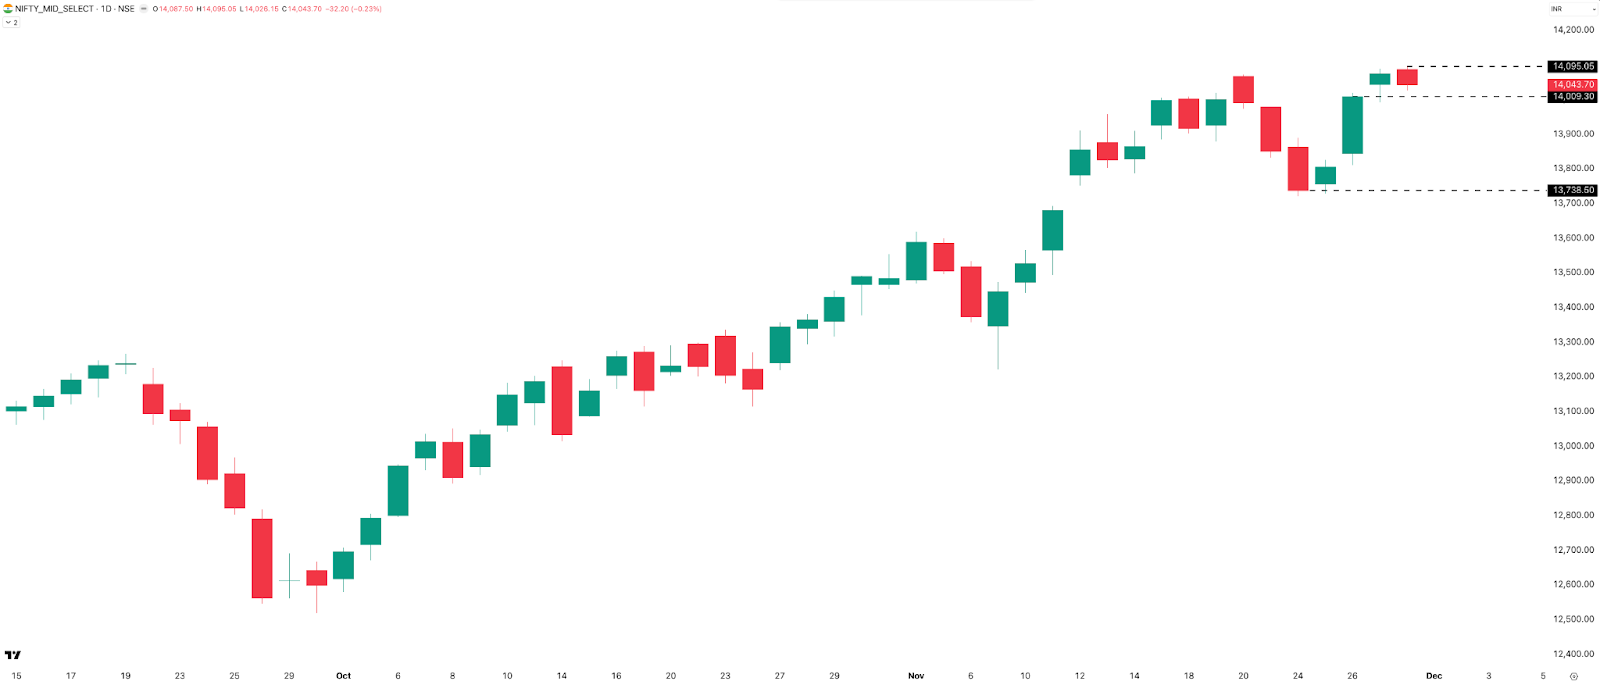
MIDCPNIFTY printed three green candles and two red candles, hitting new all-time highs on both Thursday and Friday. Resistance remains the same as on the monthly and weekly timeframes at 14,095, while support sits at 14,000 and then at 13,750.
SENSEX - Technical Analysis
Monthly Timeframe
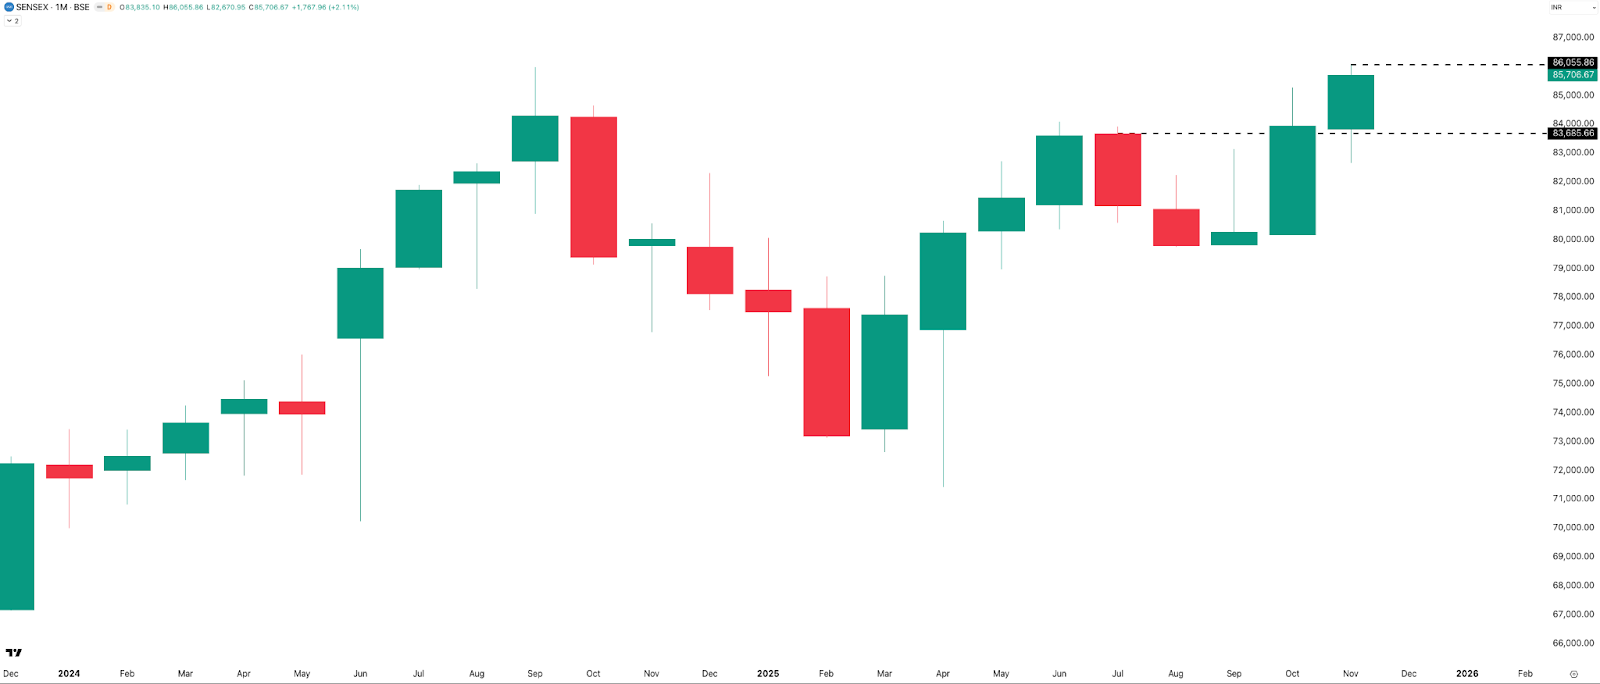
Similar to NIFTY, SENSEX on the monthly timeframe printed three back-to-back green candles, with November adding 1,768 points or 2.11%. The new ATH at 86,056 serves as immediate resistance, while support sits at 83,700. The monthly chart looks bullish with no bearish signs at the moment.
Weekly Timeframe
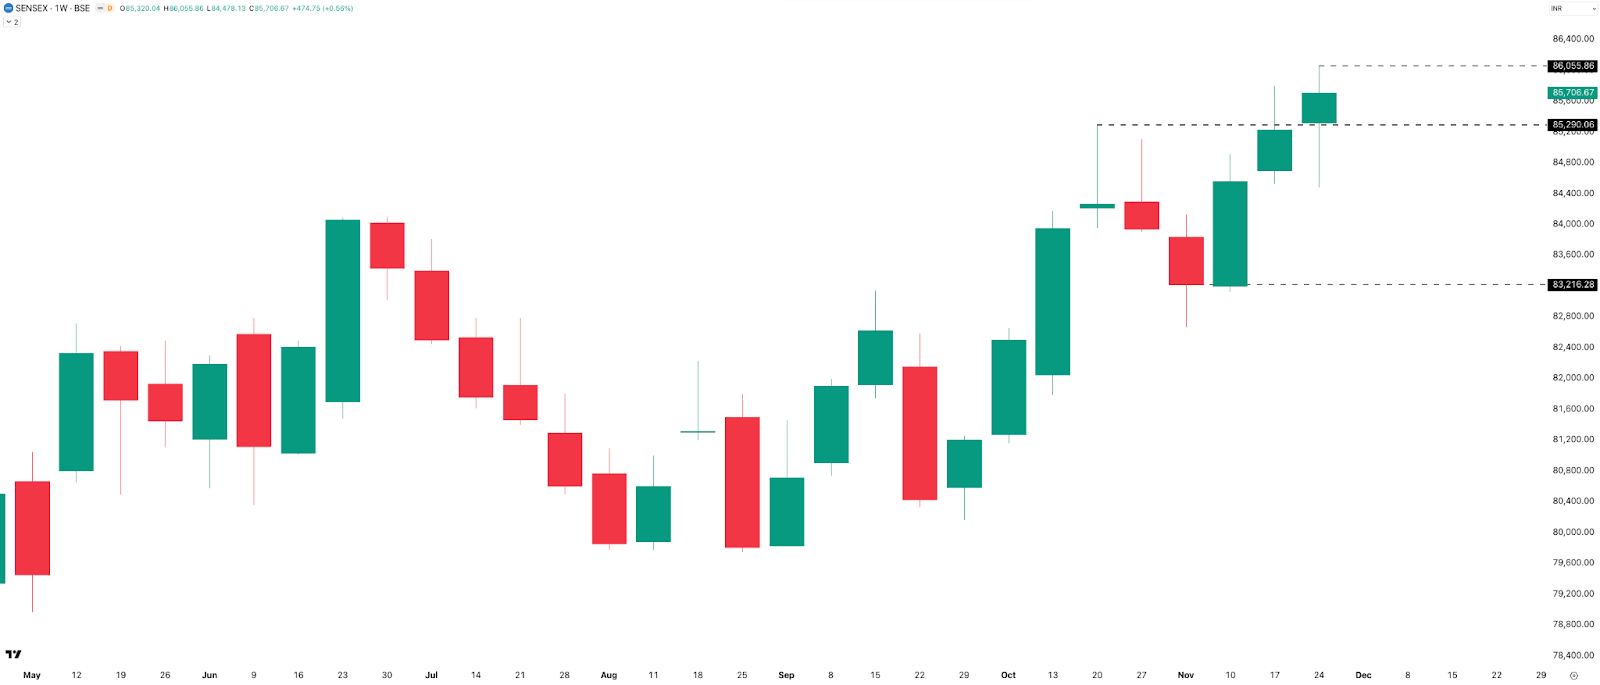
SENSEX finally hit a new all-time high after missing it by just 176 points last week. SENSEX added 475 points this week, up 0.56%, to close at 85,707—its highest weekly close ever. That also makes it three straight green weekly candles.
Immediate resistance is at 86,056, with support at 85,300 and then 83,200.
And remember what I said last week—when NIFTY hits an ATH, SENSEX usually follows. It happened this week. My prediction win rate on these obvious calls is still 100%.
Daily Timeframe
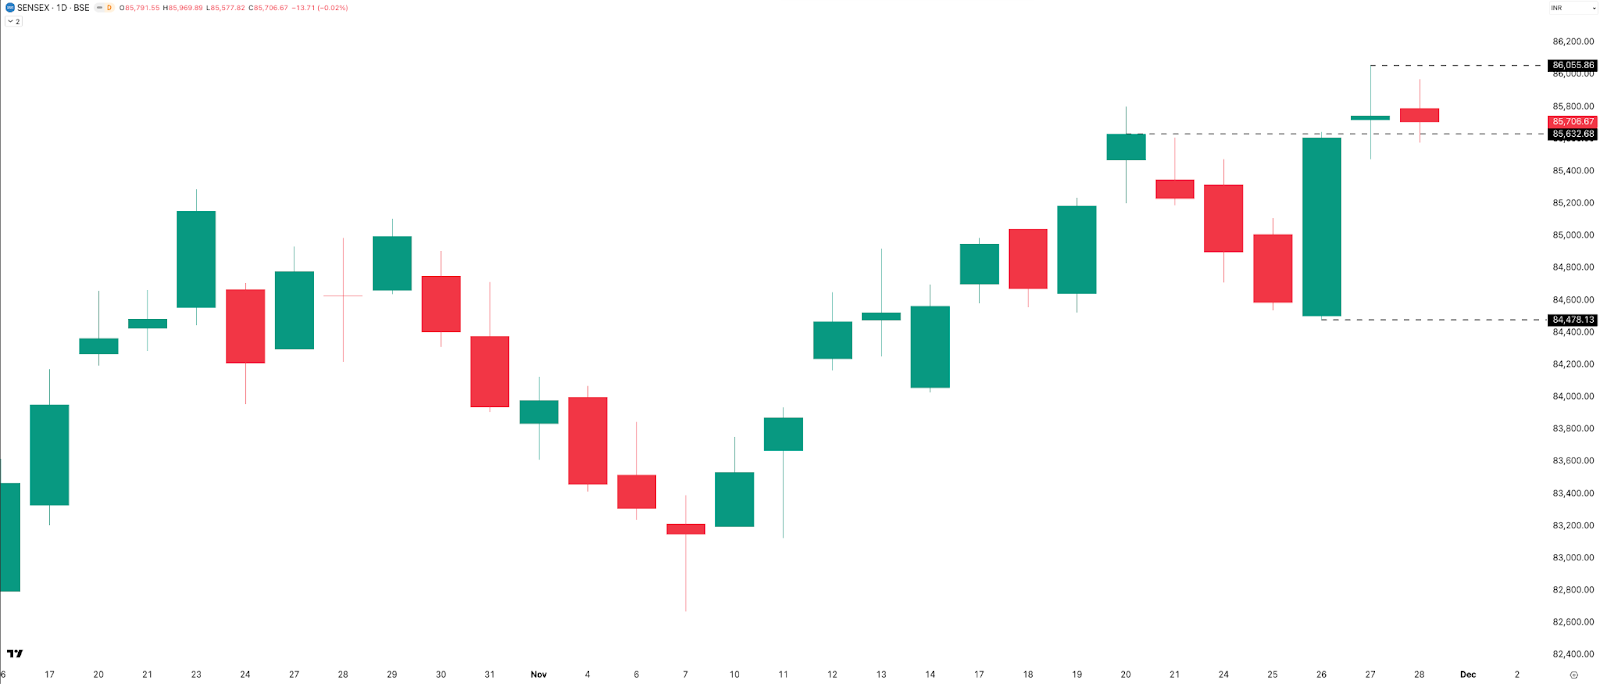
SENSEX opened the week with two red candles, followed by a strong marubozu green candle on Wednesday, and then two indecisive candles on Thursday and Friday. Thursday did mark a new ATH, but it closed lower.
Resistance remains at 86,056, with support at 85,600 and then 84,500. As long as the 85,600 level holds, the bias stays bullish, and any downside move is likely just a pullback.
Market Metrics Summary
Rate of Change (Weekly Performance)
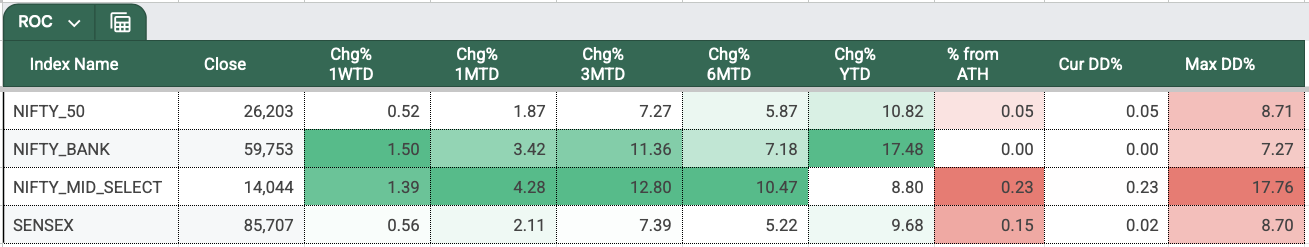
In Week 48 of 2025, all indices closed in green, with Banknifty being the strongest at 1.5% and Midcapnifty at 1.39%, followed by Sensex and Nifty.
For November 2025, all indices are comfortably in the green, with Midcapnifty leading on the monthly timeframe. All four indices are now at their all-time highs.
Year-to-date, NIFTY has given returns of +10.82%, while BANKNIFTY remains the top performer with a solid +17.48%. SENSEX is up 9.68%, and MIDCPNIFTY is at +8.80%.
Directional Bias
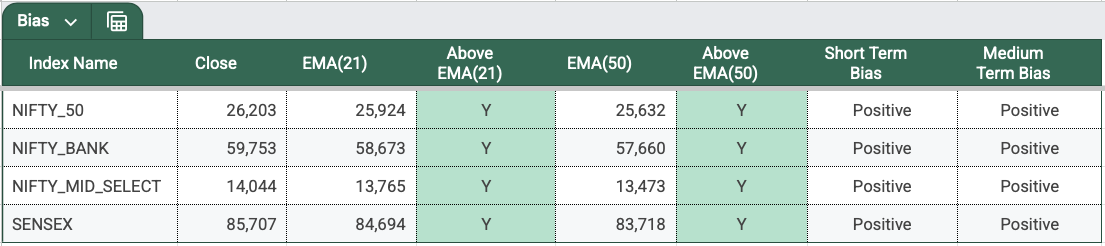
Just like last week, all four indices continue to hold a positive short-term and medium-term bias, with price staying above the 21 EMA and 50 EMA on the daily timeframe. The overall sentiment remains positive, with December historically being a positive month. I am hoping for a continuation.
Sectoral Performance
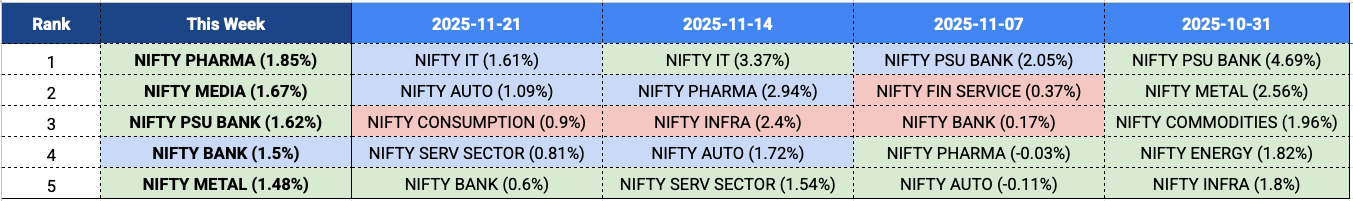
We have four new entrants: Pharma, Media, PSU Bank, and Metals. Nifty Bank has been at the top for the past two weeks. IT is taking a breather after being at the top for two weeks.
Volatility & Derivatives
Range, Straddle Prices & Expiries
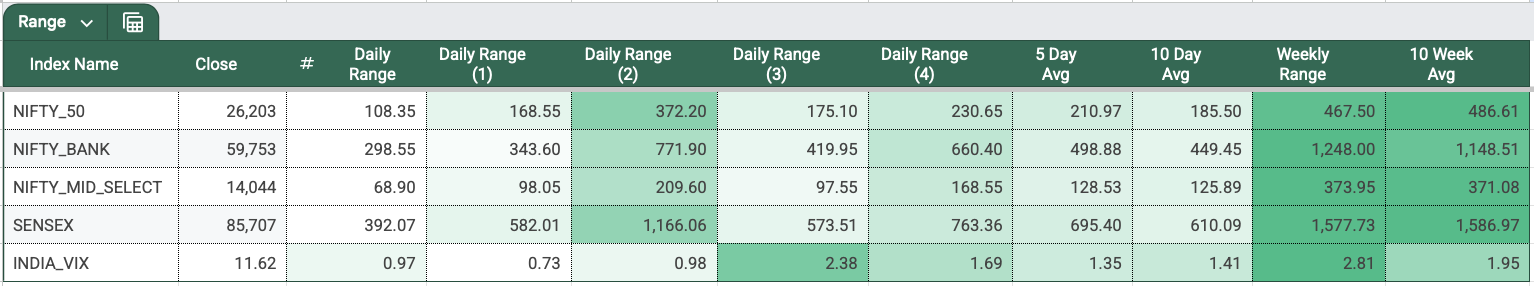
On Wednesday, all indexes recorded their highest range day of the week, a bit similar to last week. Not sure what’s happening on Wednesdays.
NIFTY’s 5-day average range is up to 210 from 160 last week. 10 Day Avg has also inched up from 177 to 185. Is volatility back?
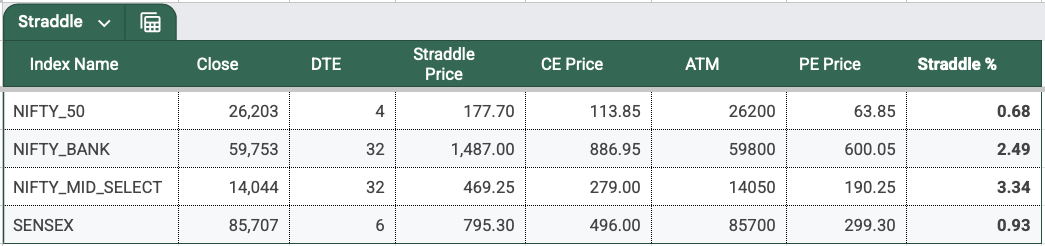
Meanwhile, the NIFTY 2DTE straddle premium is at just 177, down from 207 last week. This is odd because on the range we see an expansion, but straddle pricing is saying something else. Perhaps the options market is not pricing anything negative, and that’s showing in lower IVs also.
Now, talking about the NIFTY expiry—this week was the monthly expiry for NIFTY. Except for the last-hour drop of 175 points, the entire session was quiet, staying within a narrow 110-point range and NIFTY closing -75 points or -0.29%.
It turned out to be a straightforward expiry for non-directional traders. The straddle opened around 120 points—not a great premium for a monthly expiry, but given the expected volatility, the day played out relatively smoothly.
SENSEX expiry was not as straightforward. It saw a wide range of 582 points, with the ATM straddle priced at 325 points. The index moved sharply in both directions, making it a tough day for non-directional traders. And honestly, I’m not sure how long option buyers make money in such expiries—if you’re one of them, let me know in the comments below.
India VIX
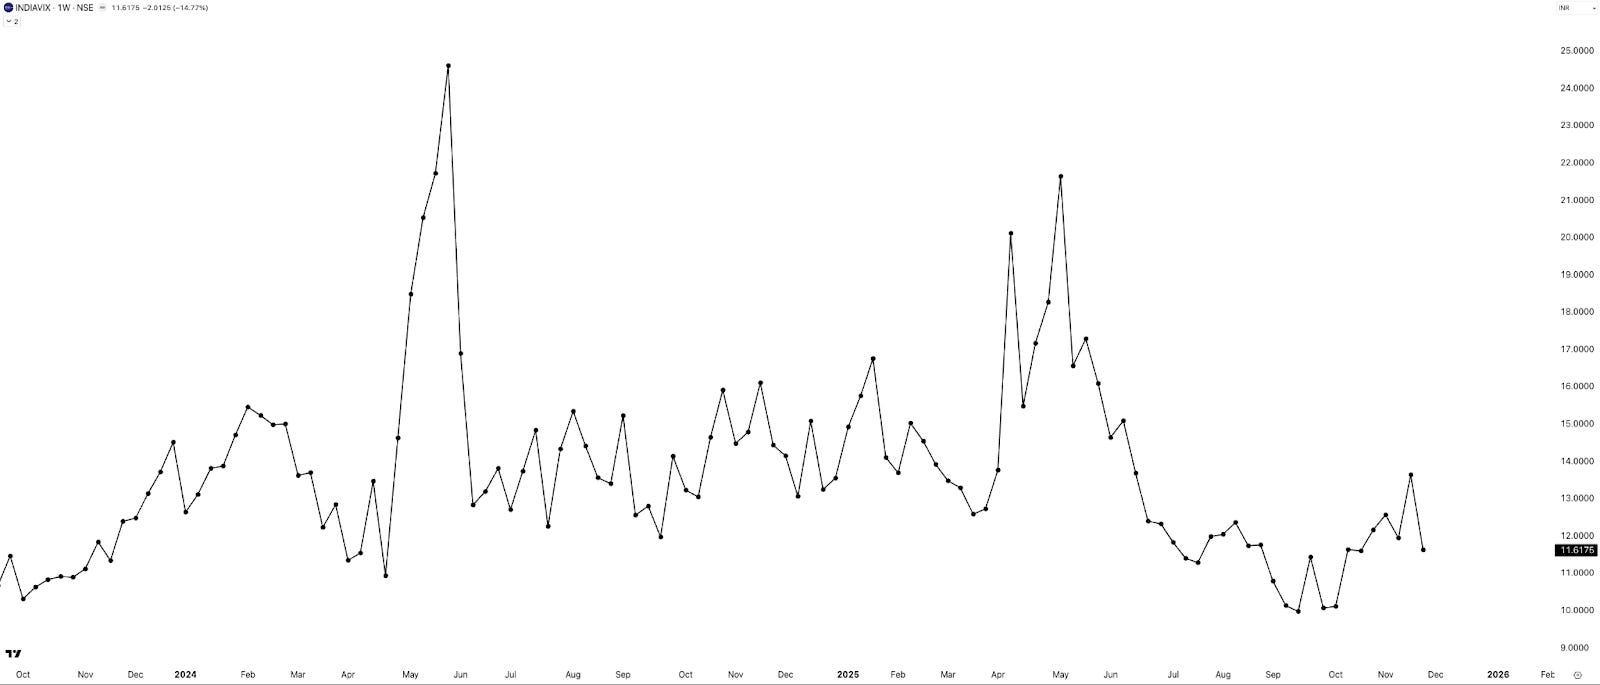
INDIA VIX dropped 15% this week after gaining a similar percentage last week. It closed at 11.62, down from last week’s 13.63. Nothing much to read into here, in my view.
Commodities Update
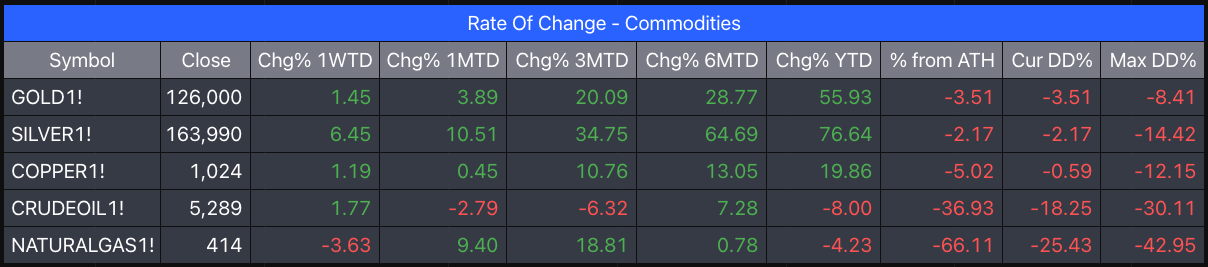
(Data: MCX Continuous Futures - Back Adjusted)
The commodity pack was firmly led by precious metals this week, particularly Silver.
Gold posted an okayish gain of 1.45%, consolidating its strong long-term trend, and now sits just 4% below its ATH and has a YTD return of 55%.
As I said, Silver was a standout, achieving a sharp weekly gain of 6.5% that led to a massive 76%+ YTD performance, signaling strong conviction.
Copper saw a mild gain, maintaining its healthy medium-term trend and staying less than 7% below its ATH.
On the energy side, Crude Oil was positive at 1.77%, while Natural Gas ended in red after a solid +9% on monthly basis. Overall, precious metals showed renewed strength, base metals remained firm, and energy is a mixed bag.
Summary & Looking Ahead
The markets are broadly positive this week. All indexes are at their ATHs, and (INDIAVIX), our volatility index is also indicating calm. So, as we step into December, as of this week, it looks like we should get a continuation of this uptrend.
What to Expect Next Week
Next week is the first week of December, and we’ve got a full five-day trading stretch with RBI interest rate decisions on 5-Dec, Friday at 10 AM. Will the Friday volatility be back? We will have to wait and see.
Also, let’s see if the market continues on its uptrend, making new highs, or chooses to consolidate a bit before making its next move. It’s always better to react than to predict.
So that’s pretty much it for this week. And yes—don’t forget to subscribe to the channel.
Until then—stay curious, stay steady, and have a great weekend!
See you soon!