Hello and welcome to Weekly Market Metrics!
We’re in Week 49 of the year—and honestly, the “unkept resolutions” jokes are getting stale, and even thinking about it is stressing me out, so I will skip it for the greater good.
This week was eventful.
The Indian rupee hit a new low at ₹90 per dollar. The RBI cut the repo rate by 25 basis points to 5.25%, and SEBI made headlines with its major crackdown on unregistered trainers—another big development this week.
SEBI has barred finfluencer Avadhut Sathe from the markets and impounded a whopping ₹546 crore in illegal gains from his unregistered services. According to the 125-page order, his modus operandi was strikingly similar to what we discussed in a previous episode on the dark side of trading education in India.
Toward the end of the week, on Friday around 2:15 PM, a Cloudflare outage took down several websites—including Kite Web and Kite Mobile. So what do you do in a chaotic situation like that? You can still manage your orders using Kite Backup on WhatsApp.
Over to the markets—it’s time for our weekly dose of market metrics.

NIFTY hit a new high this week but faced some selling pressure, bringing the index down 435 points, or 1.65%, from the peak. However, the market regained momentum after the RBI cut the repo rate on Friday, ending almost close to where it was last week.
So, the pullback after hitting an all-time high might be over, and the market could head higher from here, or it could remain range-bound for the next week. Let’s dive into the charts to see how the action unfolded, and try to gauge where the markets might be headed in the coming week.
As always, Nifty first.
NIFTY 50 - Technical Analysis
Weekly Timeframe
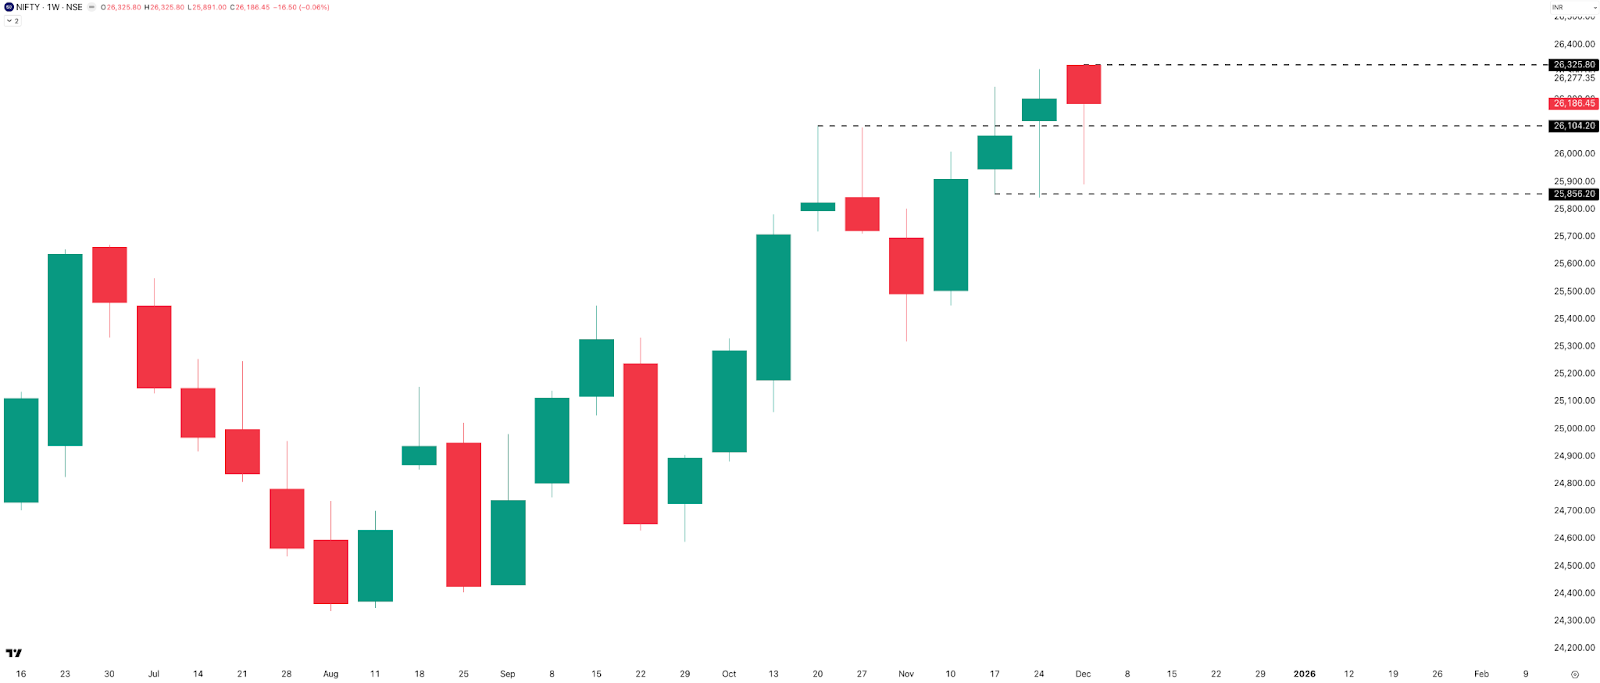
For the week, NIFTY was slightly negative, giving up 17 points from the previous week’s close (–0.06%). It printed a red candle after three consecutive green weeks and ended at 26,186.
During the week, NIFTY slipped below 26,100—a key support level—and nearly tested the 25,900 zone, which lines up with the lows of the past three weeks. Buyers have consistently stepped in around the 25,900–25,800 levels. The weekly range came in at 435 points, or about 1.65%, showing just how volatile the week was.
Since I’m a glass-half-full person, I’m not reading this candle as a hanging man. I’m leaning towards a bullish trend continuing pattern.
Key levels to watch: Resistance at 26,200 and then all-time high at 26,325, and Support first at 26,100, then deeper at 25,900–25,800 zone.
Daily Timeframe
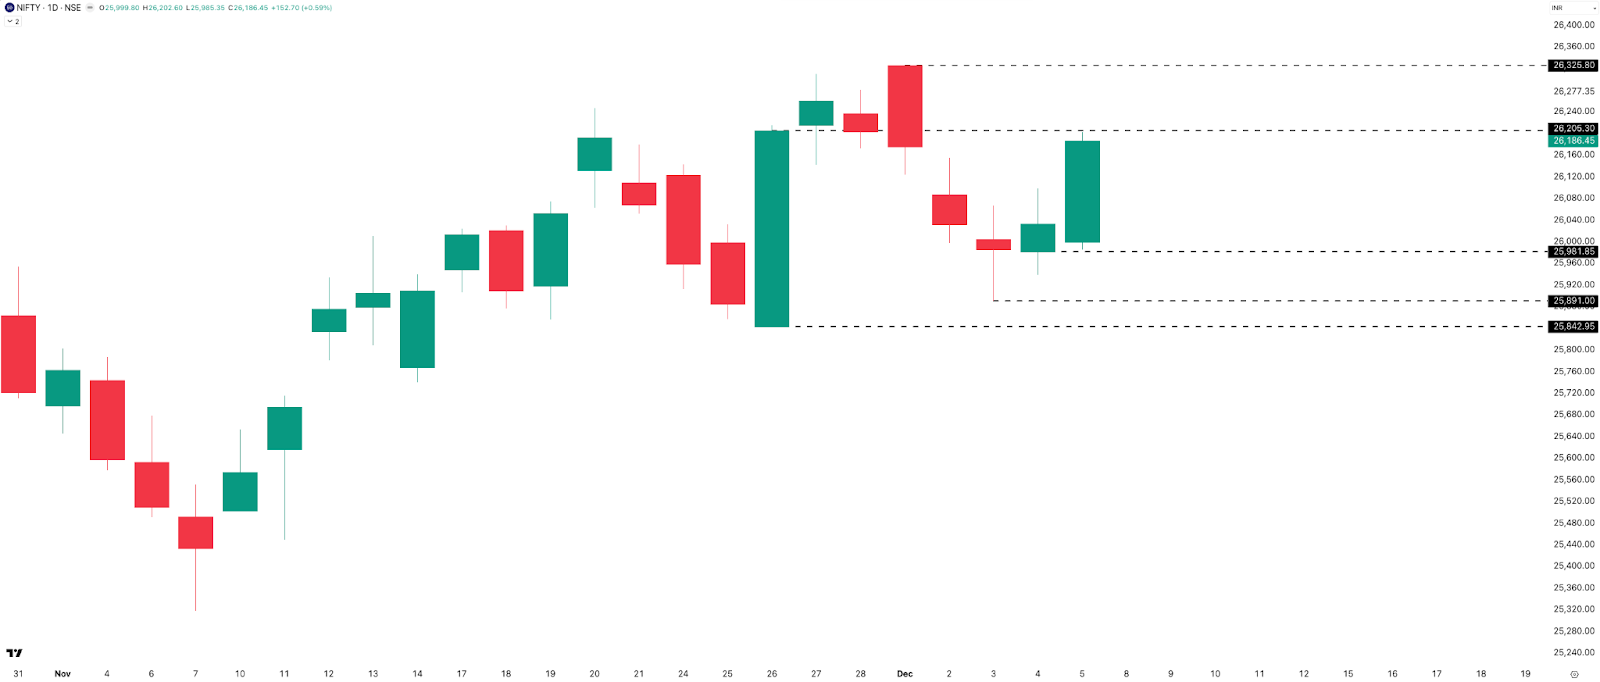
Similar to last week—where Monday and Tuesday were negative—this week also opened with three down days, even after making a new ATH on Monday. Thursday finally offered some relief, and Friday, after the RBI rate-cut announcement, the market resumed its upward move, gaining 153 points (+0.59%) to close at 26,186. It did find some resistance at the 26,200 level.
On the daily chart, resistance sits at 26,200 and then at the ATH of 26,325. Support remains at the 26,000–25,900 zone.
So the big question now is: will NIFTY take out the ATH next week, or will it mean-revert from the highs? Honestly, your guess is as good as mine. Looking at Friday’s candle, it does feel like the uptrend should sustain. Let’s see how it actually plays out.
Hourly Timeframe
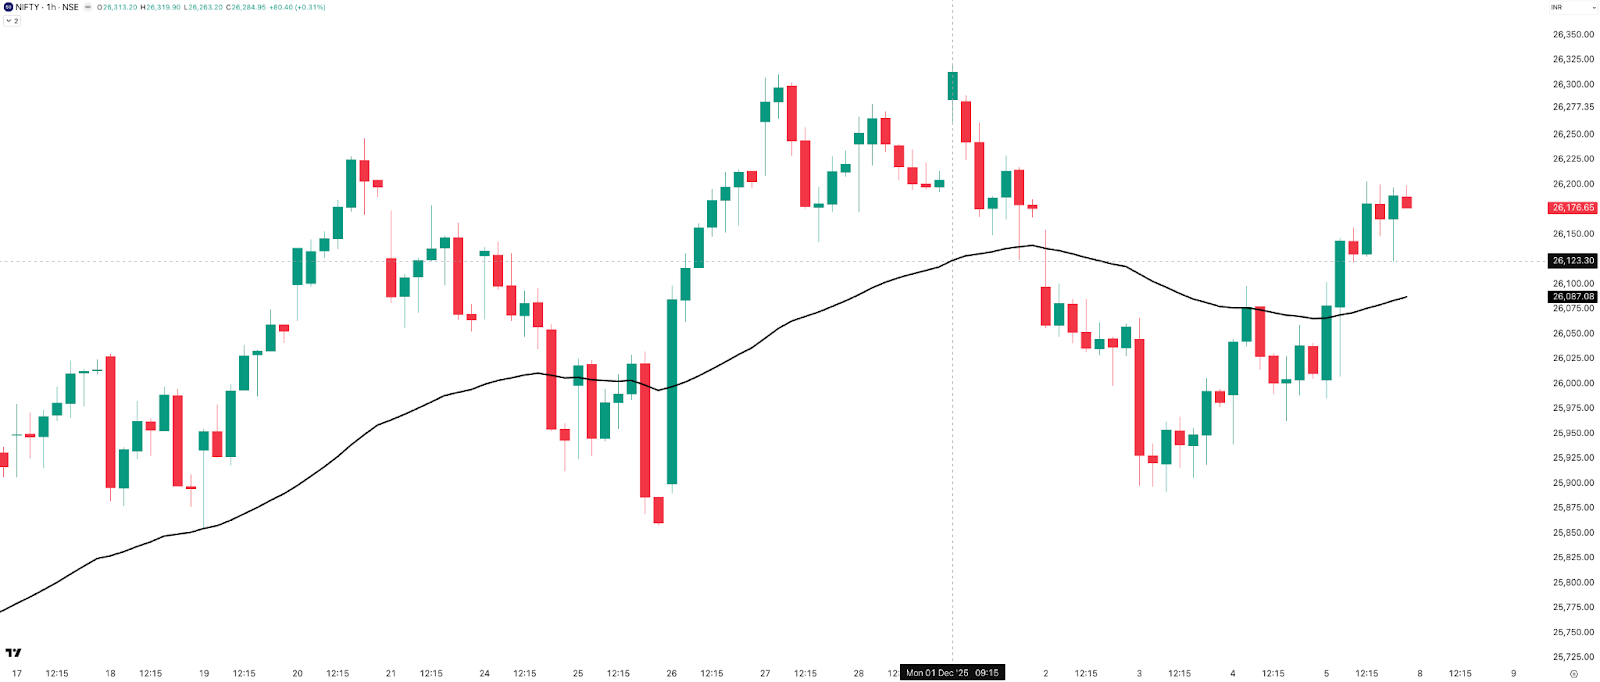
On the 1-hour chart, the index kept chopping around the 50 EMA, making it tough for trend followers to get a clear read. NIFTY started strong on Monday, dipped below the EMA on Tuesday, and—as we’ve seen in the past—failed to stay below it, climbing back above by Friday.
As of Friday’s close, NIFTY is sitting roughly 90 points above the 50 EMA. The EMA itself is still around 26,100, almost unchanged from last week, since the index went nowhere on a closing basis through the week.
Overall, the hourly bias remains positive.
Overnight vs. Intraday Moves
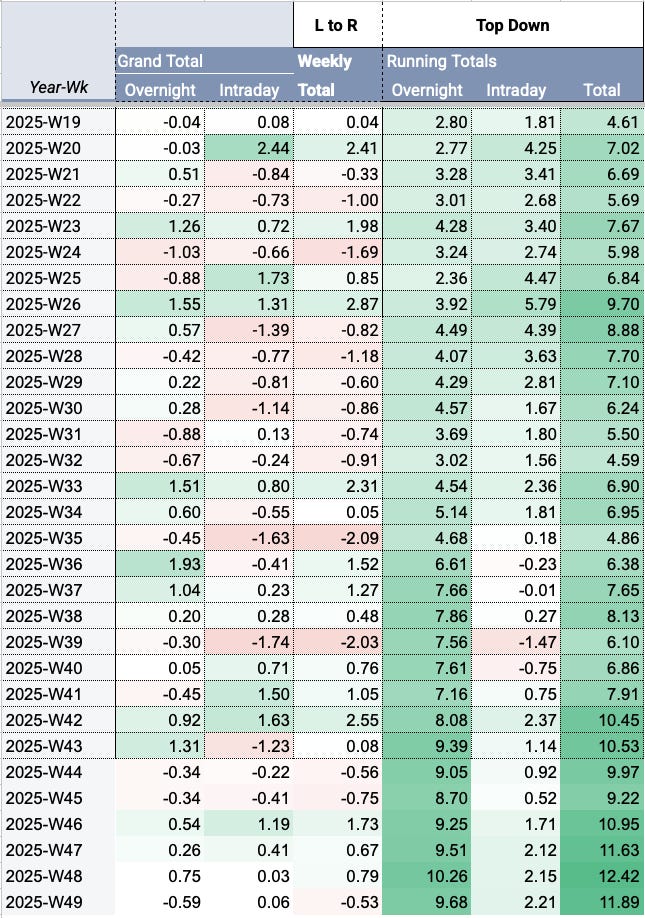
Overnight moves were negative this week, and intraday moves continued to stay muted. NIFTY gapped up on Monday, but the gap-down open on Tuesday and Wednesday wiped out those gains. For Week 49 of 2025, NIFTY logged –0.59% overnight returns, with intraday returns remaining muted at +0.06%.
For CY 2025, NIFTY has gained +9.68% from overnight moves and +2.21% from intraday moves—a set of numbers that have basically gone nowhere for the last six weeks.
BANK NIFTY - Technical Analysis
Weekly Timeframe
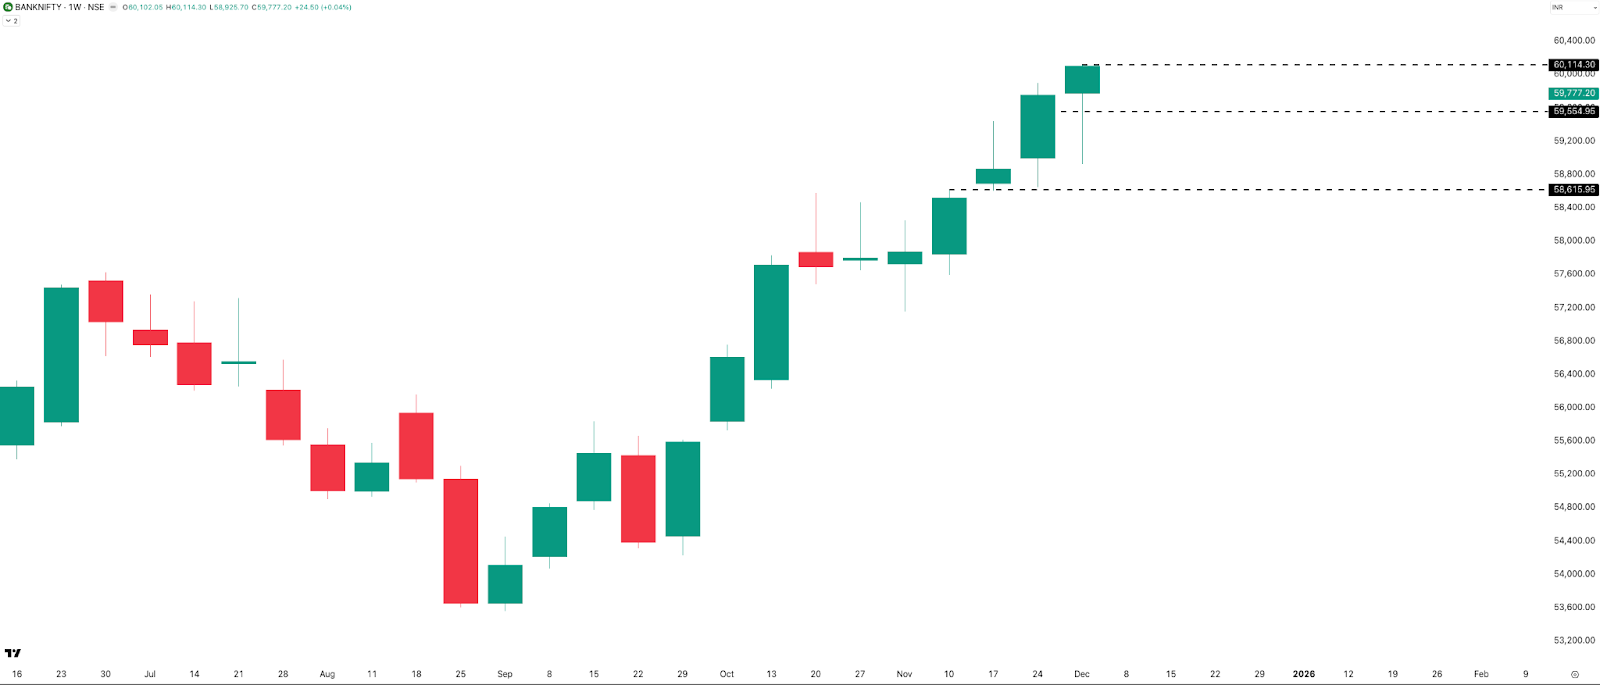
BANKNIFTY was flat just like NIFTY, gaining only 25 points (+0.04%). It hit a new all-time high on Monday at 60,114 before closing 337 points lower at 59,777.
This week’s range came in close to 1,200 points, or about 2%, which is nearly the same as last week’s 1,250-point range.
This is the sixth green weekly candle. Is it a hanging man on the BANKNIFTY weekly chart? We’ll only know next week once we see the follow-through.
Resistance is at the ATH of 60,114, and support sits around this week’s and last week’s low near 59,000, followed by 58,600. Overall, BANKNIFTY still looks bullish on the weekly chart—but as always, next week will reveal how strong that trend really is.
Daily Timeframe
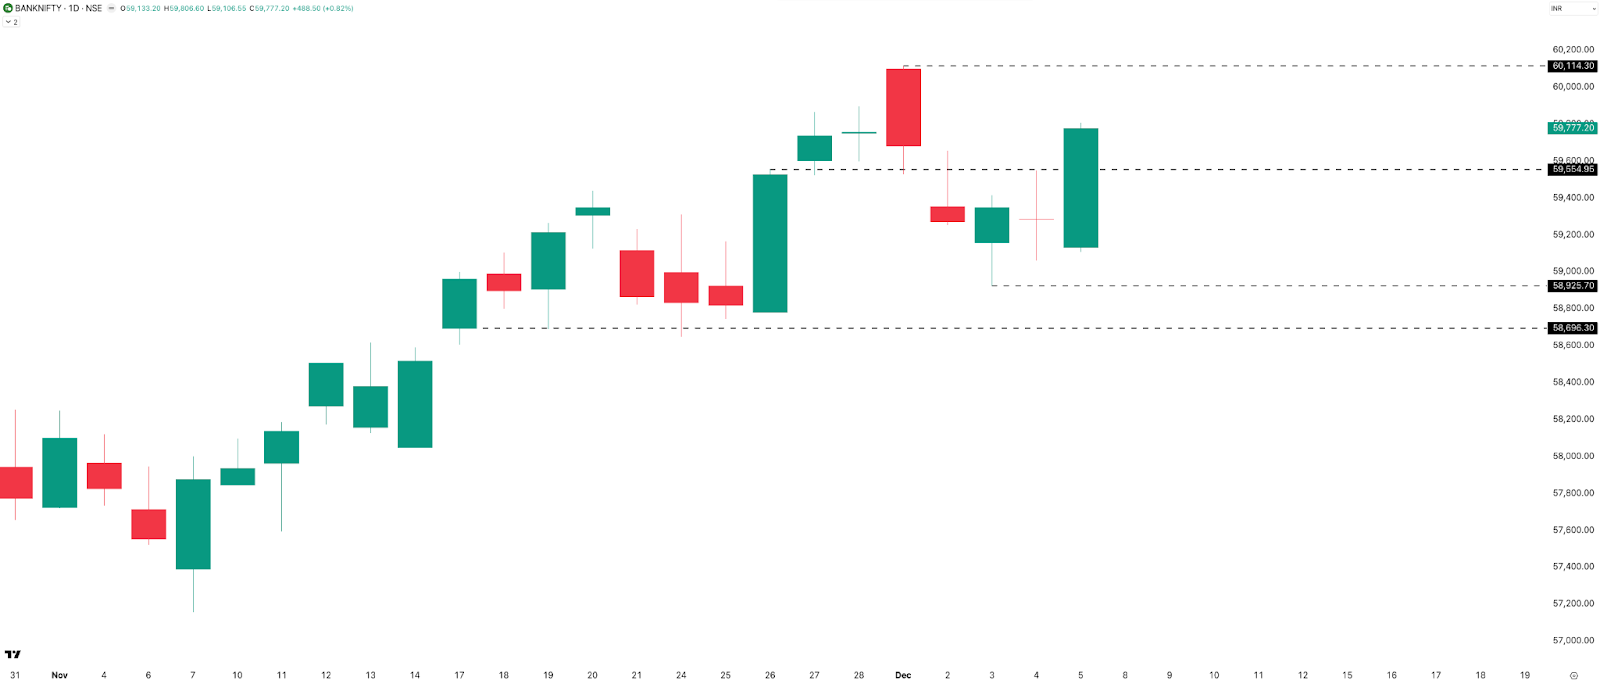
BANKNIFTY printed red candles on Monday and Tuesday, followed by green candles on Wednesday and Friday. Thursday formed a doji—an indecision candle.
Friday’s strong green candle suggests the uptrend may continue, but the real confirmation will come only when we get a daily close above the ATH. Resistance remains at the ATH of 60,114, with support at 59,500, and then deeper levels at 58,900 and 58,700.
The trend stays sideways to bullish unless the ATH is taken out decisively.
Hourly Timeframe

BANKNIFTY mirrors NIFTY almost perfectly—above the 50 EMA on Monday, dipped below it on Tuesday, chopped around midweek, and then climbed back above on Friday.
Overall, the bias stays sideways to bullish, with price sitting about 343 points above the 50 EMA.
NIFTY MIDCAP SELECT - Technical Analysis
Weekly Timeframe
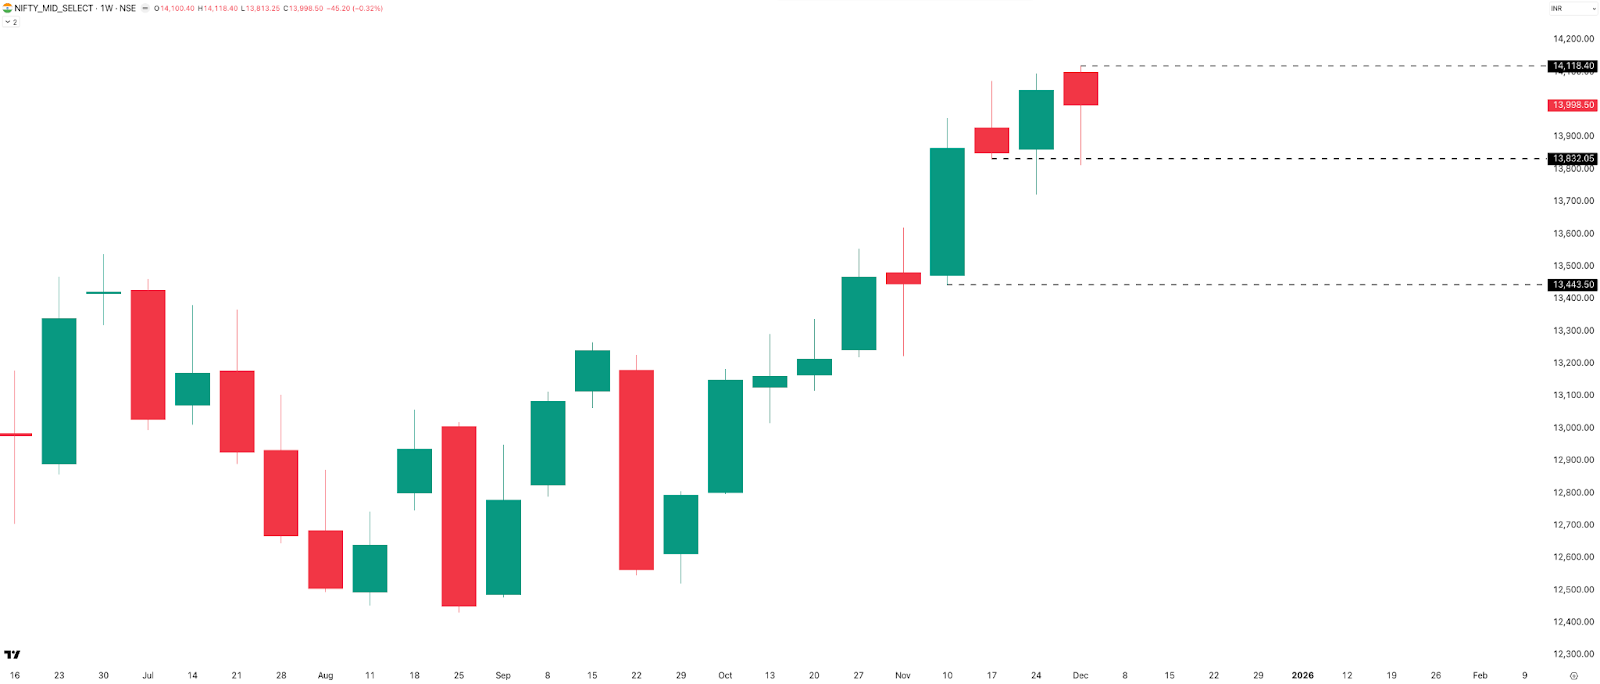
MIDCPNIFTY hit a new all-time high again this week at 14,118, which now acts as the immediate resistance. The index lost 0.32%, or 45 points, for the week and closed at 13,998.
The range for the week came in at 305 points, roughly 2.16%, which is lower than last week’s range of 374 points (about 2.65%).
Support sits at 13,850 and then at 13,450, similar to last week, with resistance at the new ATH of 14,118. The sentiment remains sideways to bullish, similar to BANKNIFTY.
Daily Timeframe
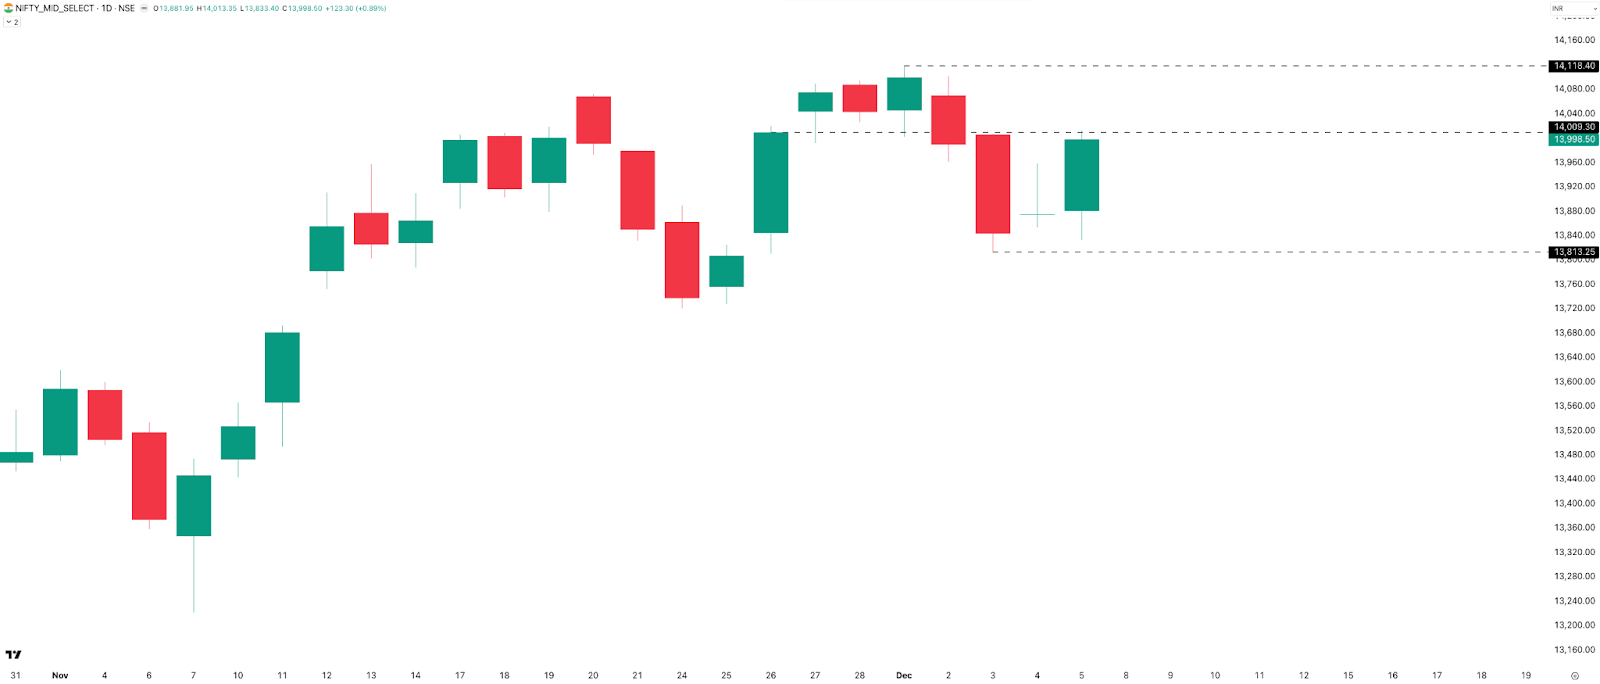
MIDCPNIFTY printed two green candles, two red candles, and a doji on Thursday. It hit a new ATH on Monday—just like BANKNIFTY—but eventually closed 120 points, or 0.85%, below the high.
Resistance remains the same as on the weekly timeframe at 14,118, while support sits at 14,000 and then 13,800.
SENSEX - Technical Analysis
Weekly Timeframe
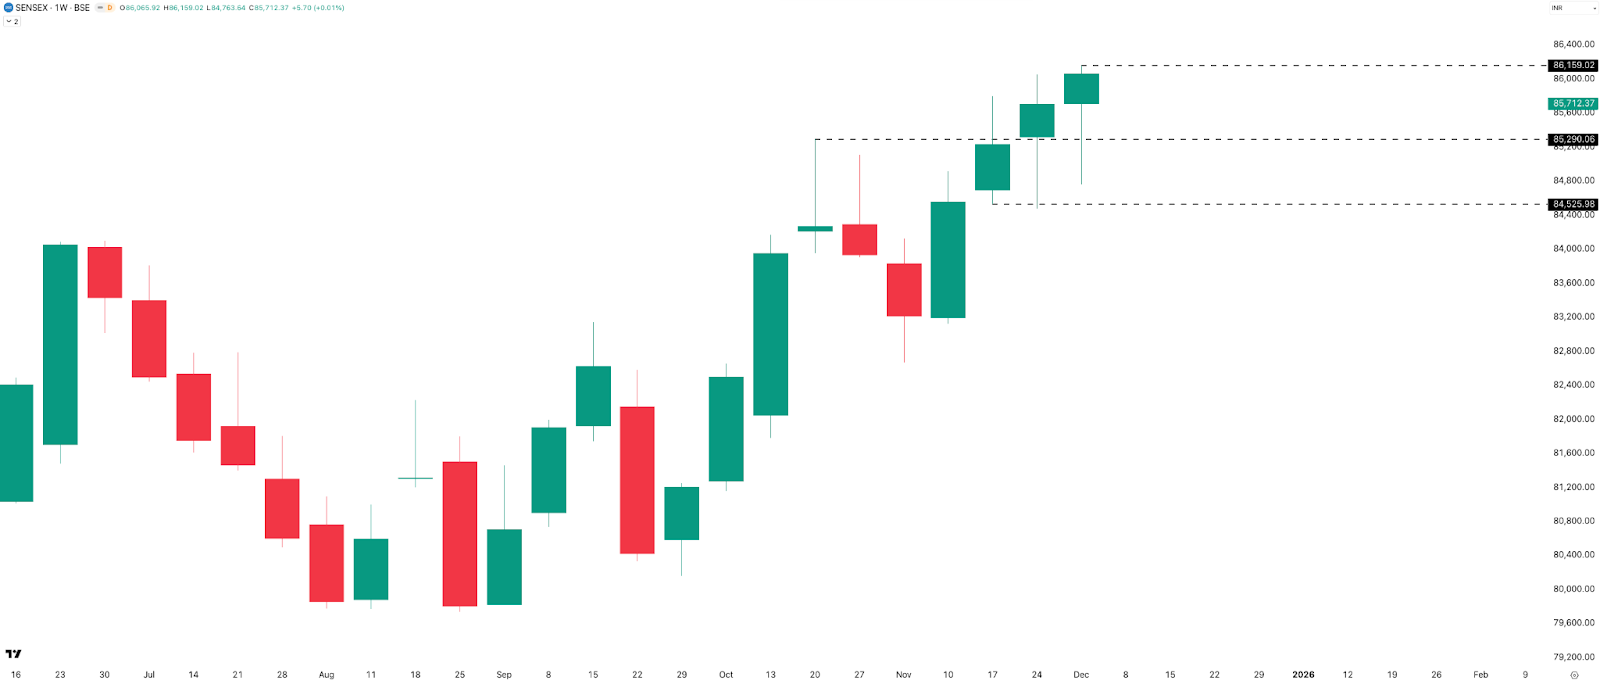
SENSEX finally hit a new all-time high again this week at 86,159. SENSEX remained flat, gaining just 6 points week to close at 85,712—its highest weekly close ever for the second week in a row. This week marks 4 consecutive green weekly candles.
Immediate resistance is at 86,159, with support at 85,300 and then 84,600.
Daily Timeframe
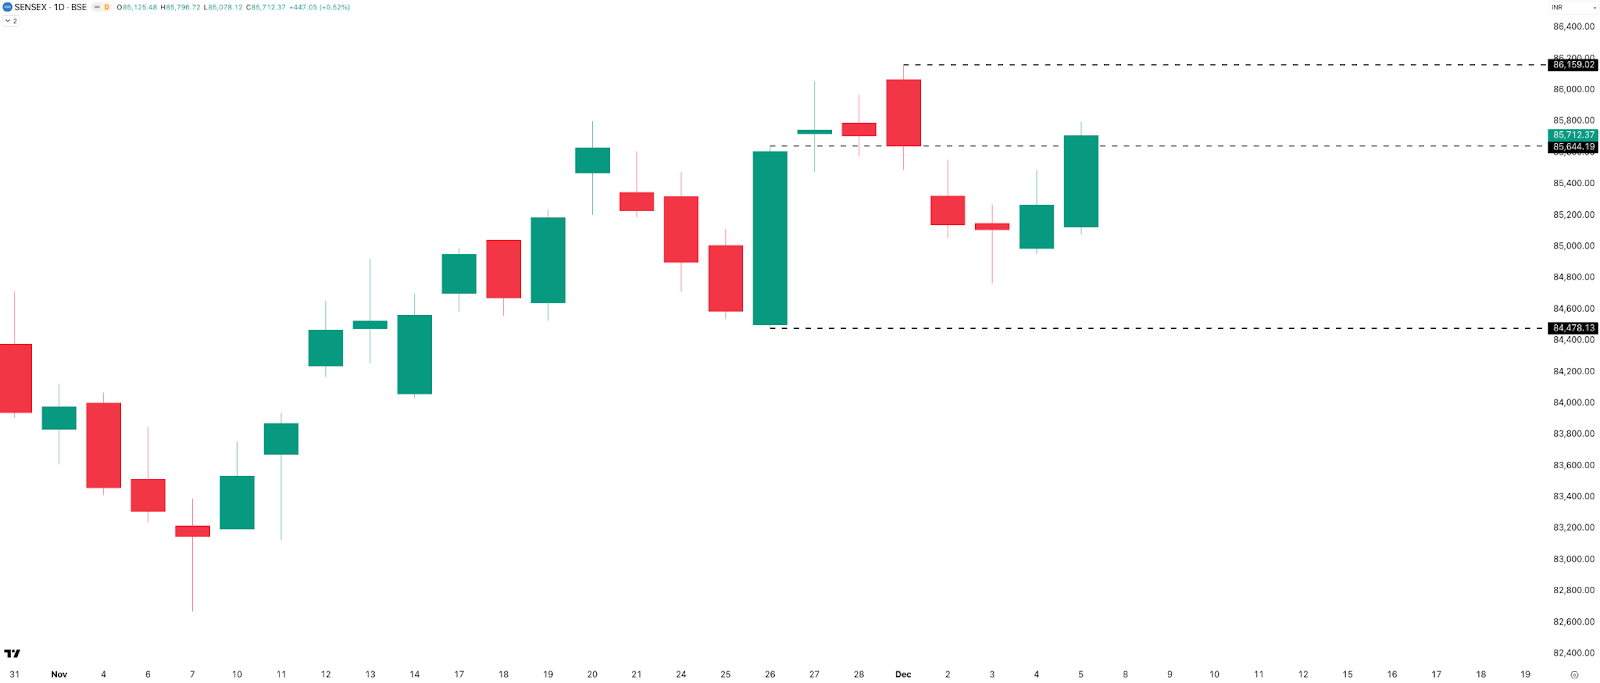
SENSEX printed three straight red candles followed by two green candles, with Friday being the strongest—gaining 447 points, or 0.52%.
Resistance remains at 86,159, with support at 85,650 and then 84,500. Overall, the bias for SENSEX also stays sideways to bullish.
Market Metrics Summary
Rate of Change
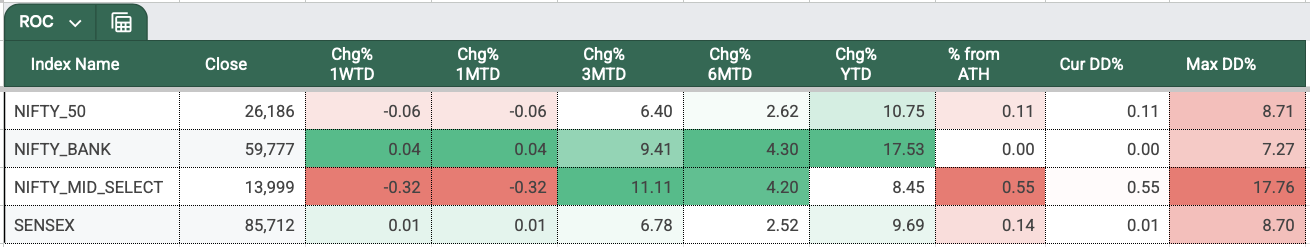
It was a pretty muted week across all indices, with WTD returns hovering around zero. All four indices are sitting close to their all-time highs, which you can see from the Cur DD% column being near zero.
Talking about year-to-date performance: BANKNIFTY leads with +17.5%, NIFTY follows at +10.75%, SENSEX sits at +9.69%, and MIDCPNIFTY trails slightly at +8.45%.
Directional Bias
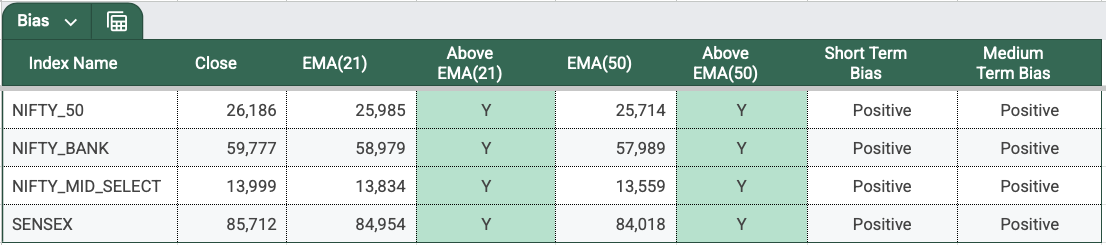
Just like the past two weeks, all four indices continue to hold a positive short-term and medium-term bias, with price staying above the 21 EMA and 50 EMA on the daily timeframe. Even if some indices appear sideways to bullish, the directional bias based on the slow and fast EMAs is still clearly positive.
Sectoral Performance
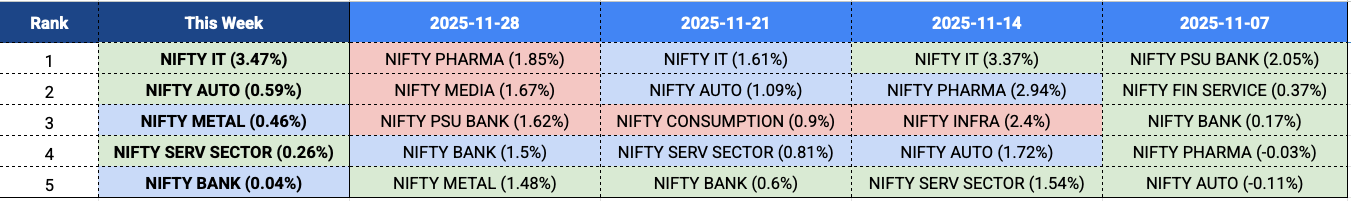
IT is back after taking a breather last week, delivering a solid +3.47%. METAL and BANK continued their strength from the previous week, while AUTO and SERVICES joined IT as the new entrants on the leaderboard.
Volatility & Derivatives
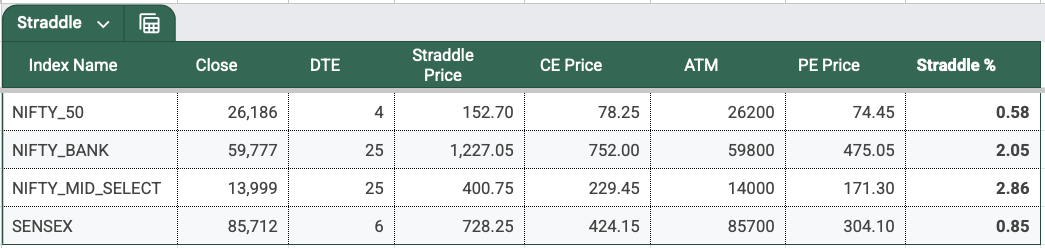
Range, Straddle Prices & Expiries
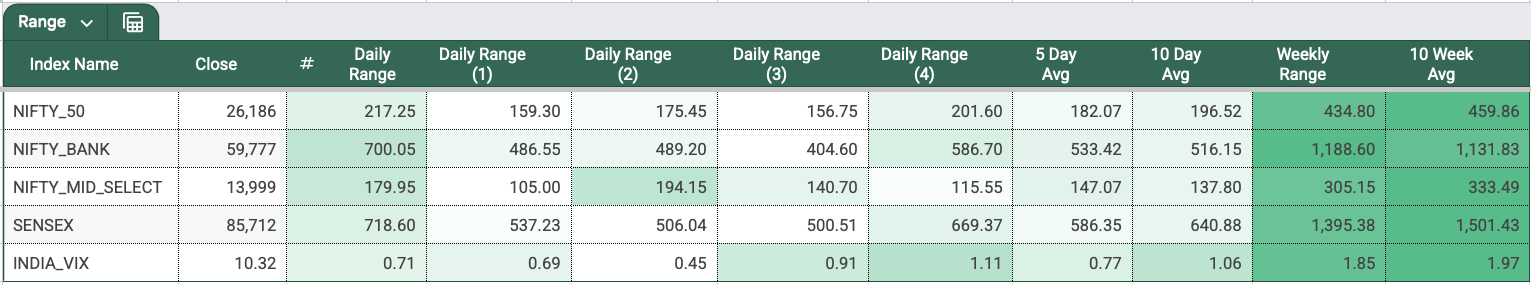
Friday volatility is back. The RBI’s interest rate decision fueled the action, and the hour after 10 AM was especially choppy. The market eventually moved higher, making Friday the highest-range day of the week for NIFTY 50, BANKNIFTY, and SENSEX. For MIDCPNIFTY, however, the widest move of the week came on Wednesday.
NIFTY’s 5-day average range has dipped to 182, down from last week’s 210. The 10-day average range has inched up slightly from 185 to 197.
Meanwhile, the NIFTY 2DTE straddle premium is sitting at just 153, down from 177 last week and 207 the week before that.
What’s driving such low IV? No fear of weekend events either? That’s the real question.
Now, talking about the NIFTY expiry—this week, NIFTY’s expiry-day range came in at 157 points. It opened 87 points down, and while the overall intraday action didn’t feel extremely volatile, the entire range was actually established within the first hour.
From there, the index moved up 159 points, then down 135 points, and finally bounced 100 points to close 143 points lower, finishing the day at –0.55%.
SENSEX expiry on Thursday played out similarly, with a 537-point range formed in the first hour itself. After that, the index dropped 470 points, then surged 357 points in the last two hours. It eventually closed +158 points on the day. The last hour was very volatile as it happens on most expiries lately.
India VIX
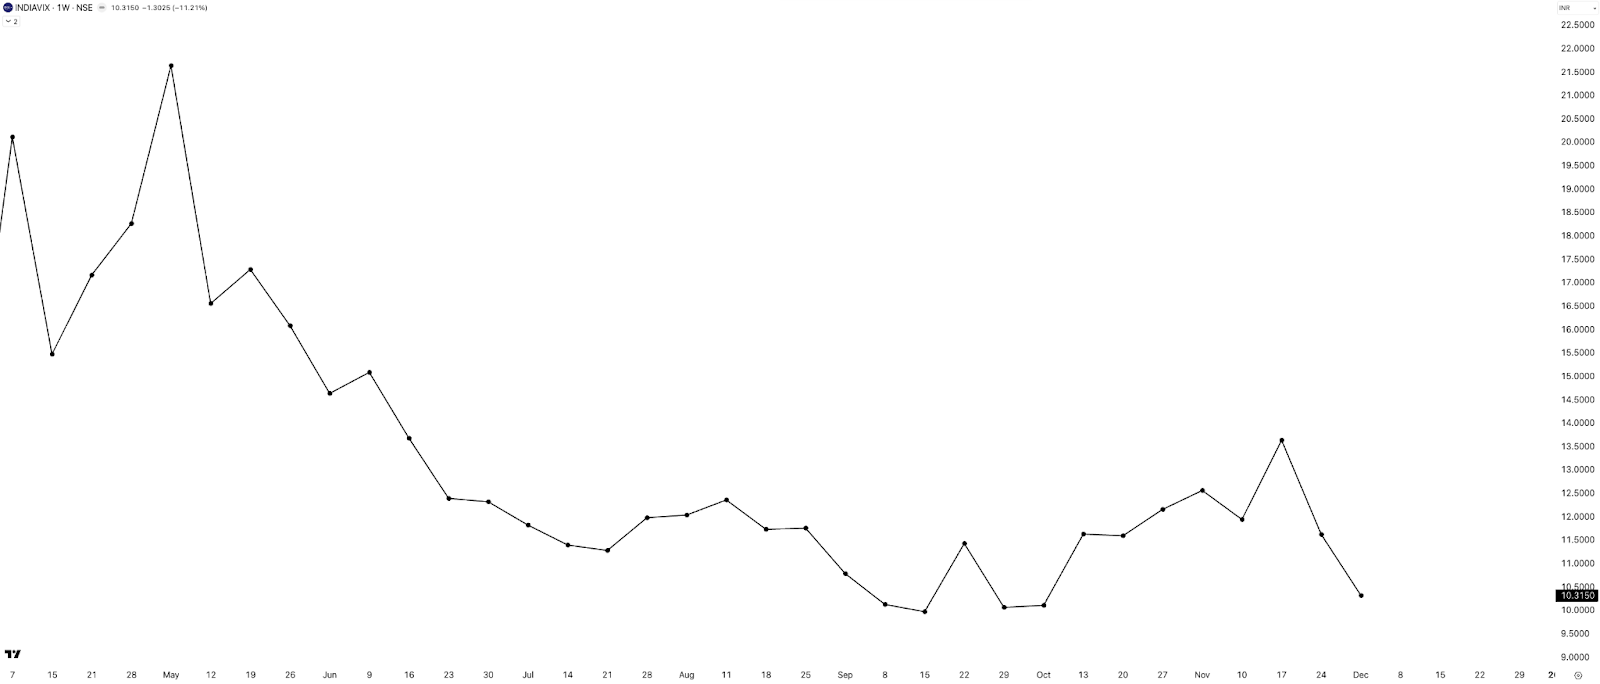
INDIAVIX fell another 11% this week after last week’s 15% drop, closing at 10.3. Will it slip into single digits soon? If it does, that would set a strong tone for a continued upmove in the indices.
Commodities Update
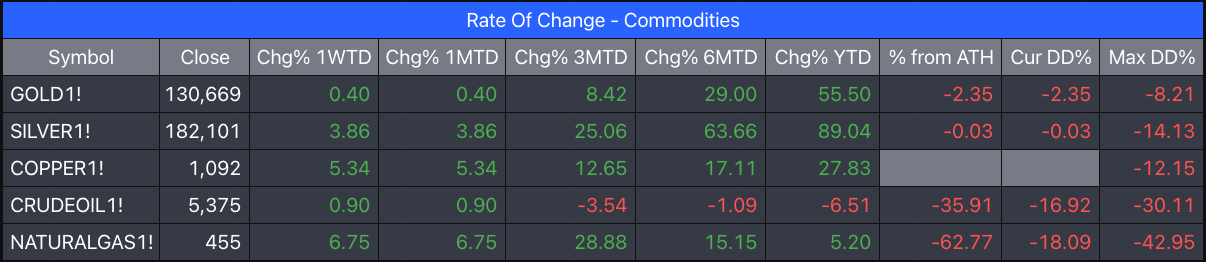
(Data: MCX Continuous Futures - Back Adjusted)
The commodity pack this week was led by Natural Gas, which was up by 6.75%, next was Copper at 5.34% clocking in a YTD gain of 27.83%.
Among the precious metals, Silver did better than gold this week and moved up 3.84% while gold was muted. On the energy side, Crude Oil though positive was also positive. Overall, the entire commodities pack that we track was in green, with Copper and Natural Gas leading.
Summary & Looking Ahead
The markets were fairly choppy this week. Indexes made ATHs but gave up their strength on some selling pressure, only to regain strength again on Friday, and (INDIAVIX), our volatility index fell further, indicating calm. Commodities are all in green, and the dollar hits a new high at 90.
So the first week of December was more of a reminder that we should never take the markets for granted. You never know what’s in store, and yes, as the fabled saying goes, diversification is perhaps the only free lunch.
What to Expect Next Week
Next week is the second week of December, and we’ve got a full five-day trading stretch with the FED interest rate decisions on 11th December, Thursday at 12:30 AM IST, which may have a minor effect on Friday’s open.
Last week, we asked if Friday volatility would be back—it seems it has.
Also, let’s see if the market continues on its uptrend, making new highs, or chooses to consolidate a bit before. It’s always better to react than to predict. But as always, I am hoping against hope that we get a Santa rally in the coming weeks, but it’s better to wait for the prices to confirm.
So that’s pretty much it for this week. And yes—don’t forget to subscribe to the channel.
Until then—stay curious, stay steady, and have a great weekend!
See you soon!